Uniswap Price Prediction: UNI bulls try to shift the odds in their favor
- UNI is currently trading at $3.17, trying to recover from the extended pullback to $2.47.
- The bulls are taking control of the short-term timeframes and are eying up $4.

Uniswap started trading as high as $7 on its first day but quickly fell off due to the intense selling pressure. The digital asset reached a $700 million market capitalization on September 18. Despite the downtrend, the market cap has increased again to $641 million due to more circulating supply.
UNI bulls eying up $4 in the short-term
Uniswap has been trading between $2.4 and $3.7 for around two weeks now. It seems that investors aren't sure in which direction the digital asset is going next. UNI's price has established a higher low at $2.88 compared to the low of $2.47, a positive step for the bulls.
UNI/USDT 4-hour chart
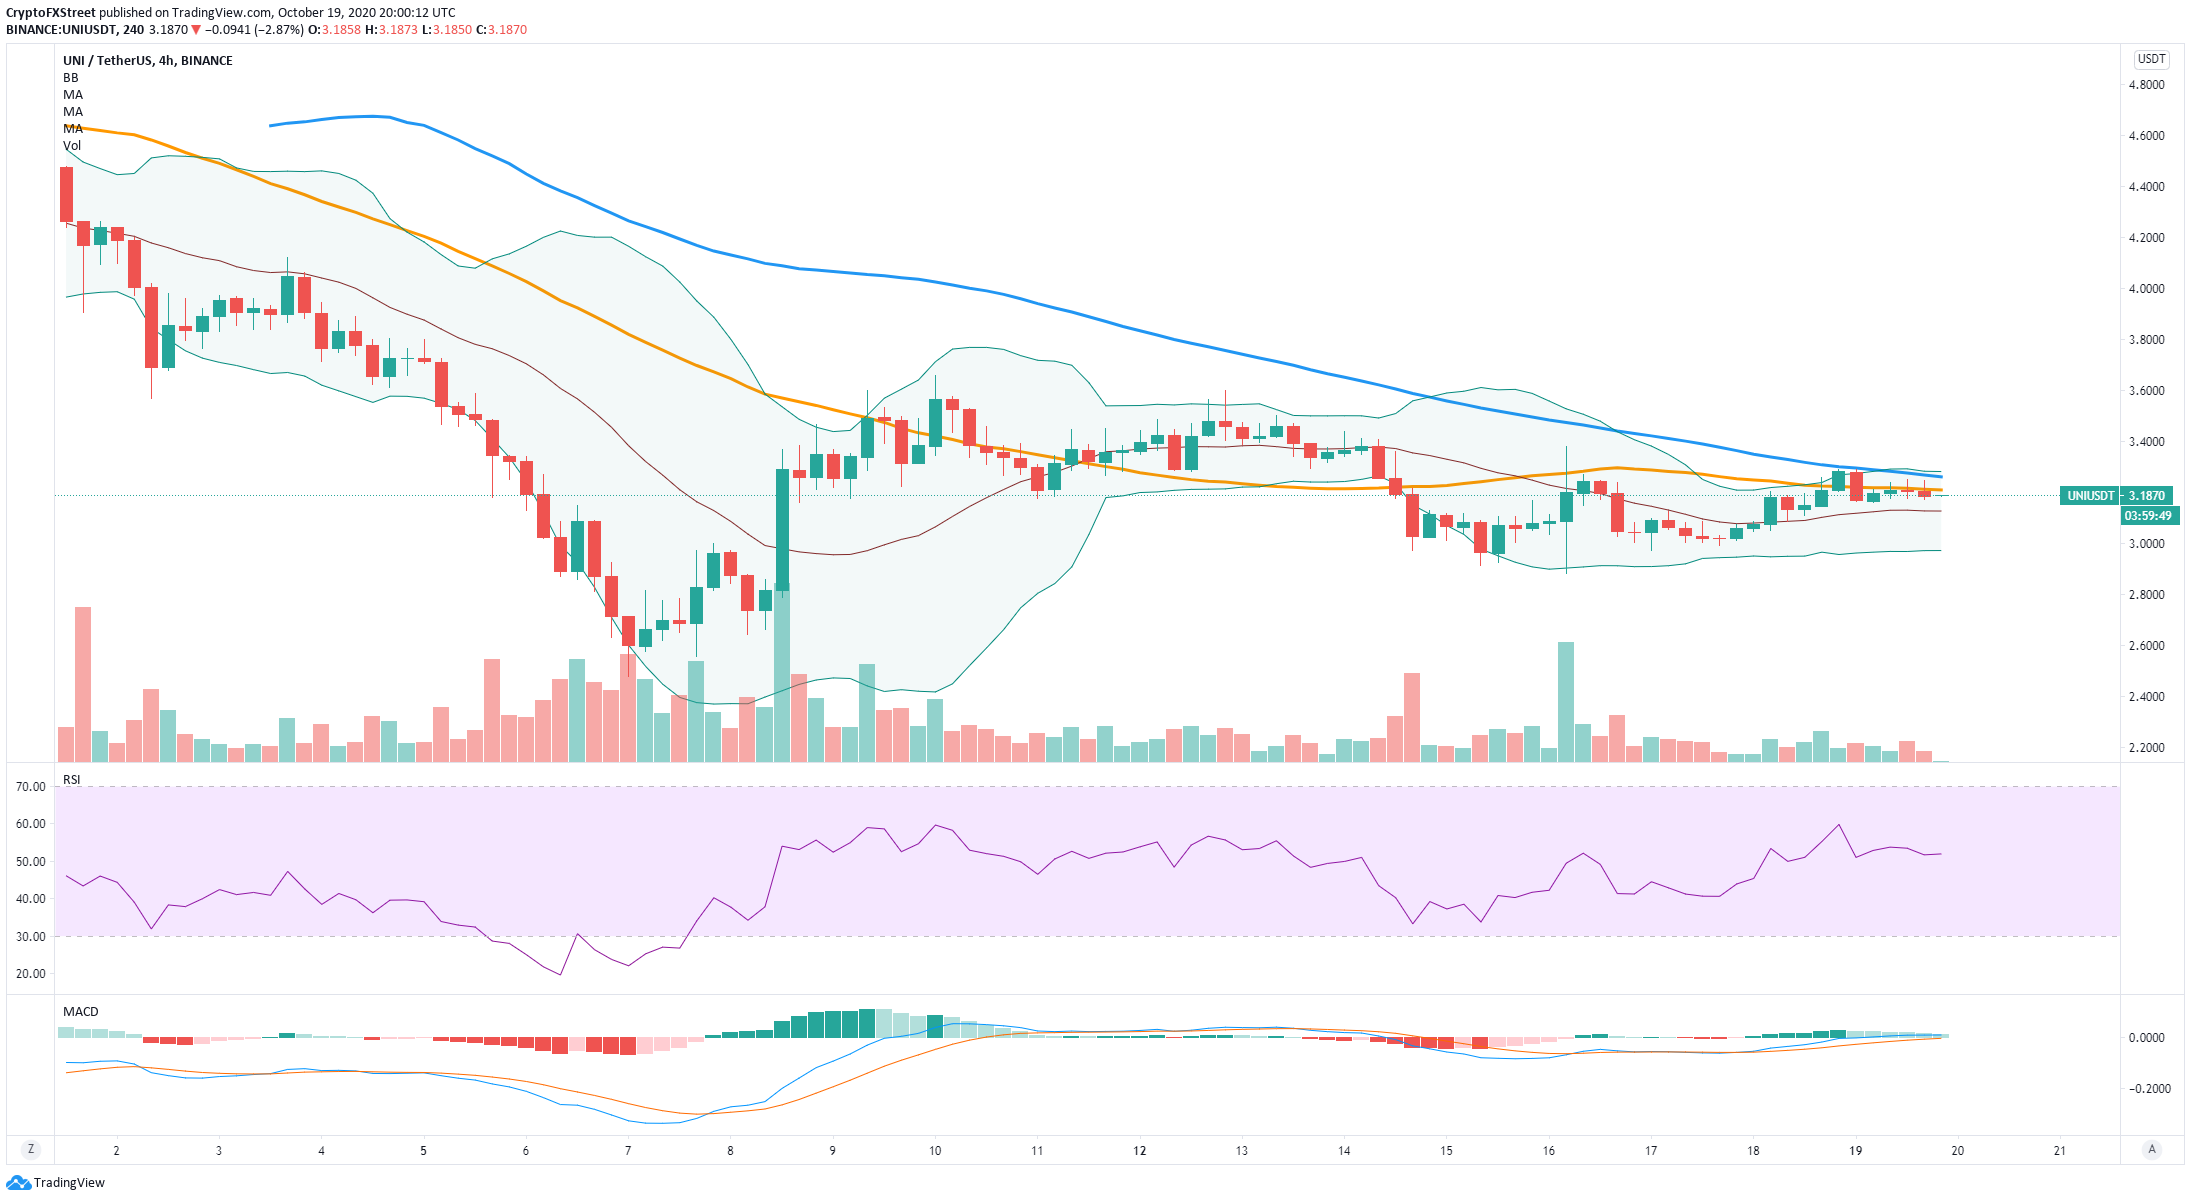
On the 4-hour chart, UNI has formed several higher lows and higher highs, confirming an uptrend. The next hurdle on the way up is the 50-SMA at $3.2, followed by the 100-SMA at $3.3. The Bollinger Bands are also squeezing again, indicating that a potential significant move is underway.
UNI's trading volume is also declining, another primary indicator that a spike in the price is nearby. A breakout above $3.2 and $3.3 can easily push the digital asset up to the last daily high of $3.65 and potentially to the psychological level at $4 as there is very little resistance to the upside.
UNI IOMAP Chart
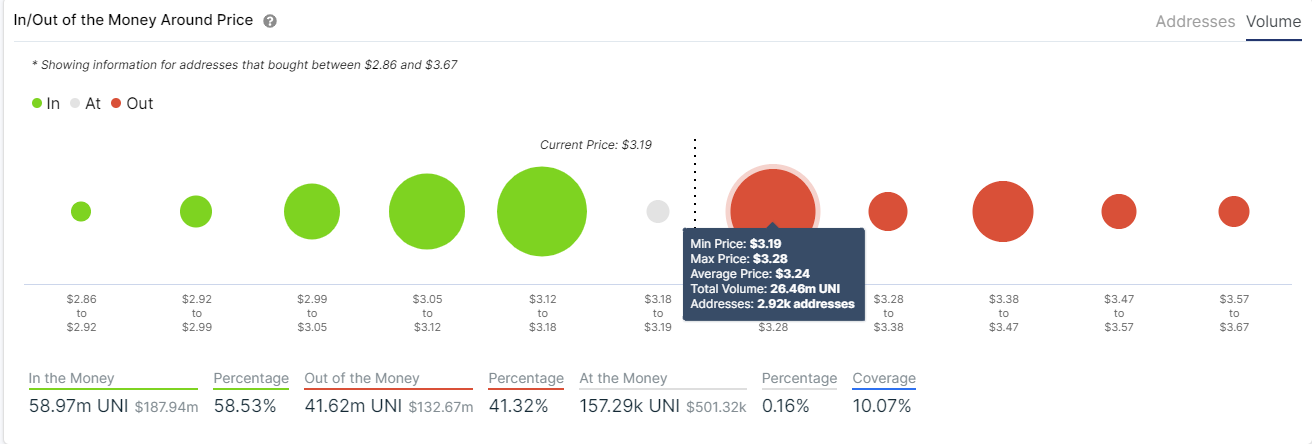
The In/Out of the Money Around Price chart seems to confirm this theory showing a substantial resistance area between $3.19 and $3.28, where 26 million UNI tokens were bought. In comparison, the support of UNI until $2.99 is far stronger than the resistance above.
UNI/USDT daily chart
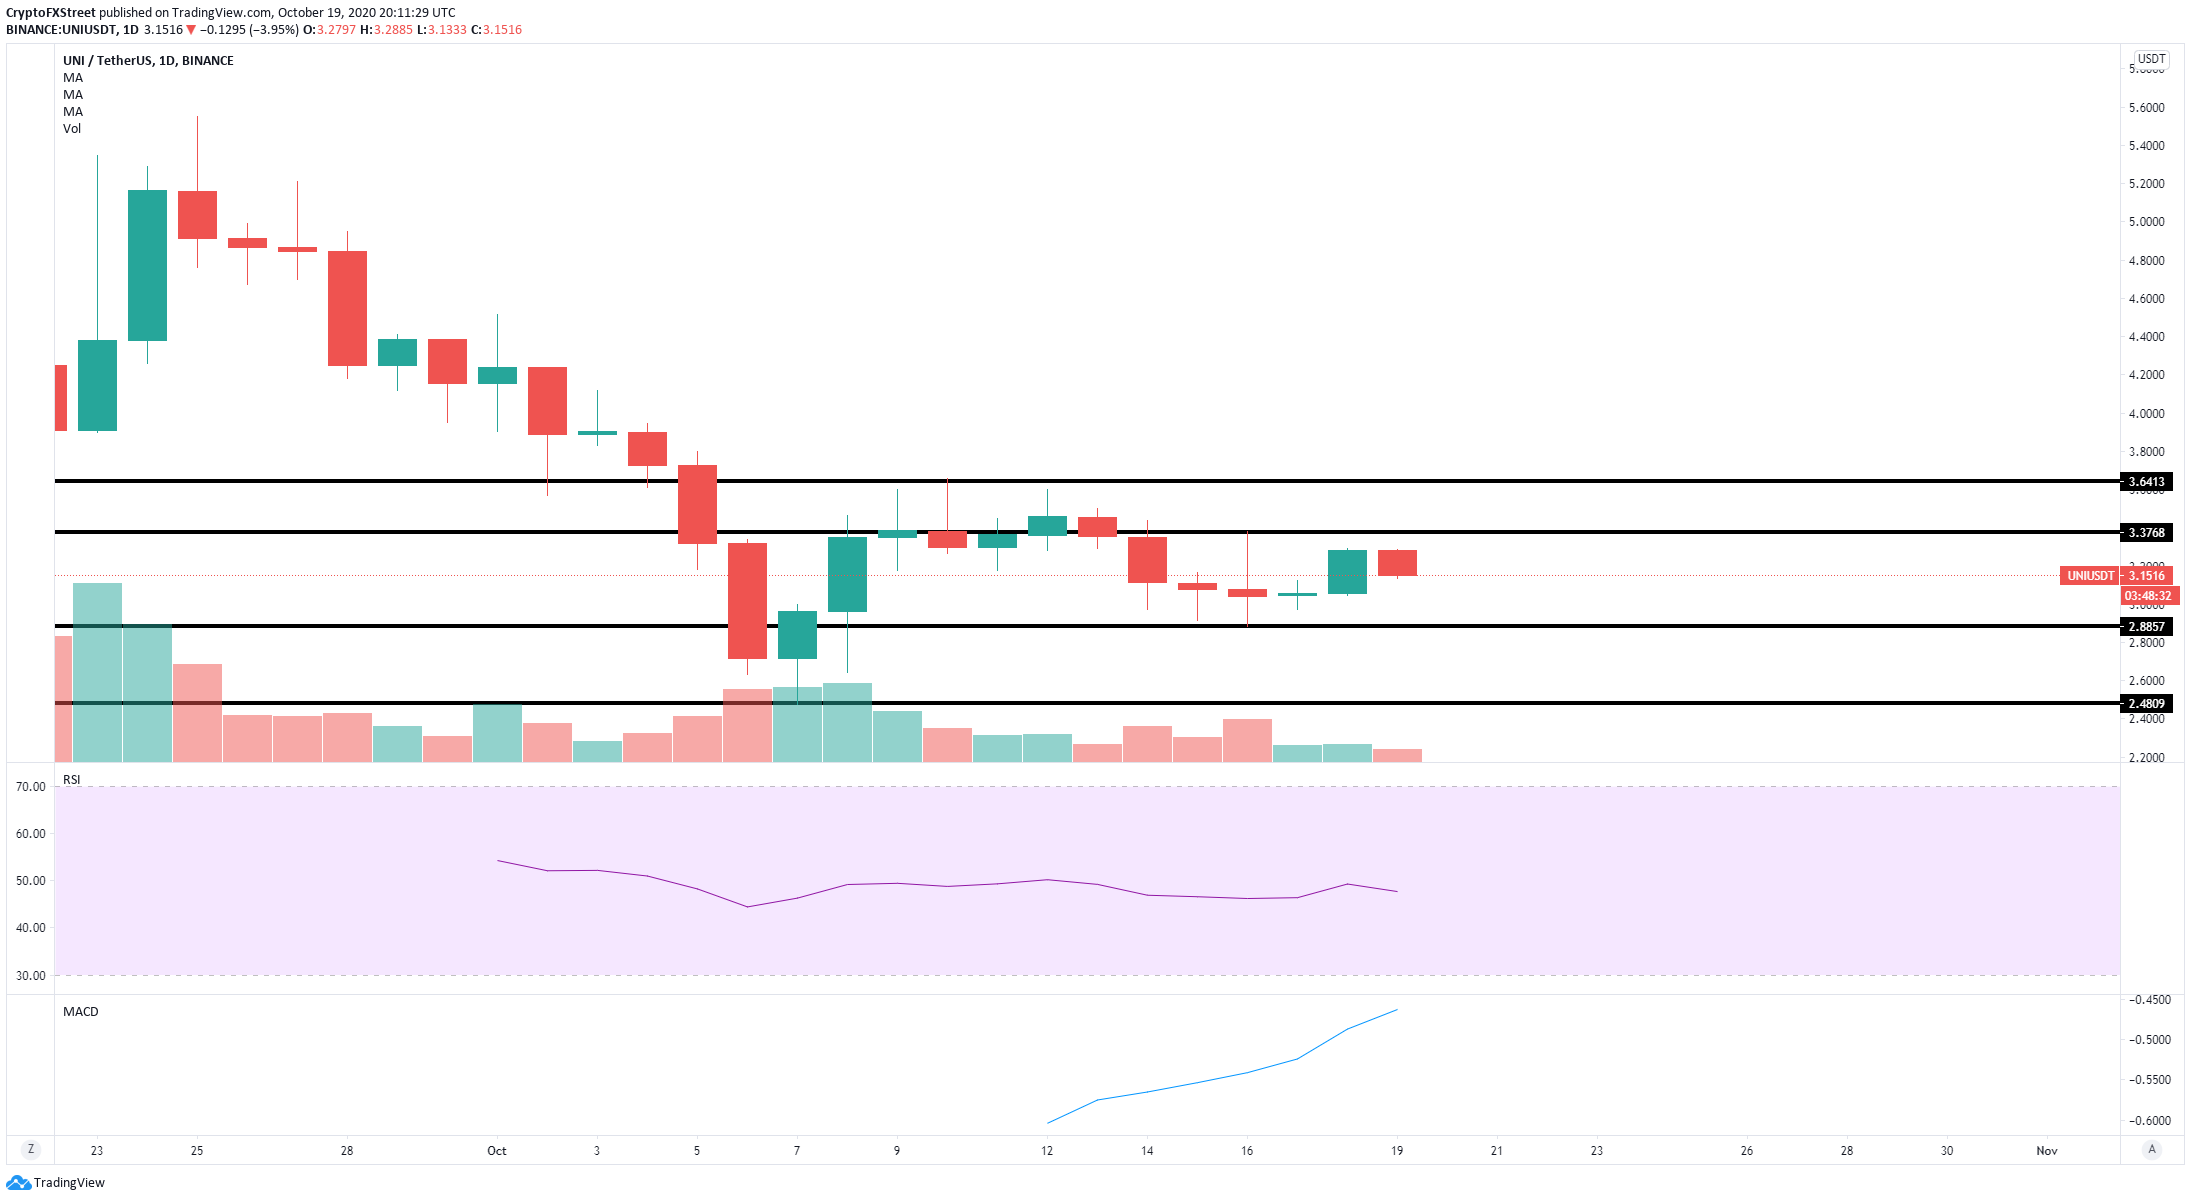
The daily chart seems to be forming an equilibrium pattern with a lower high and a higher low. This also supports the theory that UNI is close to a considerable breakout; however, bears are the favorite here considering the extended downtrend on the daily chart.
UNI New Addresses Chart
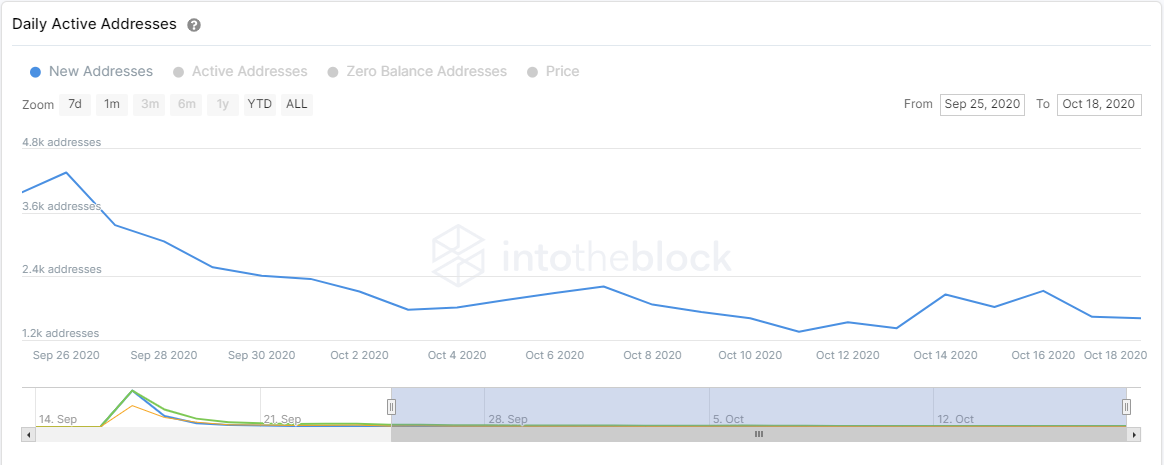
Despite a small increase on October 14, the number of new UNI addresses joining the network has been in a downtrend since September 15. The price of the digital asset is up 3% in the past two days; however, the number of new addresses is down. A bearish breakout below $2.88 can easily send UNI towards $2.48 and then $2.
Key price points for UNI
We know the digital asset is close to a massive breakout. Bulls are eying up at least $3.65 if UNI can climb above $3.3. The digital asset could potentially go as high as $4 in the longer term as there is very little resistance above $3.3, according to the IOMAP chart.
On the bearish side, the daily equilibrium pattern seems to be favoring the sellers after quite a prolonged downtrend. A bearish breakout below the critical support level at $2.88 can drive UNI's price towards $2.48 and the psychological level at $2.
Author

Lorenzo Stroe
Independent Analyst
Lorenzo is an experienced Technical Analyst and Content Writer who has been working in the cryptocurrency industry since 2012. He also has a passion for trading.


