Uniswap Price Forecast: UNI prepares to explode to $10 on breaking this crucial hurdle
- Buying pressure behind UNI is growing, as reflected by the holder distribution metric.
- A daily close above the 50 SMA will help validate the upswing to $10.
- UNI is unlikely to breakdown from the current price levels based on the improving short-term technical picture.

Uniswap was not spared by the bearish wave which swept across the cryptocurrency market on Thursday. Declines extended from the $10 war zone to the confirmed support area at $7. However, the leading decentralized finance token did not stay down for long, as bulls quickly regained control, pushing UNI above $8.
Uniswap eyes liftoff to $10
UNI is doddering at $8 at the time of writing while dealing the resistance at the 50 Simple Moving Average and the descending parallel channel’s upper edge. Trading above these two levels will add credibility to the expected upswing.
The Moving Average Convergence Divergence is currently in negative territory. However, it is likely to add weight to the incoming uptrend if the 12-day moving average crosses above the 26-day moving average. The MACD calculates the strength of an asset’s trend. Thus, a step above the mean line will be a bullish signal for Uniswap.
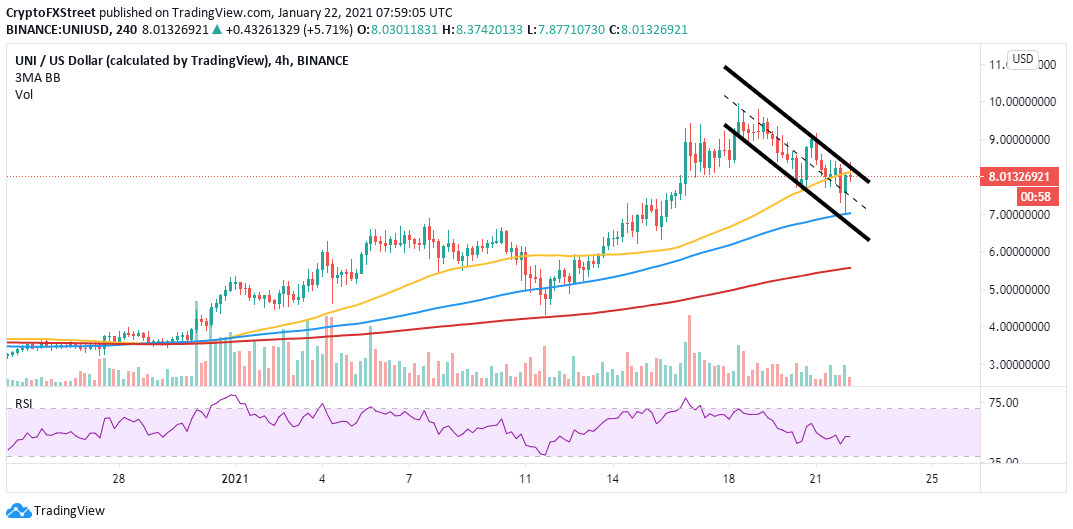
UNI/USD 4-hour chart
Santiment’s holder distribution chart shows that over the past 22 days, buying pressure behind the DeFi token rose dramatically. The behavioural analytics firm recorded a significant spike in the number of addresses with millions of dollars Uniswap, commonly referred to as “whales.”
The number of addresses holding 100,000 to 1 million UNI shot up from 128 to 154 at the time of writing, representing a 16.8% increase in such a short period.
At first glance, the recent increase in the number of large investors behind Uniswap may seem insignificant. However, when considering that these whales move massive volumes of UNI, we begin to understand the sudden spike in buying pressure.
If the buying spree continues, UNI may have the ability to advance further and reach highs beyond $10 in the near term.
%20[11.15.44,%2022%20Jan,%202021]-637469006425838641.png)
Uniswap holder distribution
On the downside, it is worth mentioning that failure to close the day above the 50 SMA would restart the bearish trend. The ascending parallel channel’s middle boundary support will be tested. If it gives in, Uniswap may extend the breakdown to the 100 SMA.
Author

John Isige
FXStreet
John Isige is a seasoned cryptocurrency journalist and markets analyst committed to delivering high-quality, actionable insights tailored to traders, investors, and crypto enthusiasts. He enjoys deep dives into emerging Web3 tren



