Uniswap Price Forecast: UNI finds floor after correcting from 40% rally
- Uniswap price trades in green on Thursday after rallying over 40% on Monday and correcting afterward.
- Rising Open Interest, whale accumulation, and increasing bullish bets among traders support a further rally.
- The ‘UNIfication’ proposal aims to activate protocol fees and better align incentives across the ecosystem, boosting market sentiment.

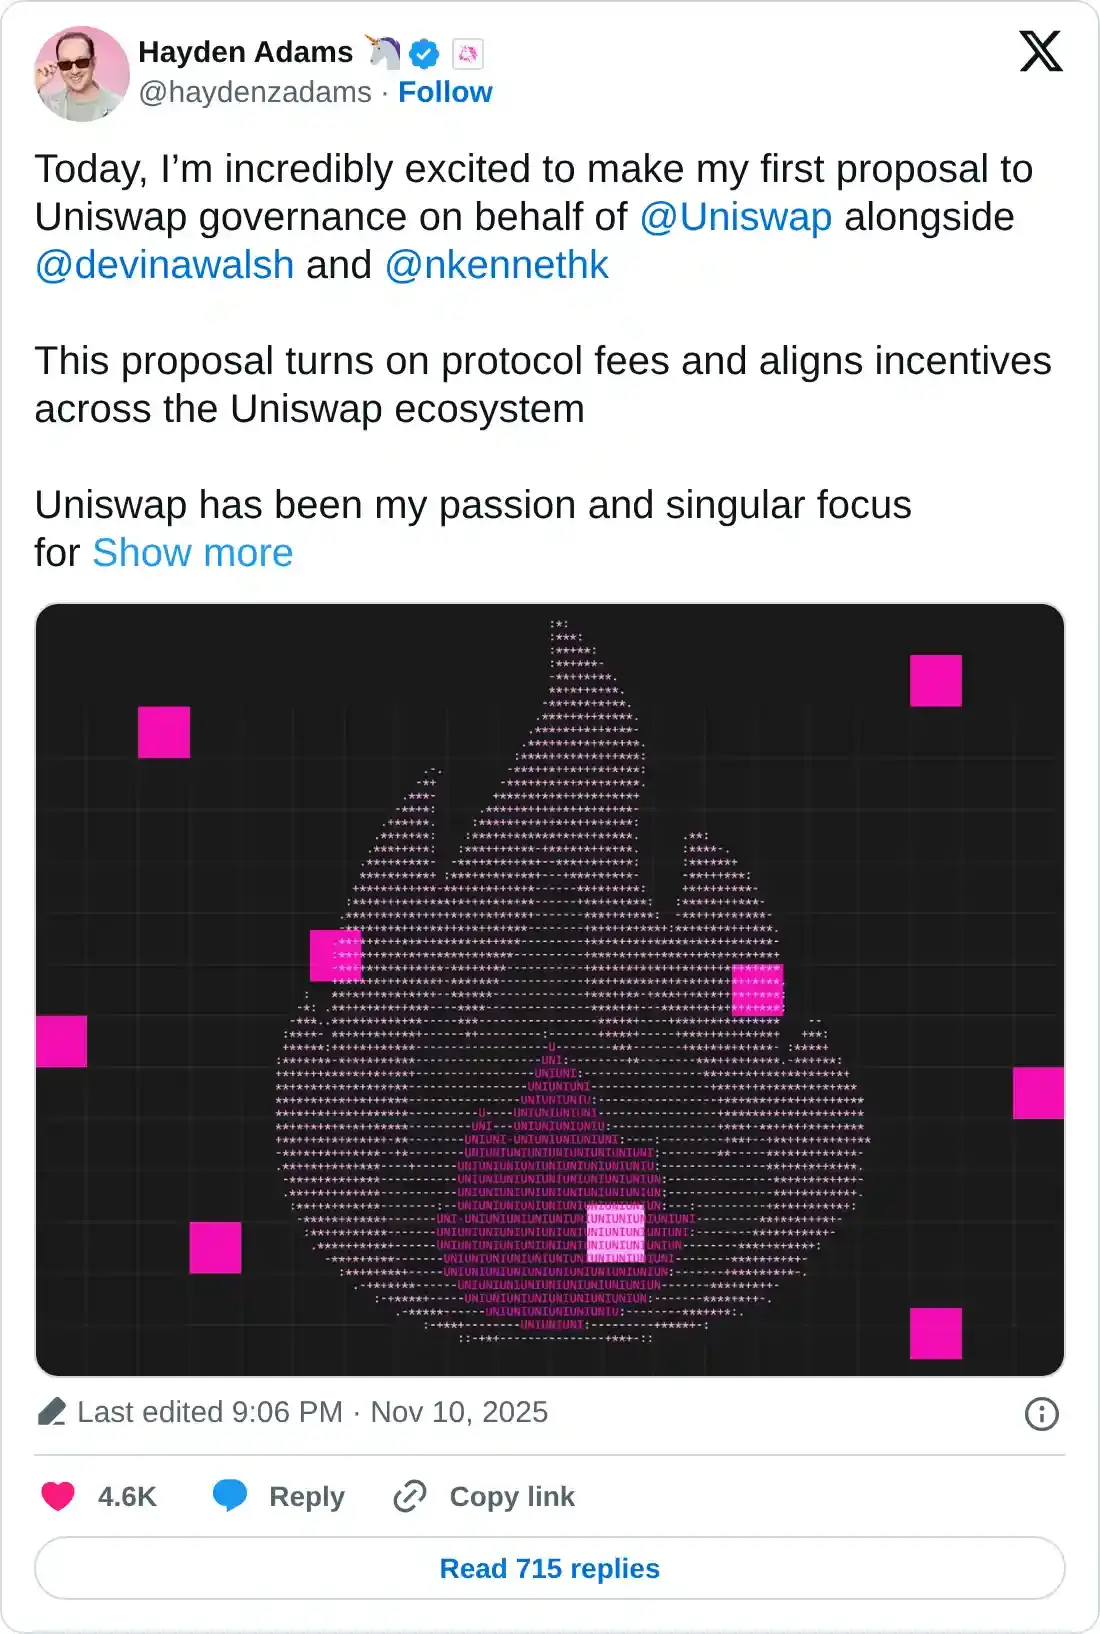
Uniswap (UNI) trades in green above $7.86 at the time of writing on Thursday, and appears to be stabilizing after a sharp 40% surge earlier in the week. The launch of the ‘UNIfication’ governance proposal by Uniswap Labs and the Uniswap Foundation on Monday has sparked optimism across the ecosystem, as traders position for continued upside amid growing whale activity and rising derivatives interest.
Uniswap’s ‘UNIfication’ proposal boosts sentiment
Uniswap's price started the week on a positive note, surging more than 40% on Monday and closing at $9.34.This price rally comes as Uniswap founder Hayden Adams and key leaders of Uniswap Foundation proposed a plan to burn UNI tokens and merge the organizations.
The ‘UNIfication’ proposal seeks to turn on protocol fees and use the revenue to burn UNI tokens, effectively introducing a deflationary mechanism to the token’s supply. These developments mark a shift for the protocol and its token holders, who have long pushed for a so-called "fee switch" that would divert a portion of the trading fees that historically accrued to liquidity providers to the Uniswap protocol's treasury or to UNI token holders.
Additionally, 'UNIfication' also plans to burn 100 million UNI from the treasury and redirect Unichain sequencer fees toward the same purpose. Beyond tokenomics, the plan introduces Protocol Fee Discount Auctions and aggregator hooks to transform Uniswap v4 into an on-chain aggregator capable of collecting fees from external liquidity sources. Adams concluded that “This proposal sets the stage for the next decade of its growth.”
However, UNI price has pulled back by nearly 20% since Monday’s sharp surge, with the token now finding support and stabilizing above the $7.86 level on Thursday, suggesting a potential pause before the next higher leg.
Uniswap’s on-chain and derivatives support a bullish outlook
Santiment’s Supply Distribution data supports a bullish outlook for Uniswap, as certain whales are buying UNI tokens. The metric indicates that whales holding between 100,000 and 1 million LINK tokens (red line) and 10 million and 100 million LINK tokens (blue line) have accumulated a total of 16.03 million LINK tokens from Sunday to Thursday. During the same period, wallets holding between 1 million and 10 million LINK tokens (yellow line) have shed 15.09 million tokens. This shows that the second cohort of whales could have fallen prey to the capitulation event. In contrast, the first set of wallets seized the opportunity and accumulated Uniswap at a discount.
 [11-1763023164889-1763023164891.53.16, 13 Nov, 2025].png)
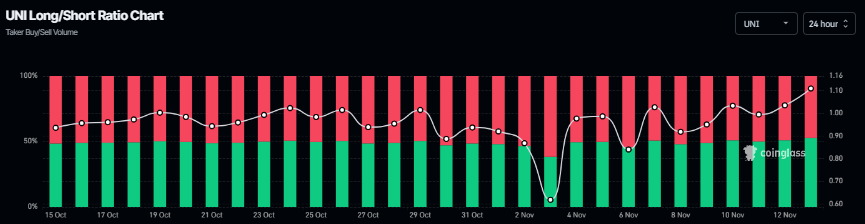
On the derivatives side, Coinglass’s long-to-short ratio for UNI reads 1.10 on Thursday, the highest level over a month. The ratio above one suggests that more traders are betting on the Uniswap price to rally.
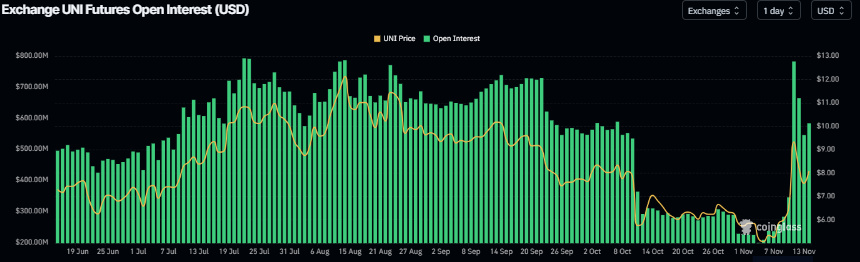
Additionally, Futures Open Interest on Uniswap at exchanges surged to $782.44 million on Monday, the highest level since mid-August, before stabilizing at $583.15 million on Thursday. This rise in OI suggests new capital is flowing into the market, signaling fresh buying activity and growing trader participation. Such an uptick in Open Interest often signals strengthening bullish conviction, suggesting that the current UNI price rally could extend further if momentum persists.
Uniswap Price Forecast: UNI finds support around a key level
Uniswap price surged more than 40% on Monday, closing above the descending trendline (drawn by joining multiple highs since mid-August). However, UNI faced a correction in the next two days after retesting the 78.6% Fibonacci retracement at $10.07 (drawn from the August high around $12.30 to the October low near $2). At the time of writing on Thursday, UNI trades slightly higher, finding support around the 200-day Exponential Moving Average (EMA) at $7.61.
If the 200-day EMA at $7.61 continues to hold, UNI could extend the rally toward the weekly resistance at $12.01.
The Relative Strength Index (RSI) on the daily chart is 58, above the neutral 50 level, indicating bullish momentum gaining traction. The Moving Average Convergence Divergence (MACD) showed a bullish crossover last week, which remains intact, suggesting the continuation of an upward trend.
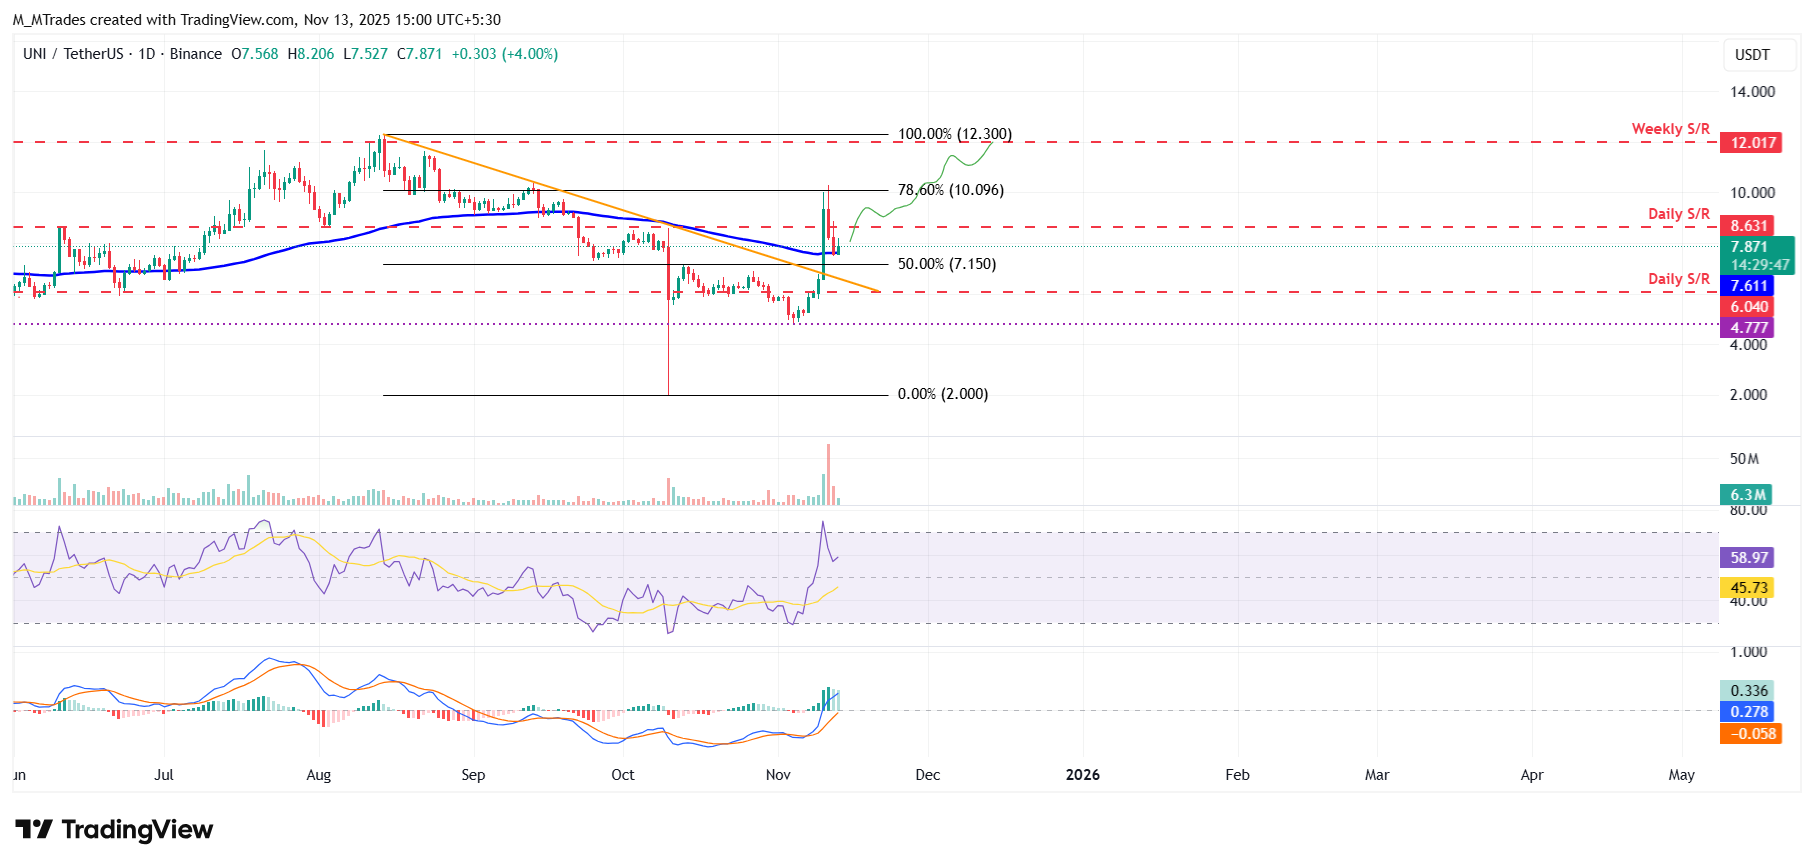
On the other hand, if UNI closes below the 200-day EMA at $7.61, it could extend the decline toward the daily support at $6.04.
Author

Manish Chhetri
FXStreet
Manish Chhetri is a crypto specialist with over four years of experience in the cryptocurrency industry.



