Uniswap Price Forecast: UNI eyes upside as bulls defend key support
- Uniswap price finds support around $7.06, forming a solid base after recent market volatility.
- On-chain and derivatives data support the upside, including whale activity, buy dominance, and rising bullish bets.
- The technical outlook signals more gains ahead, with UNI bulls targeting the $8.63 resistance level as momentum builds.

Uniswap (UNI) is showing early signs of recovery, with price action holding firmly above the $7.06 support level. Strengthening on-chain and derivatives data—including heightened whale activity and a rise in bullish positioning—suggest a favorable environment for upside continuation. On the technical side, it also suggests further upside, with UNI bulls targeting $8.63.
Uniswap’s on-chain and derivatives data show bullish bias
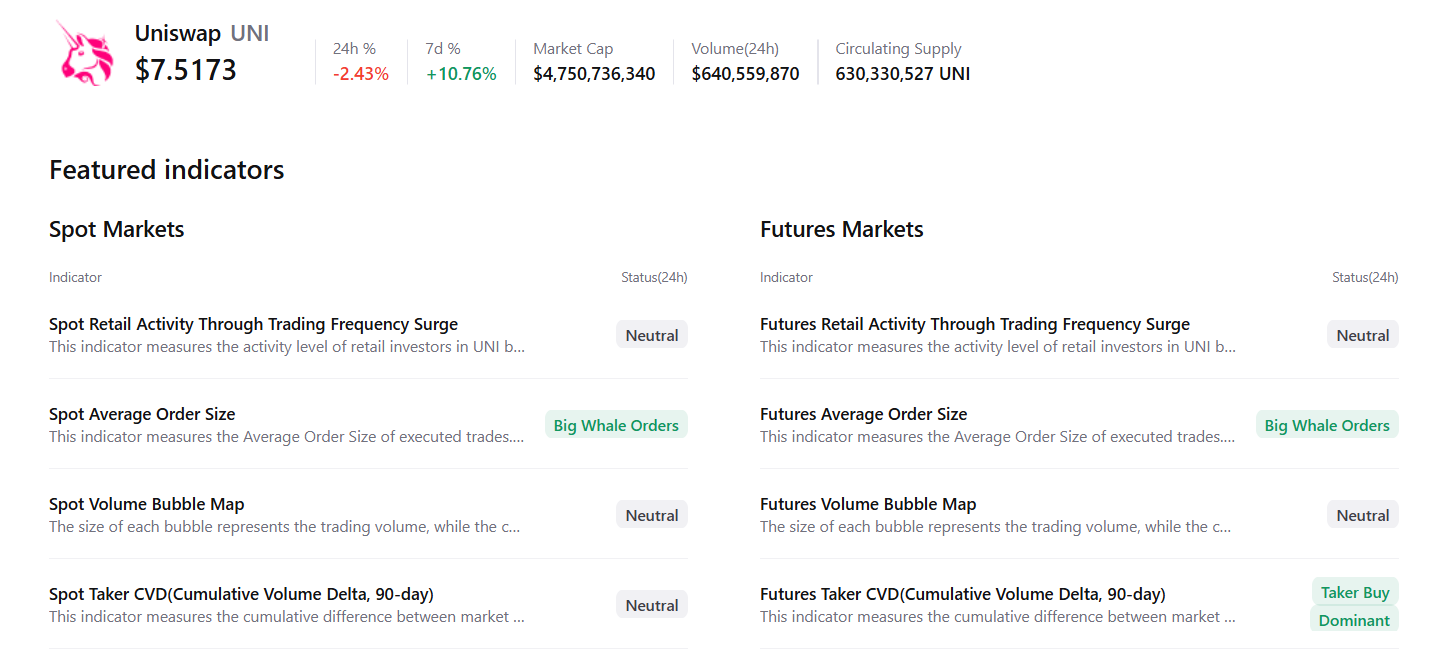
CryptoQuant summary data supports a positive outlook for UNI as both spot and futures markets show large whale orders and buy dominance, signaling a potential rally ahead.
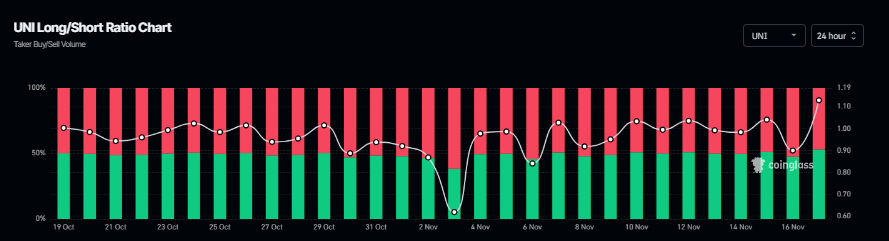
The derivatives data also support a bullish bias. Coinglass’s long-to-short ratio for long-to-short reads is 1.12, the highest level over a month. The ratio above one suggests that more traders are betting on Uniswap’s price to rally.
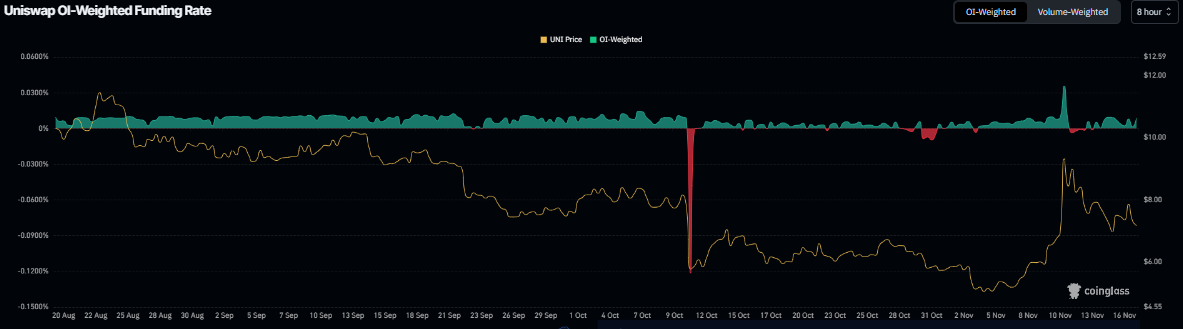
Coinglass’s OI-Weighted Funding Rate data shows that the number of traders betting that the price of UNI will slide further is lower than those anticipating a price increase.
The metric has flipped to a positive rate and stands at 0.0087% on Monday, suggesting that longs are paying shorts, suggesting bullish sentiment toward UNI.
Uniswap Price Forecast: UNI finds support around a key level
Uniswap price corrected after retesting the 78.6% Fibonacci retracement at $10.07 (drawn from the August high around $12.30 to the October low near $2) last week on Tuesday and 25% until Friday. UNI found support after retesting its 50-day EMA at $7.06 and held above it over the weekend. At the time of writing on Monday, UNI trades slightly above $7.52.
If the 50-day EMA at $7.06 holds, it could extend the rally toward the daily resistance at $8.63.
The Relative Strength Index (RSI) on the daily chart reads 55, above its neutral level of 50, indicating bullish momentum gaining traction. The Moving Average Convergence Divergence (MACD) showed a bullish crossover last week, which remains intact, suggesting the continuation of an upward trend.
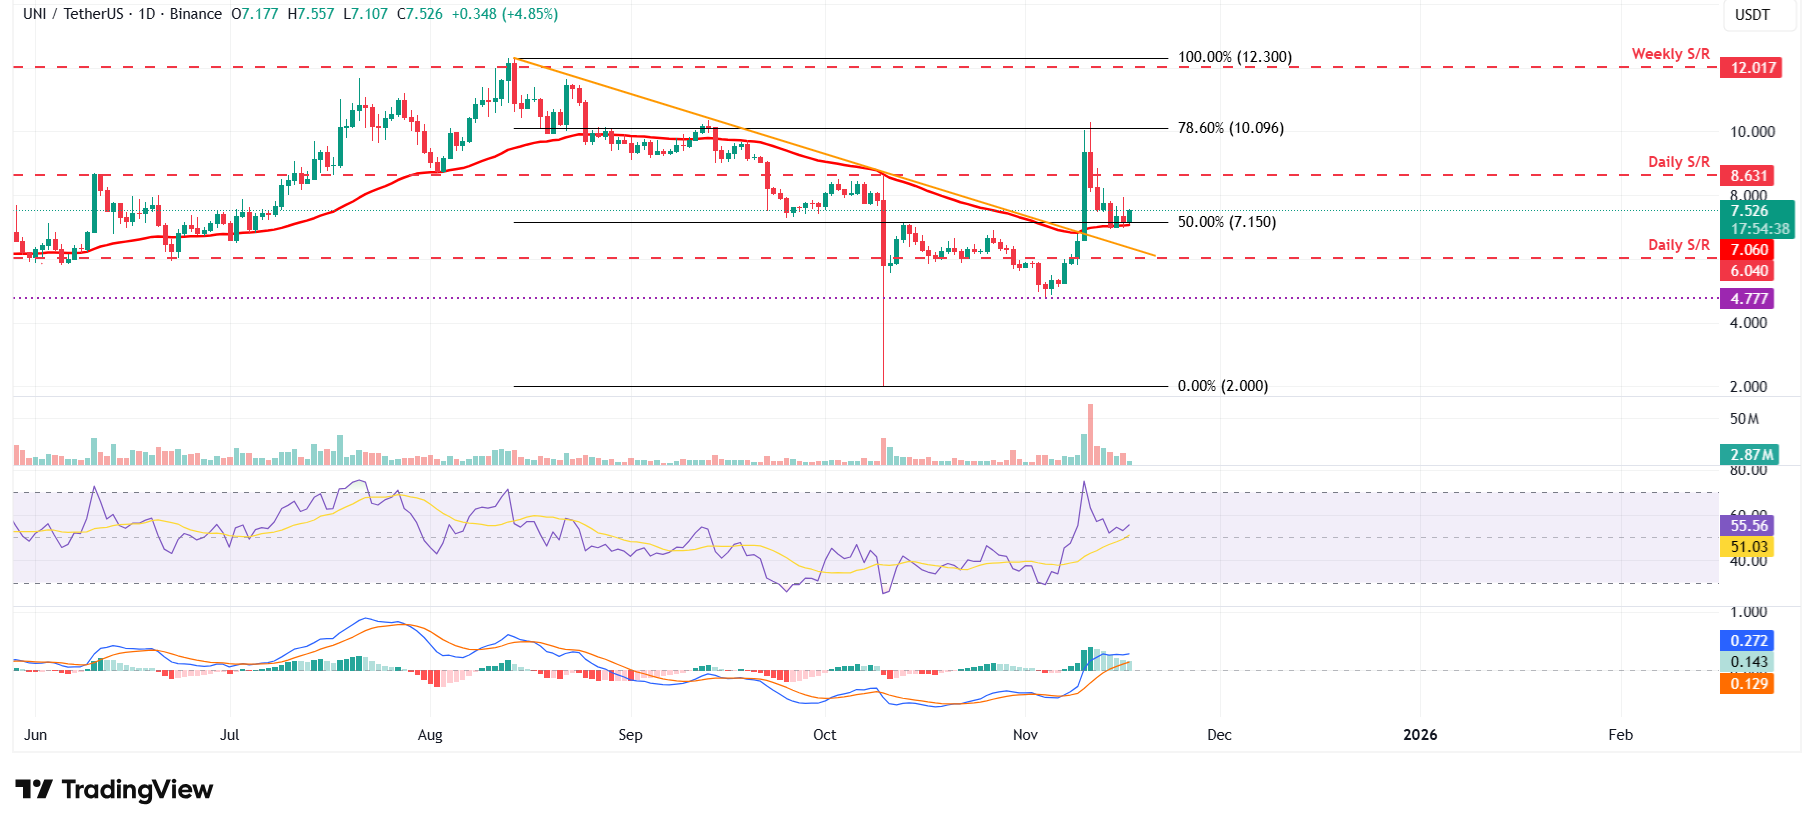
On the other hand, if UNI closes below $7.06, it could extend the decline toward the daily support at $6.04.
Author

Manish Chhetri
FXStreet
Manish Chhetri is a crypto specialist with over four years of experience in the cryptocurrency industry.