Uniswap Price Forecast: UNI eyes massive bullish comeback
- Uniswap holds support at the ascending parallel channel's lower boundary.
- The IOMAP reveals the absence of robust resistance; thus, validating the impending recovery.
- Failing to close the day above the 100 SMA on the 4-hour chart would intensify overhead pressure.

Uniswap bled in tandem with other cryptocurrencies on Monday. Several tentative support areas did little to stop the losses, allowing the bearish leg to extend to $27. At the time of writing, UNI is doddering at $28 while holding above crucial support. A recovery is expected to build from this support and place UNI on the trajectory heading to $30.
Uniswap recovery depends on key buyer congestion zone
Uniswap is trading within the confines of a descending parallel channel. The lower boundary of the channel is the crucial support. Holding firmly onto this support is likely to pave the way for a rebound.
Meanwhile, bulls should focus their assault energy on the seller congestion highlighted by the 100 Simple Moving Average (SMA). Price action above this zone may trigger massive buy orders amid a renewed bullish momentum toward $30.
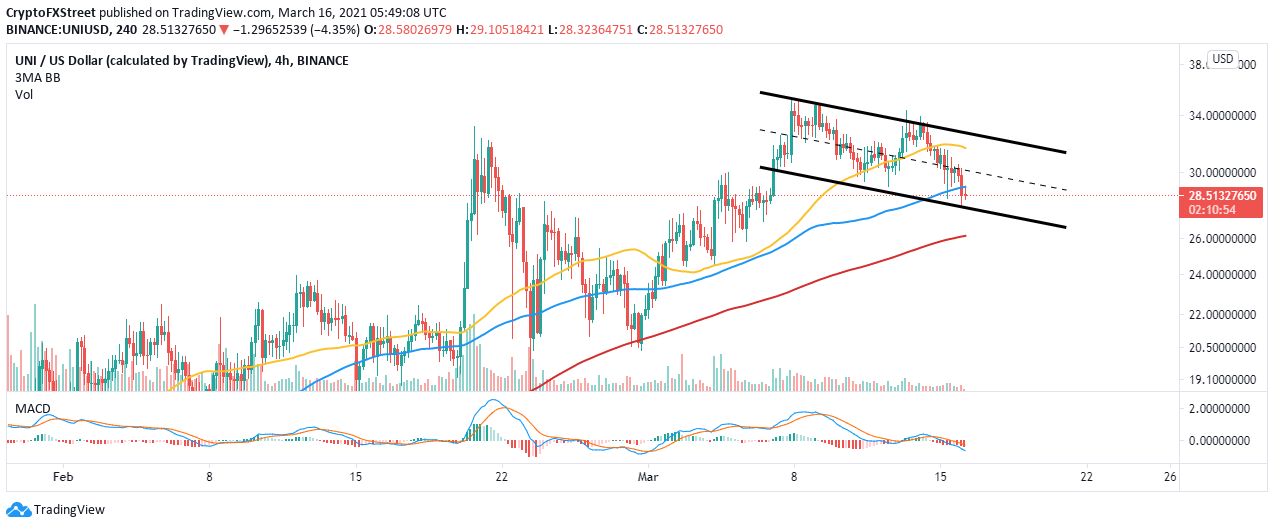
UNI/USD 4-hour chart
The IOMAP model by IntoTheBlock brings to light the absence of strong resistance zones. This could mean that the bulls' significant push is likely to result in a massive upswing in the near-term. However, the model brings our attention to the region running from $31 to $32. Here, roughly 8,400 addresses had previously bought nearly 18.9 million UNI.
On the downside, Uniswap sits on an area with immense support running from $27.8 to $28.65. Here, about 5,700 addresses had previously purchased approximately 285.9 million UNI. If this support remains intact, Uniswap will begin the recovery toward $30.
-637514724480772492.png)
Uniswap IOMAP model
Looking at the other side of the picture
The support at the descending channel lower boundary plays a critical role by ensuring the downside is protected. However, if Uniswap slides under it, selling pressure will begin to increase appreciably. The Moving Average Convergence Divergence (MACD) has a bearish impulse, suggesting that the downtrend may continue in the short-term.
Author

John Isige
FXStreet
John Isige is a seasoned cryptocurrency journalist and markets analyst committed to delivering high-quality, actionable insights tailored to traders, investors, and crypto enthusiasts. He enjoys deep dives into emerging Web3 tren


