Uniswap extends decline even as open interest, volumes remain high
- Uniswap price falls for a third consecutive day after hitting its highest level in over two months.
- Open Interest also retreats but remains close to levels last seen in January.
- Technically, the MACD upholds a buy signal reinforced by bullish divergence between the indicator and price action.

Uniswap (UNI) price hovers at $6.69 at the time of writing on Tuesday after sliding for three consecutive days. The native decentralized exchange (DEX) token encountered heavy resistance clusters around the $7.68 area over the weekend, prompting instability and a drawdown potentially exacerbated by profit-taking.
UNI's over 2% drawdown on the day reflects broader tempered sentiment in the crypto market. The King of the crypto market, Bitcoin (BTC), retraced from its weekly peak of $105,819 to slightly below $102,000 during the early Asian session, highlighting existing short-term risks.
Interest in risk assets like Bitcoin and altcoins has been elevated over the past few weeks, buoyed by easing tariff tensions. The trade truce between the United States (US) and China on Monday and the Federal Reserve's (Fed) dovish stance on the economy's direction boosted sentiment and risk appetite.
"Recent developments such as the Federal Reserveʼs positive comments on the rate trajectory and evolving clarity around the US tariff situation have allowed confidence to return to the markets," the Bitfinex Alpha report states.
Uniwap's uptrend falters despite elevated Open Interest levels
Uniswap's recent price rally stalled after hitting strong resistance near $7.68, a significant supply zone on the daily chart. The rally from the tariff-triggered crash at $4.58 to the weekly peak of $7.68 represents a 67.6% increase and reflects growing trader interest in the token.
CoinGlass derivatives data highlights a substantial turnaround in Uniswap futures Open Interest (OI), which grew by $172.8 million, from $183.7 million to approximately $356.5 million in 30 days.
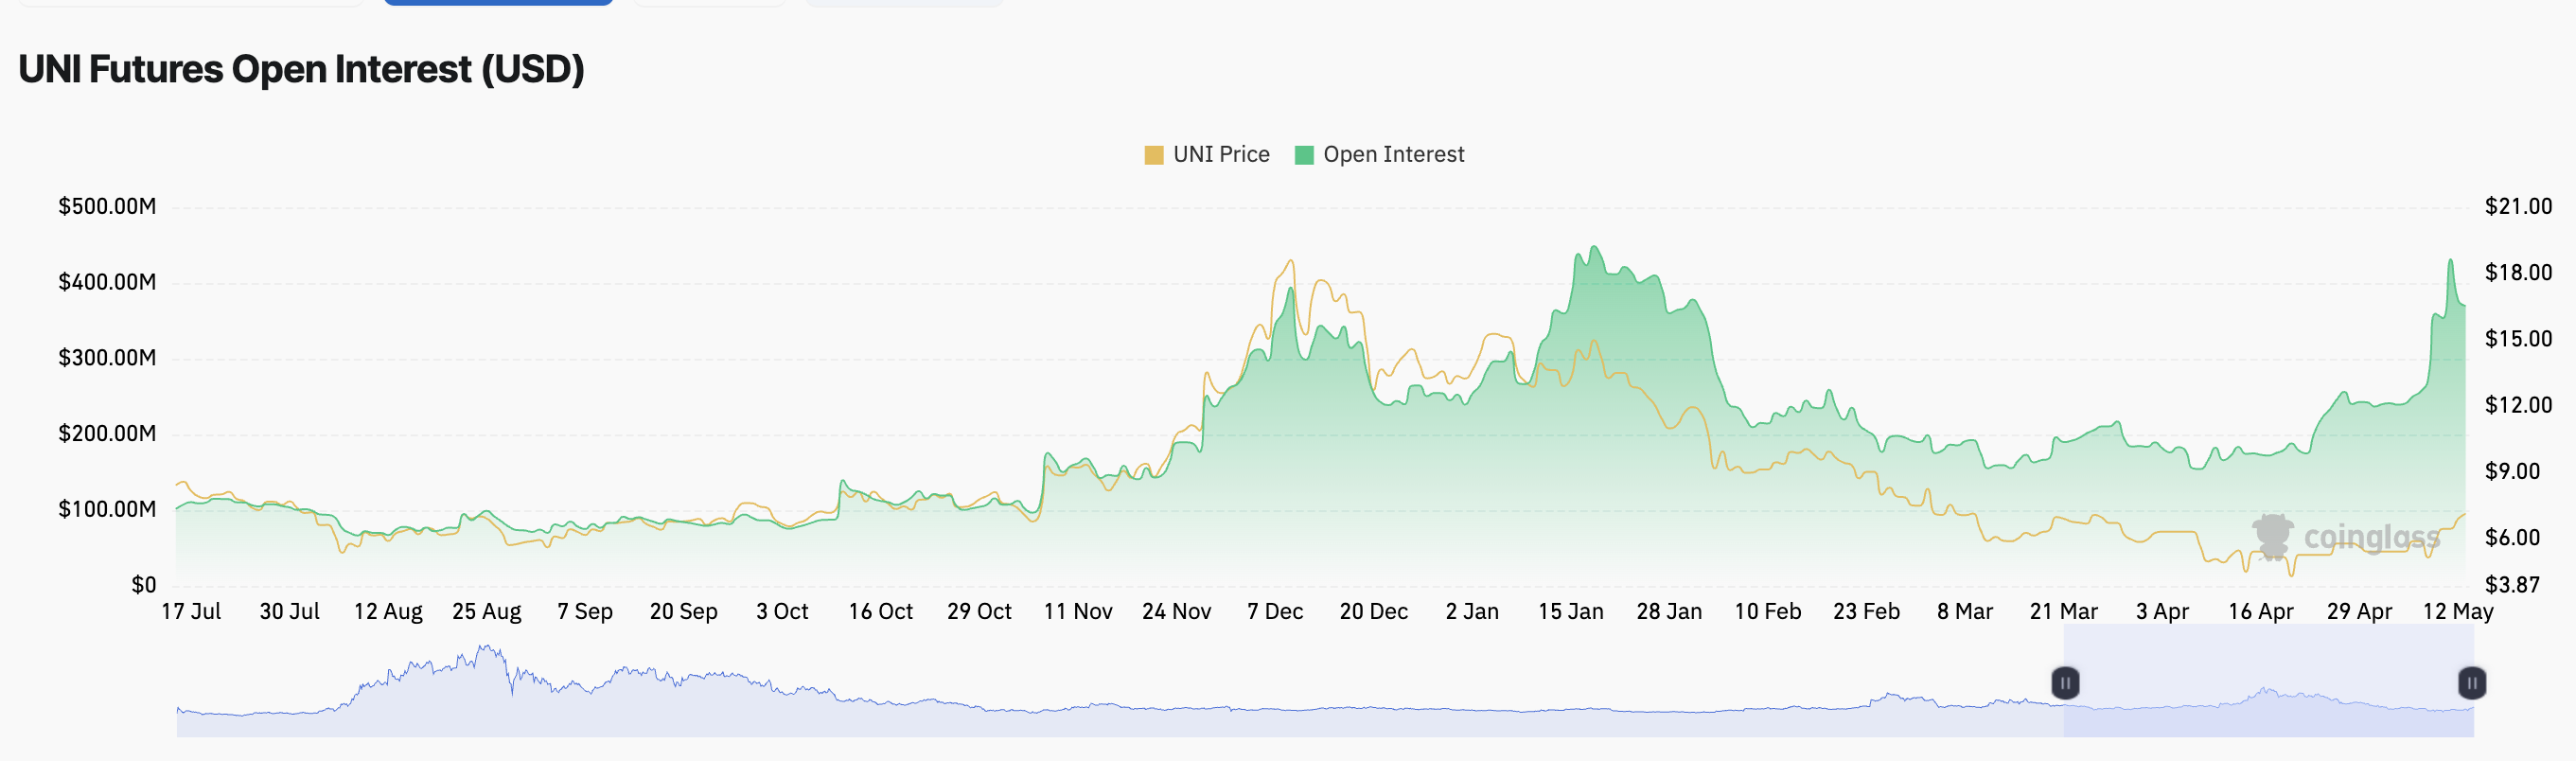
Futures Open Interest | Source: Coinglass
At the same time, Uniswap's DEX volume increased nearly 70% over the last week, reaching $19 million for the first time since February, per IntoTheBlock on-chain data. Uniswap is the largest DEX, boasting almost $3 billion trading volume over the past 24 hours.
Uniswap volume increased by nearly 70% last week, reaching the highest level since February of this year with approximately $19 billion in volume. pic.twitter.com/M0lFUwA2HG
— Sentora (previously IntoTheBlock) (@SentoraHQ) May 13, 2025
Looking ahead: Can UNI reignite its uptrend toward $10?
Uniswap's price trades at $6.69 at the time of writing. Following the rejection from the supply area around $7.68 (highlighted in red on the daily chart below), declines overshadowed support presented at $7.00 by the 100-day Exponential Moving Average (EMA).
Meanwhile, the Relative Strength Index (RSI) indicator's downward trend at 61.12 from an overbought peak of 76.54 signals waning bullish momentum, possibly due to profit-taking and a slump in trader interest in the broader crypto market.
Uniswap could extend the down leg to test the 50-day EMA support at $6.05 if the RSI drops to the midline of 50 and below. Such a move may create instability, increasing the probability of UNI retesting the April low of $4.58 before bulls attempt another recovery.
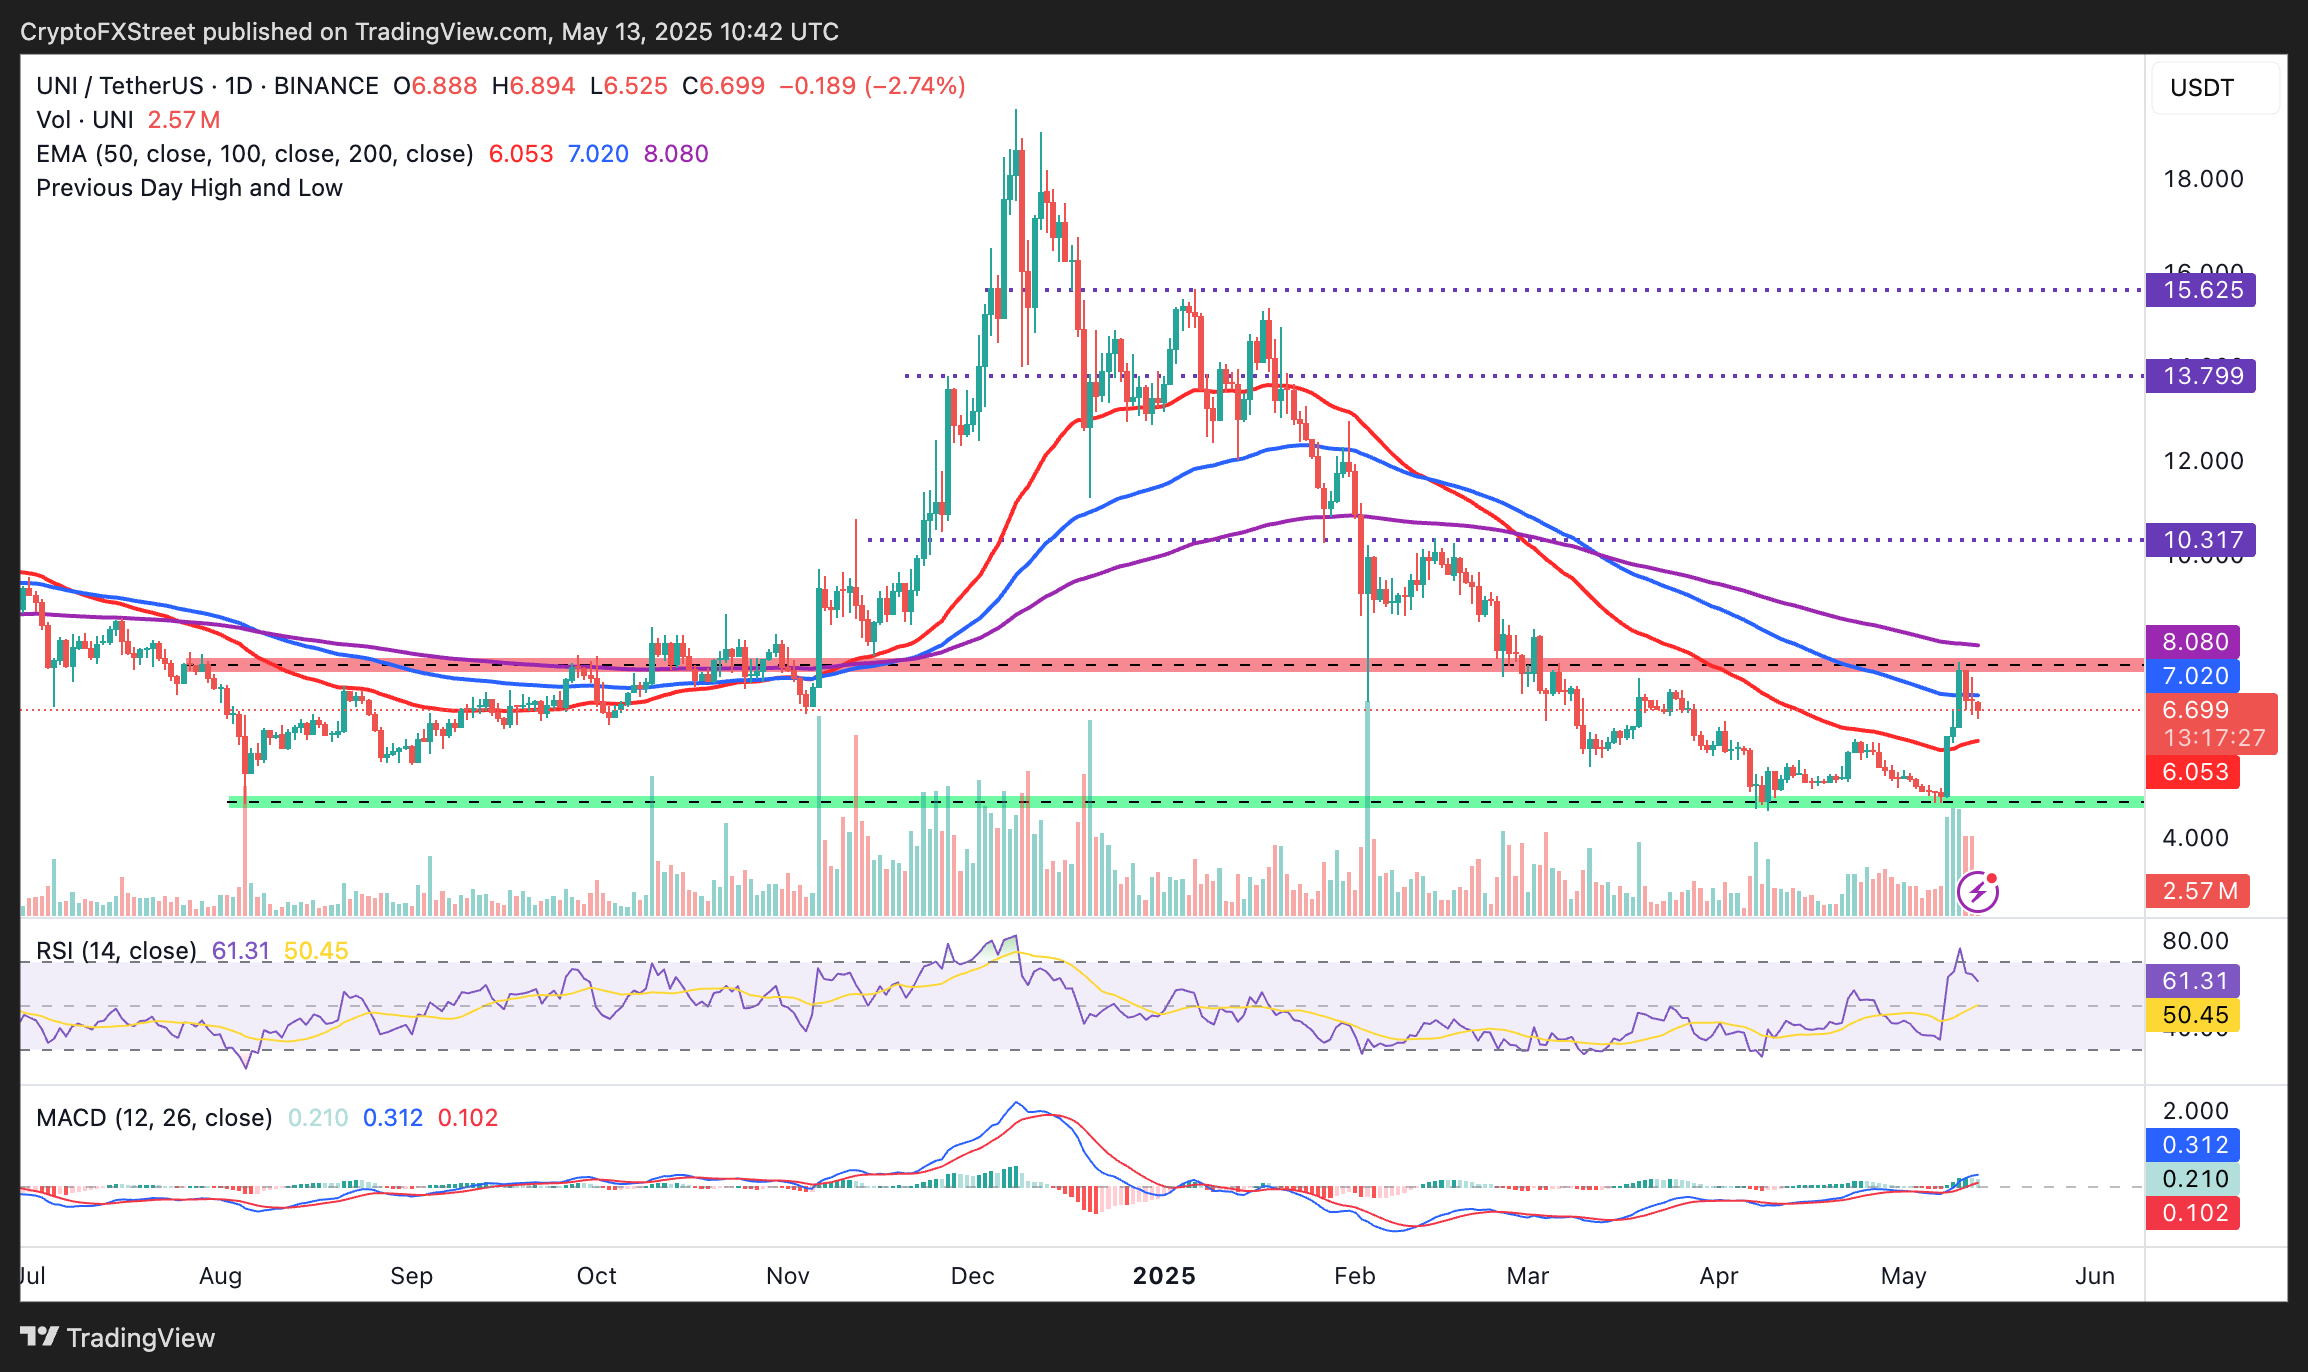
UNI/USDT daily chart
Meanwhile, the Moving Average Convergence Divergence (MACD) indicator remains elevated above the centre line, upholding a buy signal sent on Thursday. The indicator features green histograms, implying that Uniswap still has the potential to resume the uptrend and push towards $10.00.
Cryptocurrency metrics FAQs
The developer or creator of each cryptocurrency decides on the total number of tokens that can be minted or issued. Only a certain number of these assets can be minted by mining, staking or other mechanisms. This is defined by the algorithm of the underlying blockchain technology. On the other hand, circulating supply can also be decreased via actions such as burning tokens, or mistakenly sending assets to addresses of other incompatible blockchains.
Market capitalization is the result of multiplying the circulating supply of a certain asset by the asset’s current market value.
Trading volume refers to the total number of tokens for a specific asset that has been transacted or exchanged between buyers and sellers within set trading hours, for example, 24 hours. It is used to gauge market sentiment, this metric combines all volumes on centralized exchanges and decentralized exchanges. Increasing trading volume often denotes the demand for a certain asset as more people are buying and selling the cryptocurrency.
Funding rates are a concept designed to encourage traders to take positions and ensure perpetual contract prices match spot markets. It defines a mechanism by exchanges to ensure that future prices and index prices periodic payments regularly converge. When the funding rate is positive, the price of the perpetual contract is higher than the mark price. This means traders who are bullish and have opened long positions pay traders who are in short positions. On the other hand, a negative funding rate means perpetual prices are below the mark price, and hence traders with short positions pay traders who have opened long positions.
Author

John Isige
FXStreet
John Isige is a seasoned cryptocurrency journalist and markets analyst committed to delivering high-quality, actionable insights tailored to traders, investors, and crypto enthusiasts. He enjoys deep dives into emerging Web3 tren


