TRON Price Analysis: TRX/USD continues surging, but different technical metrics spell trouble
- TRX/USD is dangerously overbought after rallying 80% in a single week.
- The long-term charts send bearish signals that may send the price to $0.023.

TRON's TRX has been one of the best-performing digital assets out of top-20 recently. The coin has gained over 15% on a day-to-day basis and over 80% on a weekly basis. At the time of writing, TRX is changing hands at $0.0438. The coin has jumped to the ninth position in the global cryptocurrency rating, with the current market capitalization of $3 billion. An average daily trading volume surpassed $7 billion in the recent 24 hours, which is over 700% increase compared to average daily trading volumes registered during the previous week.
As the FXStreet previously reported, a new DeFi-project with a meme - coin SUN launched by Justin Sun may behind the hype around TRX. While TRON's creator has been touting TRX success on Twitter recently, some community members are concerned that the asset's price may collapse once the staked TRX coins are released.
We hope that this price level goes much more up and stays there even when $sun minting will be over and #trx released.
TRX/USD: The technical picture
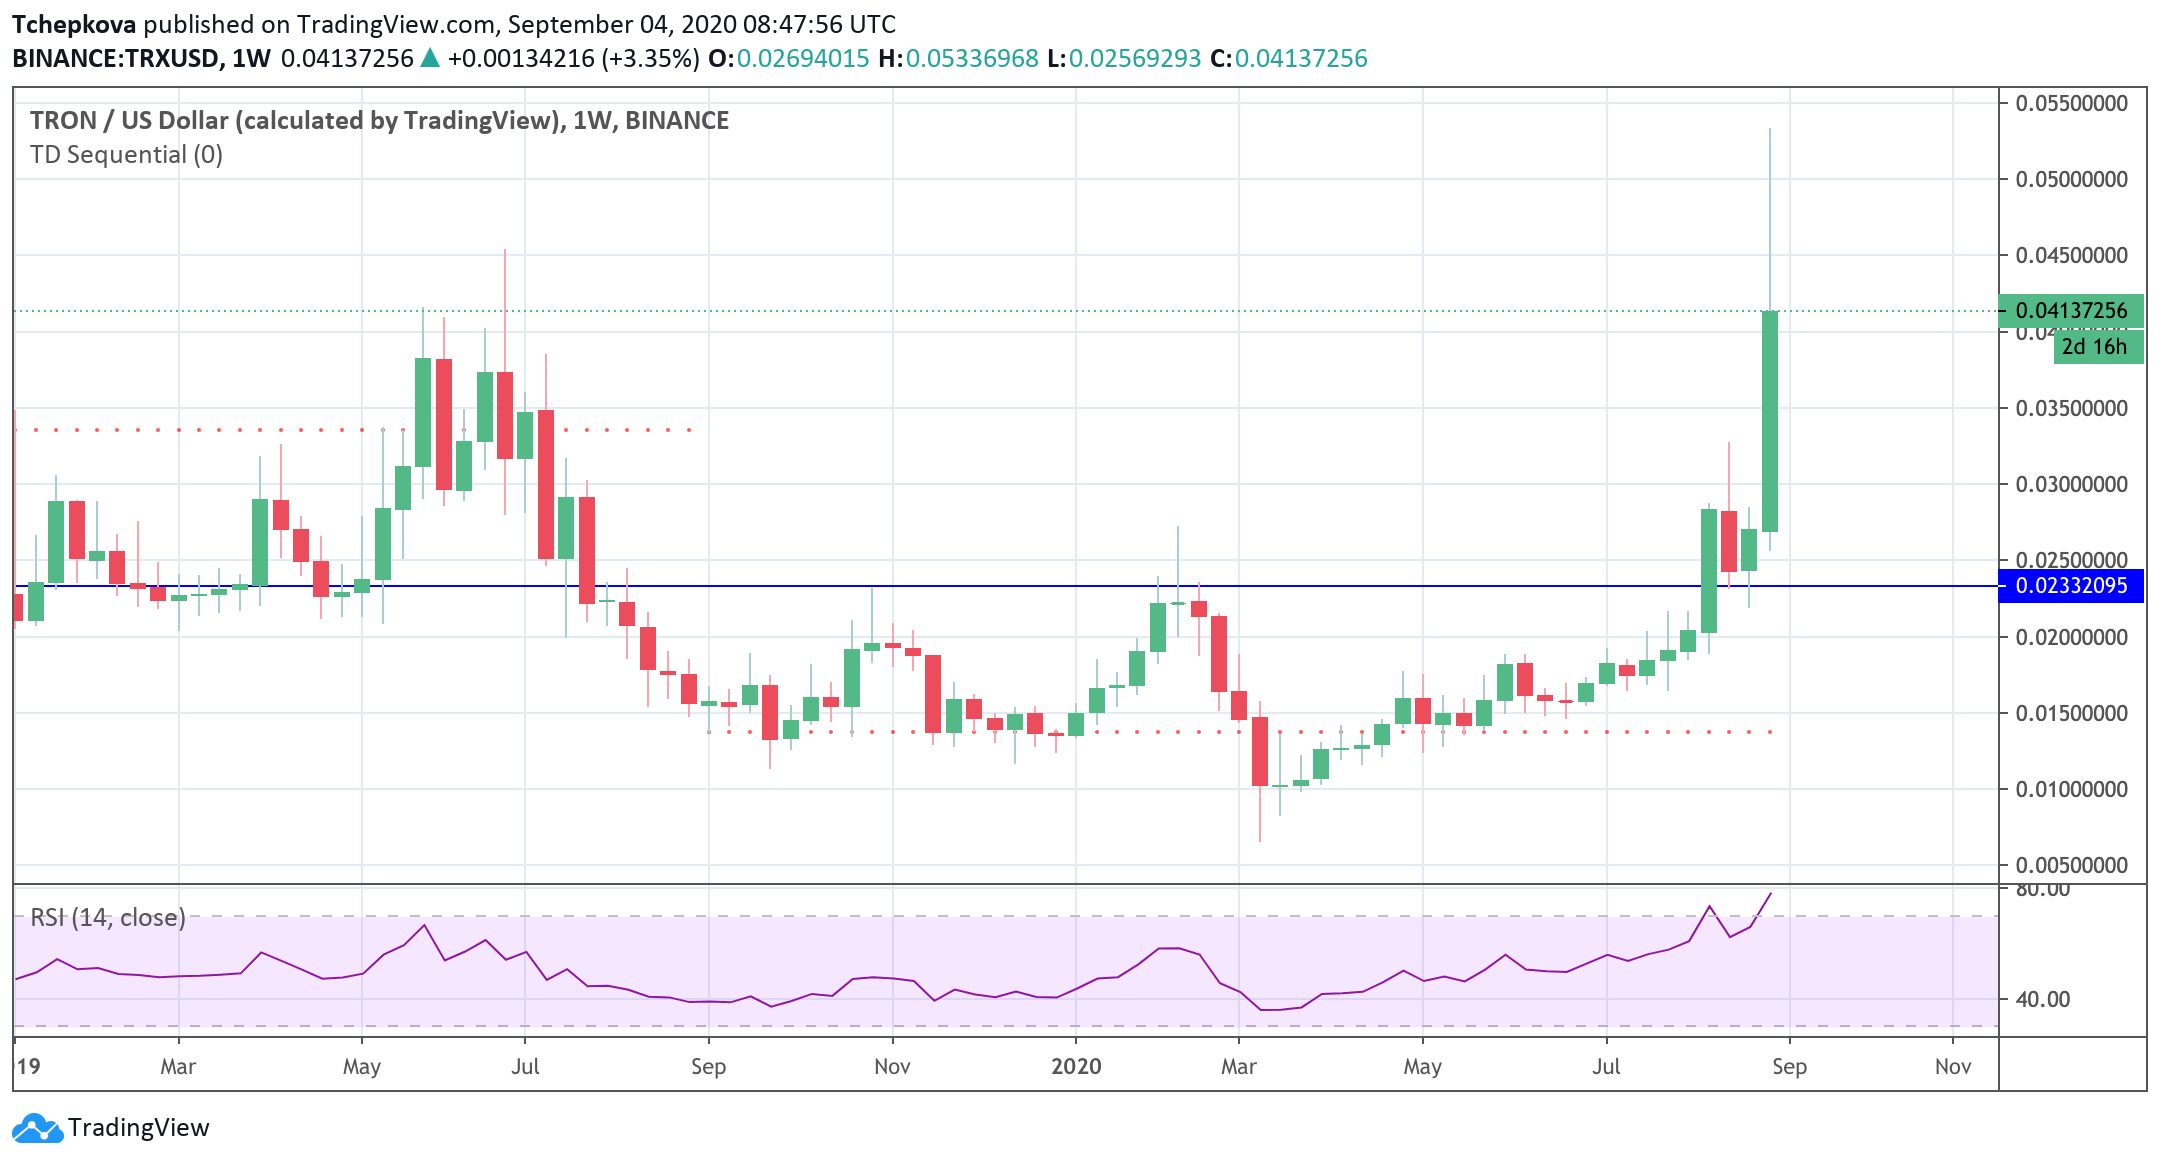
Meanwhile, the technical picture proves that the concerns are not ungrounded. The TD sequential index has generated a sell signal on the weekly chart with nine green candlesticks pointing to an upcoming downside correction that may take the price to at least $0.0233-$0.0230 that served as resistance in February and was tested as a support in the middle of August. Meanwhile, the RSI on the weekly chart is deep on the overbought territory with no signs of reversal.
TRX/USD weekly chart
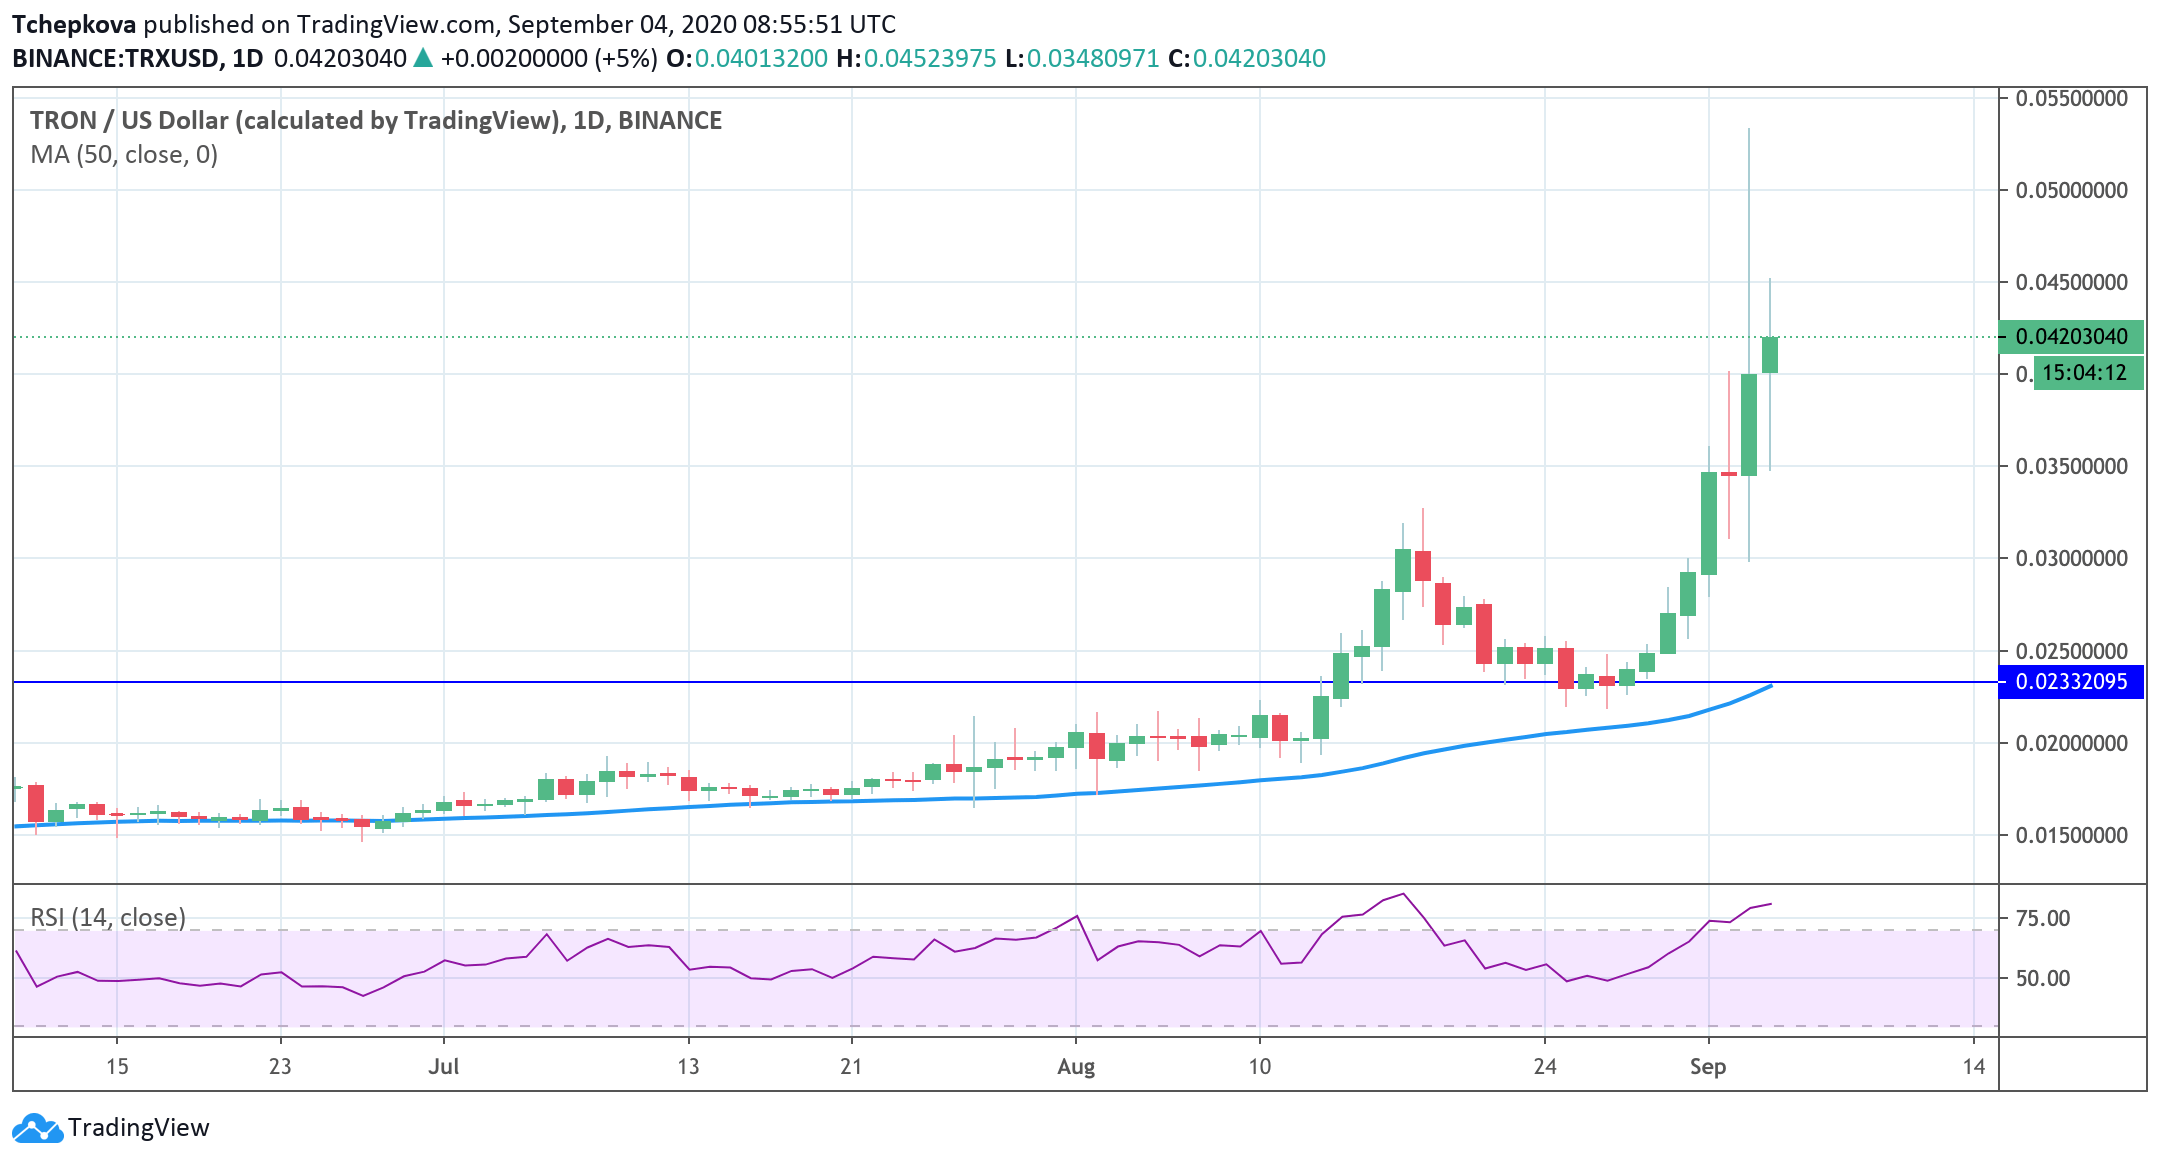
On a daily chart, the coin is also grossly overbought. The RSI has flattened out, which confirms that exhaustion of the bull's trend. Long shadows of the last three candles support this idea and imply the high level of uncertainty among the traders. The sell-off may slow down on approach to the intraday low of $0.034. Once it is cleared, $0.03 will come into focus followed by the above-mentioned long-term barrier of $0.0233, reinforced by the SMA50 on the daily chart
TRX/USD daily chart
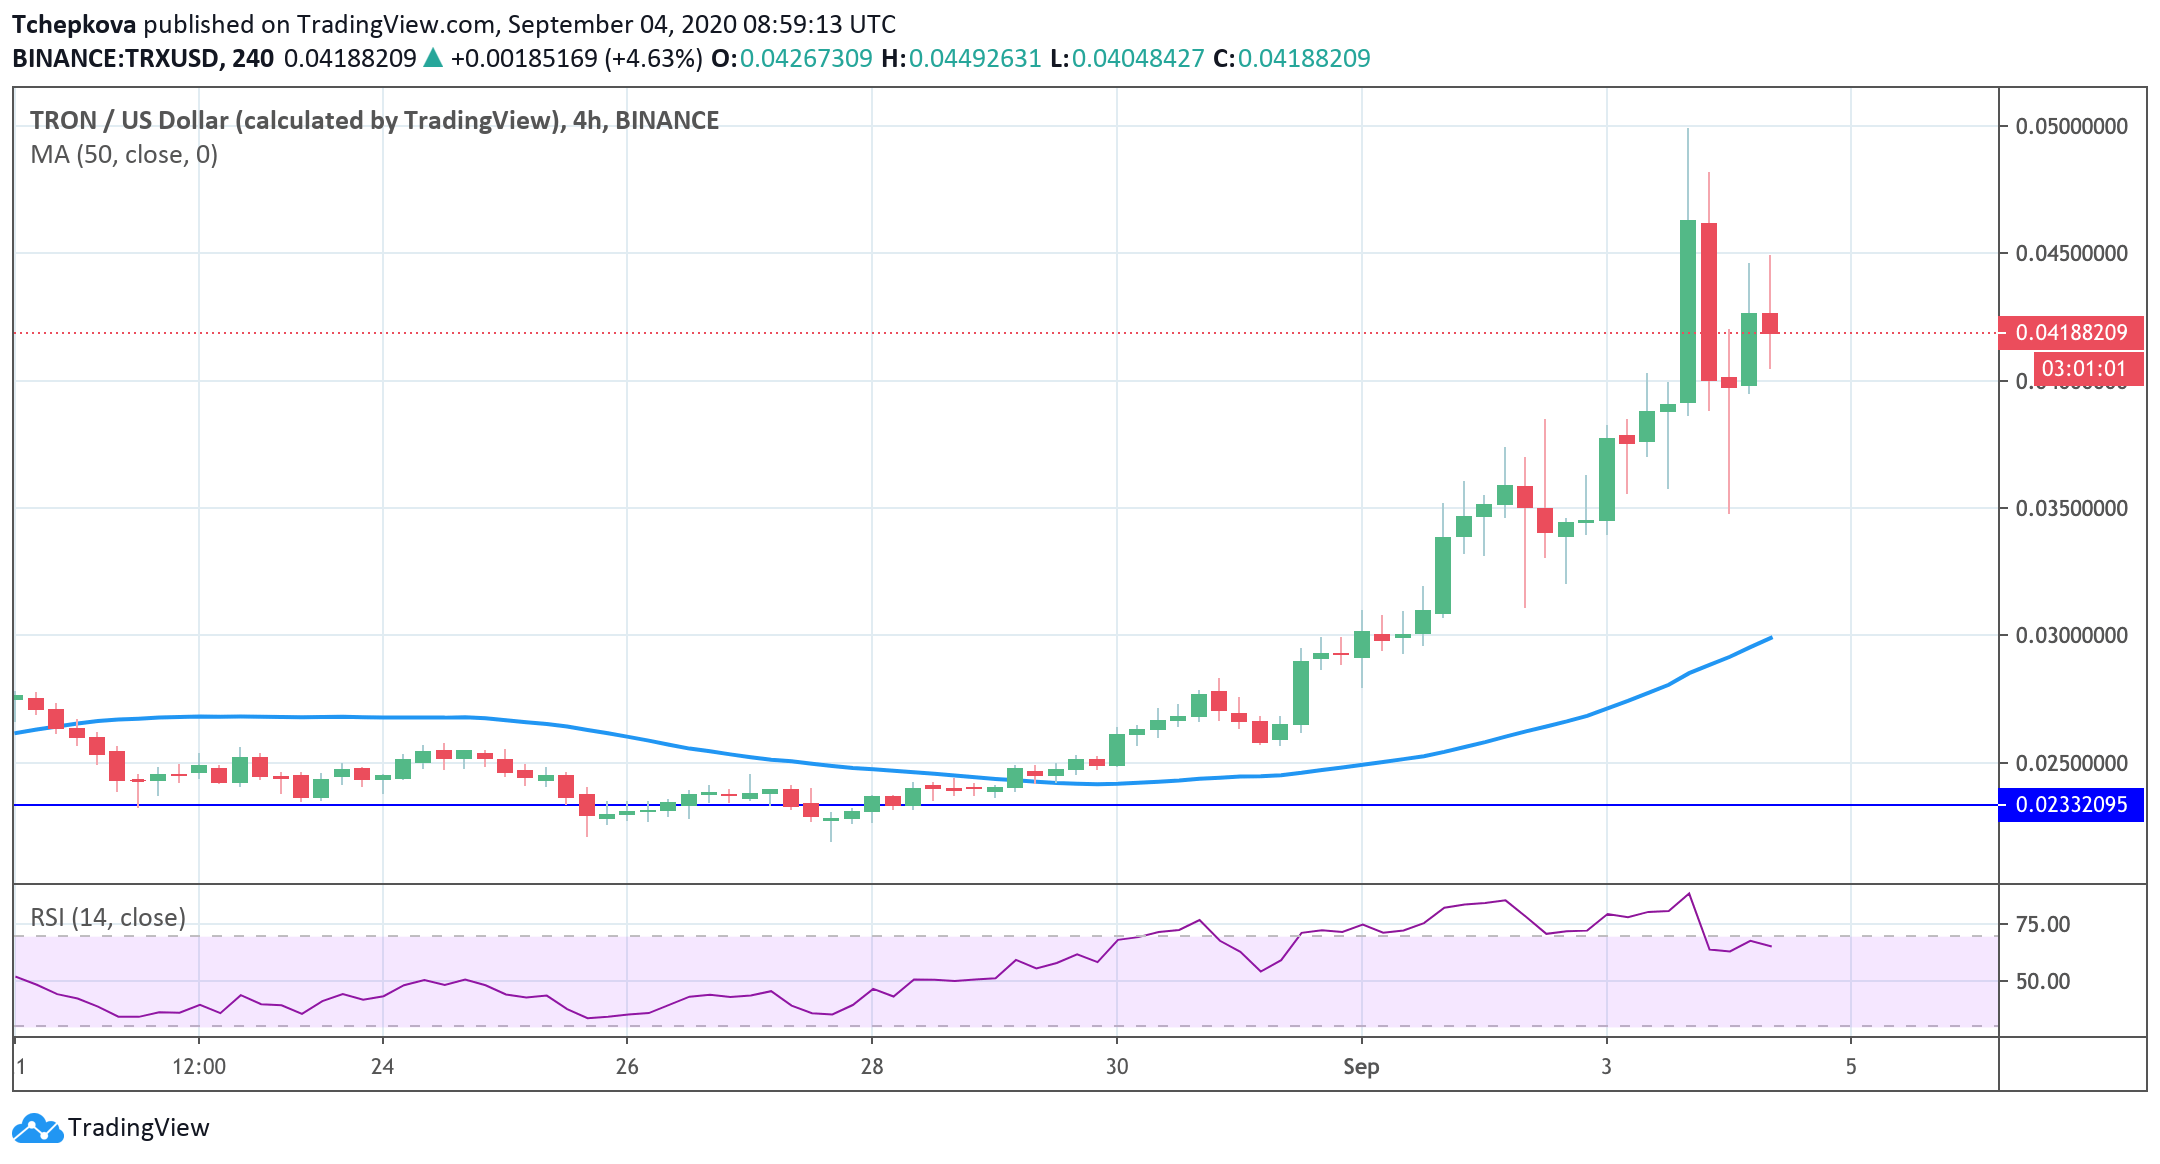
Let's zoom in to the four-hour timeframe. The RSI sends a clear sell signal. The indicator returned to the neutral area and reversed to the downside. The price returned inside the Bollinger Band withe middle lie at $0.036 as local short-term support. If the price stays within the BB's upper part, the upside impulse may be resumed with the initial target at $0.045 (the upper line of the above-said BB and the intraday high). However, a sustainable move below $0.036 will confirm the longer-term bearish scenario described above.
TRX/USD 4-hour chart
Author

Tanya Abrosimova
Independent Analyst


