|

Top three coins price prediction: Bitcoin, Ethereum and Ripple go through bearish correction – Confluence Detector

Top three coins confluence detector
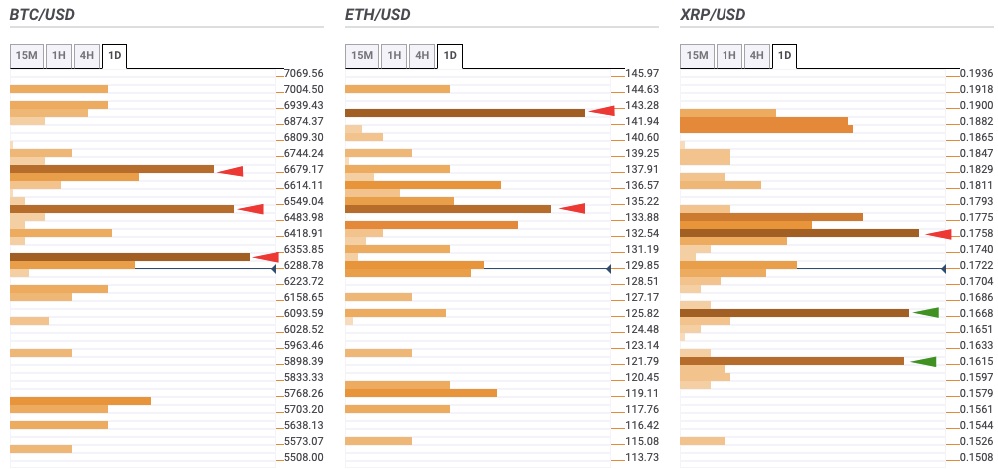
fxsoriginal

Bitcoin 

Current Price: $6,160 

BTC/USD daily confluence detector shows a lack of healthy support levels on the downside, so further price drop is expected. On the upside, there are three strong resistance levels at $6,215, $6,500 and $6,715. $6,215 has the one-hour and one-day Bollinger Bands and SMA 10. $6,500 has the one-day and one-week Fibonacci 38.2% retracement levels, while $6,715 has the SMA 10, SMA 50, SMA 100, SMA 200 and one-week Fibonacci 23.6% retracement level.

Key Levels

BTC/USD

Overview
Today last price6182.68
Today Daily Change-191.69
Today Daily Change %-3.01
Today daily open6374.37
 
Trends
Daily SMA206302.13
Daily SMA508222.51
Daily SMA1008213.42
Daily SMA2008330.05
 
Levels
Previous Daily High6874.75
Previous Daily Low6272.67
Previous Weekly High6983.8
Previous Weekly Low5683.95
Previous Monthly High10511.86
Previous Monthly Low8431.17
Daily Fibonacci 38.2%6502.67
Daily Fibonacci 61.8%6644.76
Daily Pivot Point S16139.78
Daily Pivot Point S25905.19
Daily Pivot Point S35537.71
Daily Pivot Point R16741.86
Daily Pivot Point R27109.34
Daily Pivot Point R37343.93

Ethereum

Current Price: $127.70 

Quite like BTC/USD, ETH/USD also has a lack of support levels on the downside, holding the price up.  On the upside, there are two strong resistance levels at $134.50 and $143. The former has the SMA 10, SMA 50, SMA 200 and one-day Fibonacci 38.2% retracement level, while the latter has the one-day Previous High, one-day Bollinger Band and one-week Pivot Point resistance-one.

Key Levels

ETH/USD

Overview
Today last price127.81
Today Daily Change-3.71
Today Daily Change %-2.82
Today daily open131.52
 
Trends
Daily SMA20142.15
Daily SMA50204.27
Daily SMA100179.03
Daily SMA200176.21
 
Levels
Previous Daily High142.03
Previous Daily Low129.7
Previous Weekly High144.05
Previous Weekly Low119.36
Previous Monthly High288.7
Previous Monthly Low179.06
Daily Fibonacci 38.2%134.41
Daily Fibonacci 61.8%137.32
Daily Pivot Point S1126.81
Daily Pivot Point S2122.1
Daily Pivot Point S3114.49
Daily Pivot Point R1139.13
Daily Pivot Point R2146.74
Daily Pivot Point R3151.45

Ripple

Current Price: $0.168

Unlike Bitcoin and Ethereum, Ripple actually has healthy support levels on the downside at $0.1675 and $0.162. $0.1675 has the SMA 5, 4-hour and one-day Bollinger Bands, while $0.162 has the one-week Fibonacci 61.8% retracement levels, SMA 10 and SMA 50. On the upside, XRP/USD has strong resistance at $0.1765, which has the one-hour Bollinger Band, Previous Year low and SMA 100.

Key Levels


Author

Rajarshi Mitra

Rajarshi Mitra

Independent Analyst

Rajarshi entered the blockchain space in 2016. He is a blockchain researcher who has worked for Blockgeeks and has done research work for several ICOs. He gets regularly invited to give talks on the blockchain technology and cryptocurrencies.

More from Rajarshi Mitra
Share:

Editor's Picks

Crypto Today: Bitcoin at $60,000, Ethereum at $1,500, and XRP at $1 face a make-or-break test

Bitcoin (BTC), Ethereum (ETH), and Ripple (XRP) are trading in the red on Friday after three consecutive days of losses, testing their respective make-or-break support levels.

Bitcoin Weekly Forecast: BTC hits 20-month low, will the pain continue?

Bitcoin recovers slightly, trading at $66,000 on Friday after reaching a new yearly low of $58,115 earlier this week, its lowest level since October 2024. Institutional selling intensified as spot ETFs recorded $1.35 billion in net outflows through Thursday.

XRP clings to $1 as long liquidations deepen bearish trend

Ripple trades near the key psychological support level of $1 at the time of writing on Friday after losing more than 8% so far this week. CoinGlass liquidation data shows that over 97% XRP long positions were wiped out over the past 24 hours.

Pi Network Price Forecast: Minor recovery amid market crash fuels short-term hope

Pi Network price records a mild 3% recovery at press time on Friday, shaping a rebound from a broken descending trendline. The declining trend in trading volume has stabilized around $10 million this week, supporting the possibility of an extended recovery as selling pressure wanes.

Bitcoin: BTC hits 20-month low, will the pain continue?
Bitcoin (BTC) recovers slightly, trading at $66,000 on Friday after reaching a new yearly low of $58,115 earlier this week, its lowest level since October 2024. Institutional selling intensified as spot Exchange Traded Funds (ETFs) recorded $1.35 billion in net outflows through Thursday.