Top Crypto Losers: Monero, Ethereum, and Kaspa face intense sell-off
- Monero hovers above the 200-day EMA on Monday, after Sunday’s 13% decline.
- Ethereum falls below $2,300 toward a critical support zone after five consecutive days of decline, representing a 25% decline.
- Kaspa extends a pullback in a descending wedge pattern, recording 22% loss last week.

Altcoins, including Monero (XMR), Ethereum (ETH), and Kaspa (KAS), are leading the broader cryptocurrency market decline with a steep correction on Sunday. Monero and Ethereum are close to critical support levels near $400 and $2,300, respectively, while Kaspa flashes further downside risk within a descending wedge pattern.
Monero loses strength near $400
Monero recovers over 2% at press time on Monday, holding above the $400 mark after Sunday’s 13% drop. The privacy coin remains at risk of testing the 200-day Exponential Moving Average (EMA) at $388, a level last seen in early December.
If XMR clears below the $388 mark, it could threaten the rising trendline connecting the August 15 and October 10 lows near $339 and erase the December gains.
The momentum indicators on the daily chart reflect intense selling pressure gaining without reaching oversold conditions. The Relative Strength Index (RSI) declines to 38, with further downside room before reaching the oversold zone boundary at 30. At the same time, the Moving Average Convergence Divergence (MACD) crosses below zero with renewed negative histograms, suggesting a rise in bearish momentum.
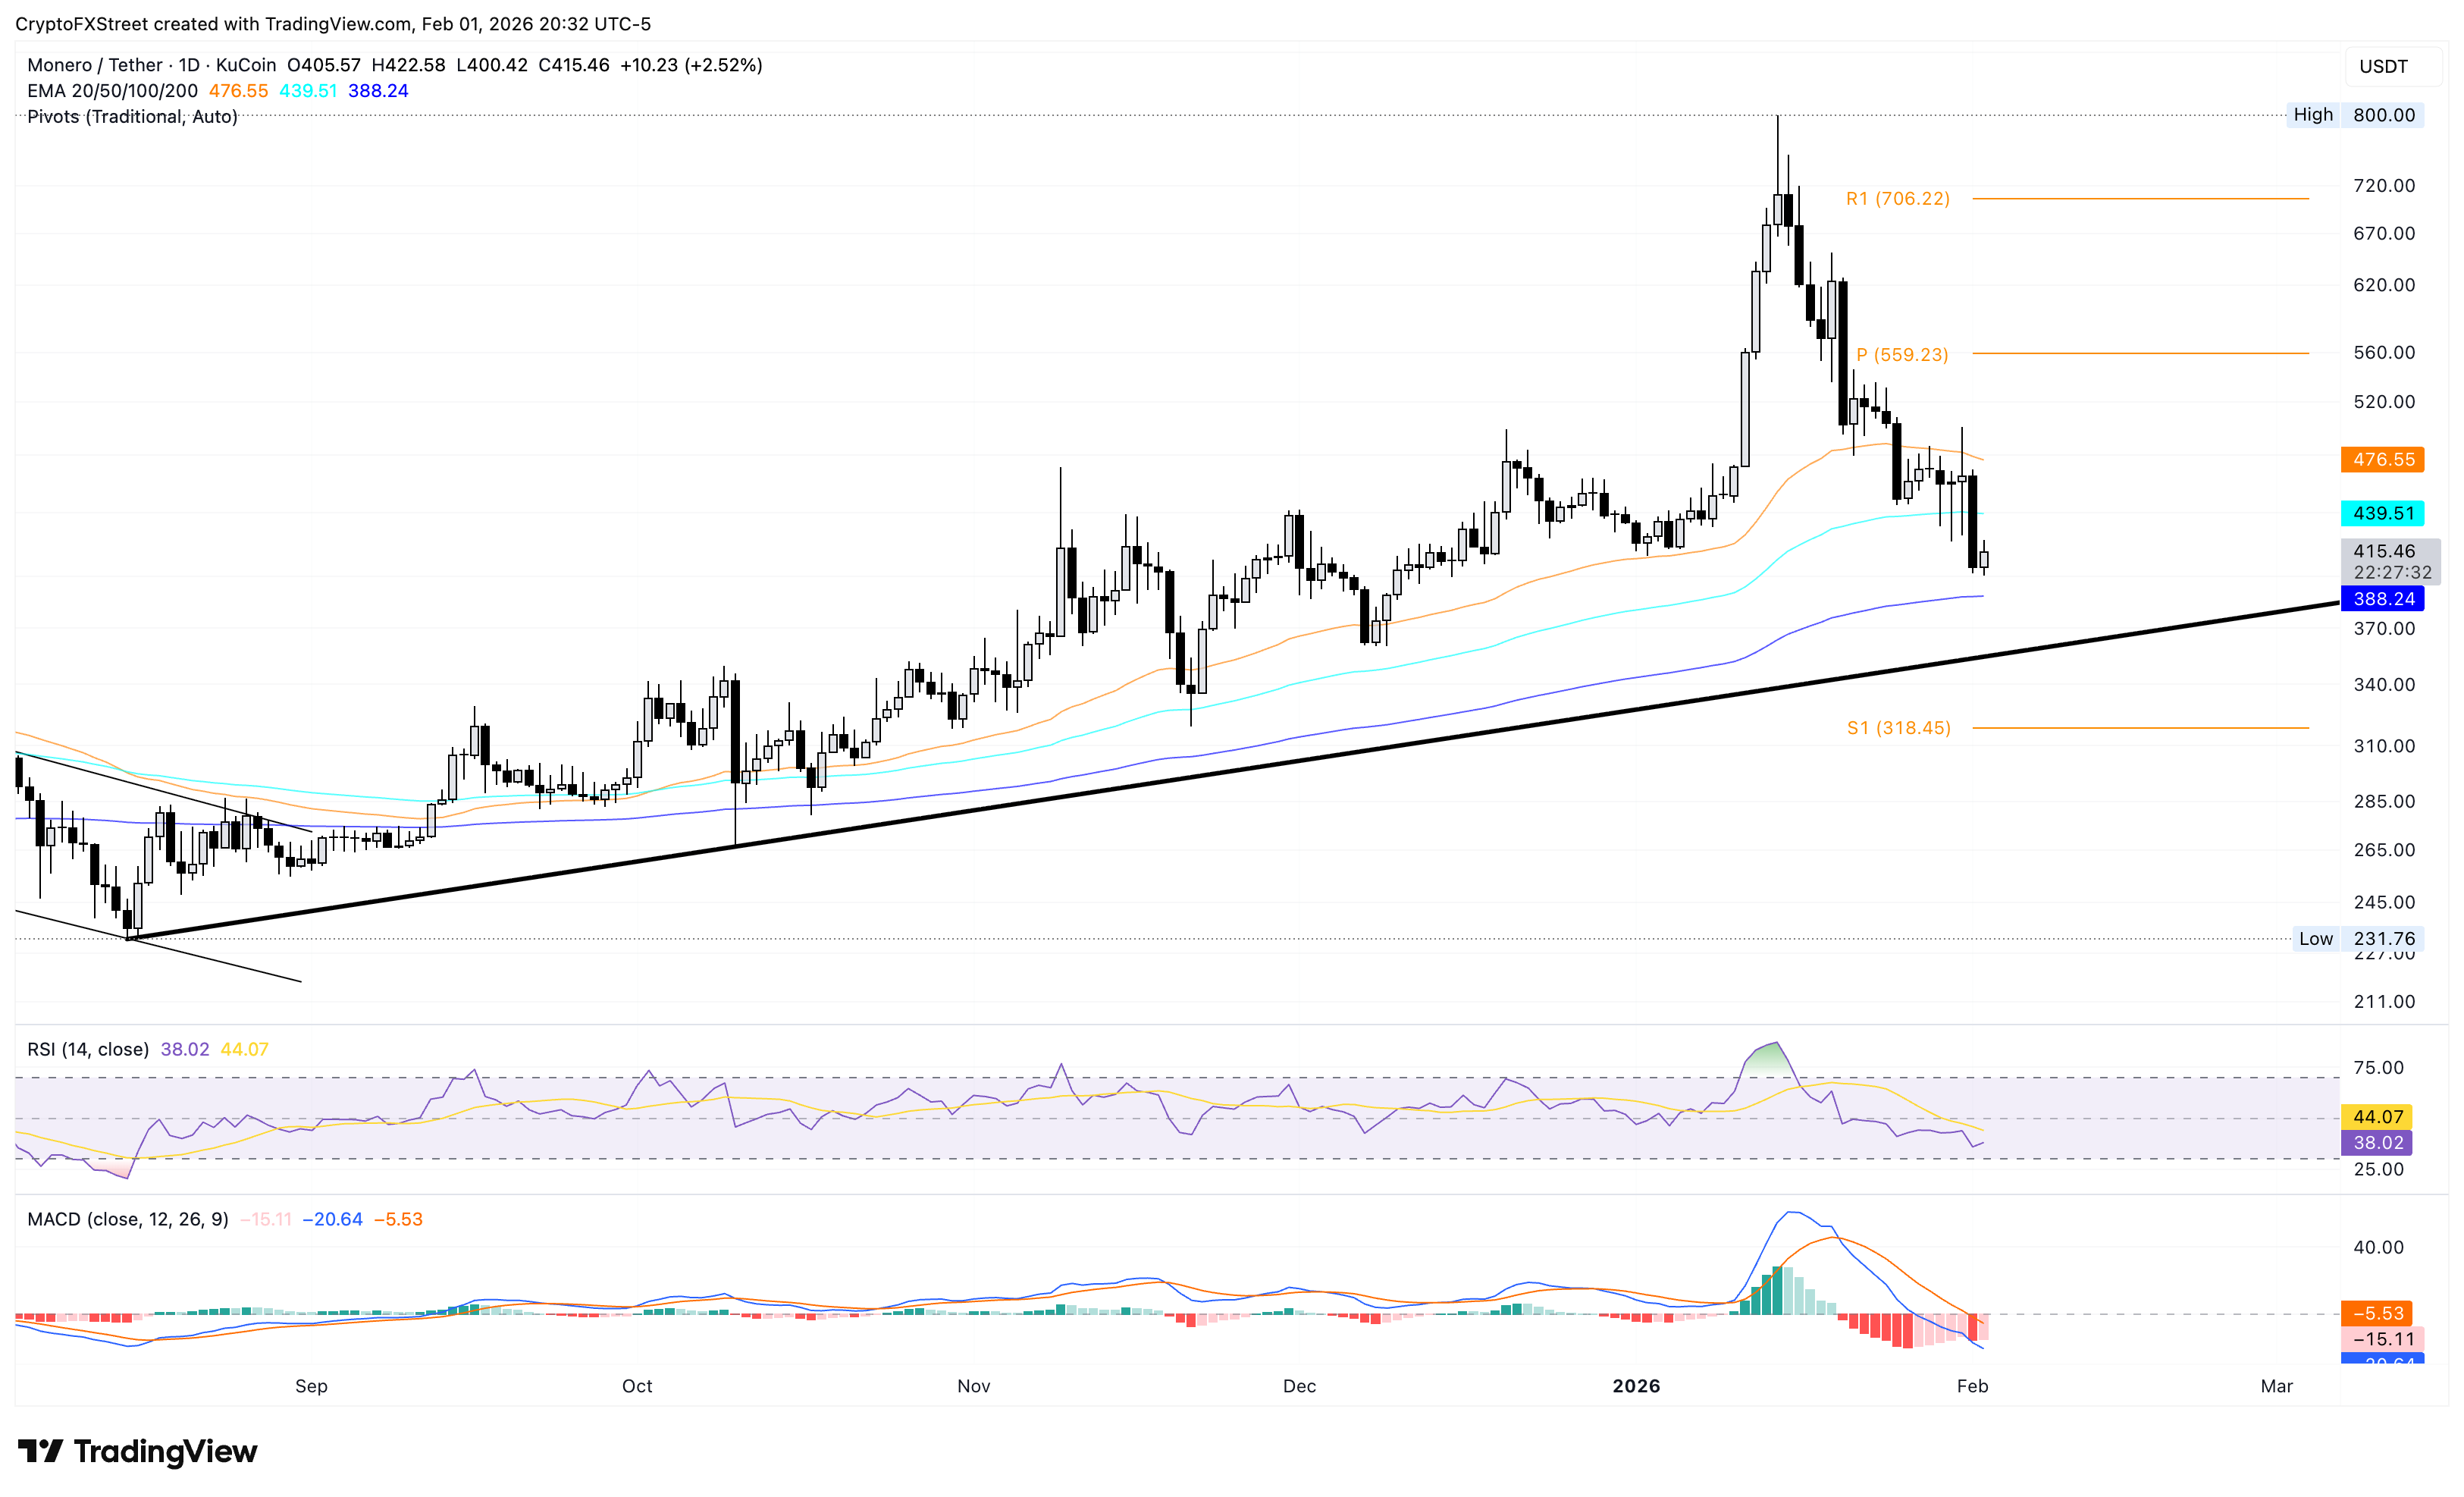
If Monero sustains above $400 or the 200-day EMA at $388, it could rebound toward the 100-day EMA at $439.
Ethereum's free fall hits a critical support zone
Ethereum remains below the downward-sloping 50-day EMA on the daily chart, which is below the 100- and 200-day EMAs, confirming a bearish trend. At press time, Ethereum was below $2,300 on Monday, following five consecutive days of losses totaling a 25% decline. The major altcoin approaches a critical support zone between $2,111 and $2,227, which previously helped drive a rebound in late July.
An RSI reading of 24 indicates oversold conditions, as selling pressure reaches extreme levels, increasing the likelihood of a reversal at the support zone. Meanwhile, the MACD histogram widens below zero as the average lines decline, reflecting heavy bearish momentum.
If Ethereum marks a daily close below $2,111, it would open the door to the S1 Pivot Point near the $2,000 psychological mark.
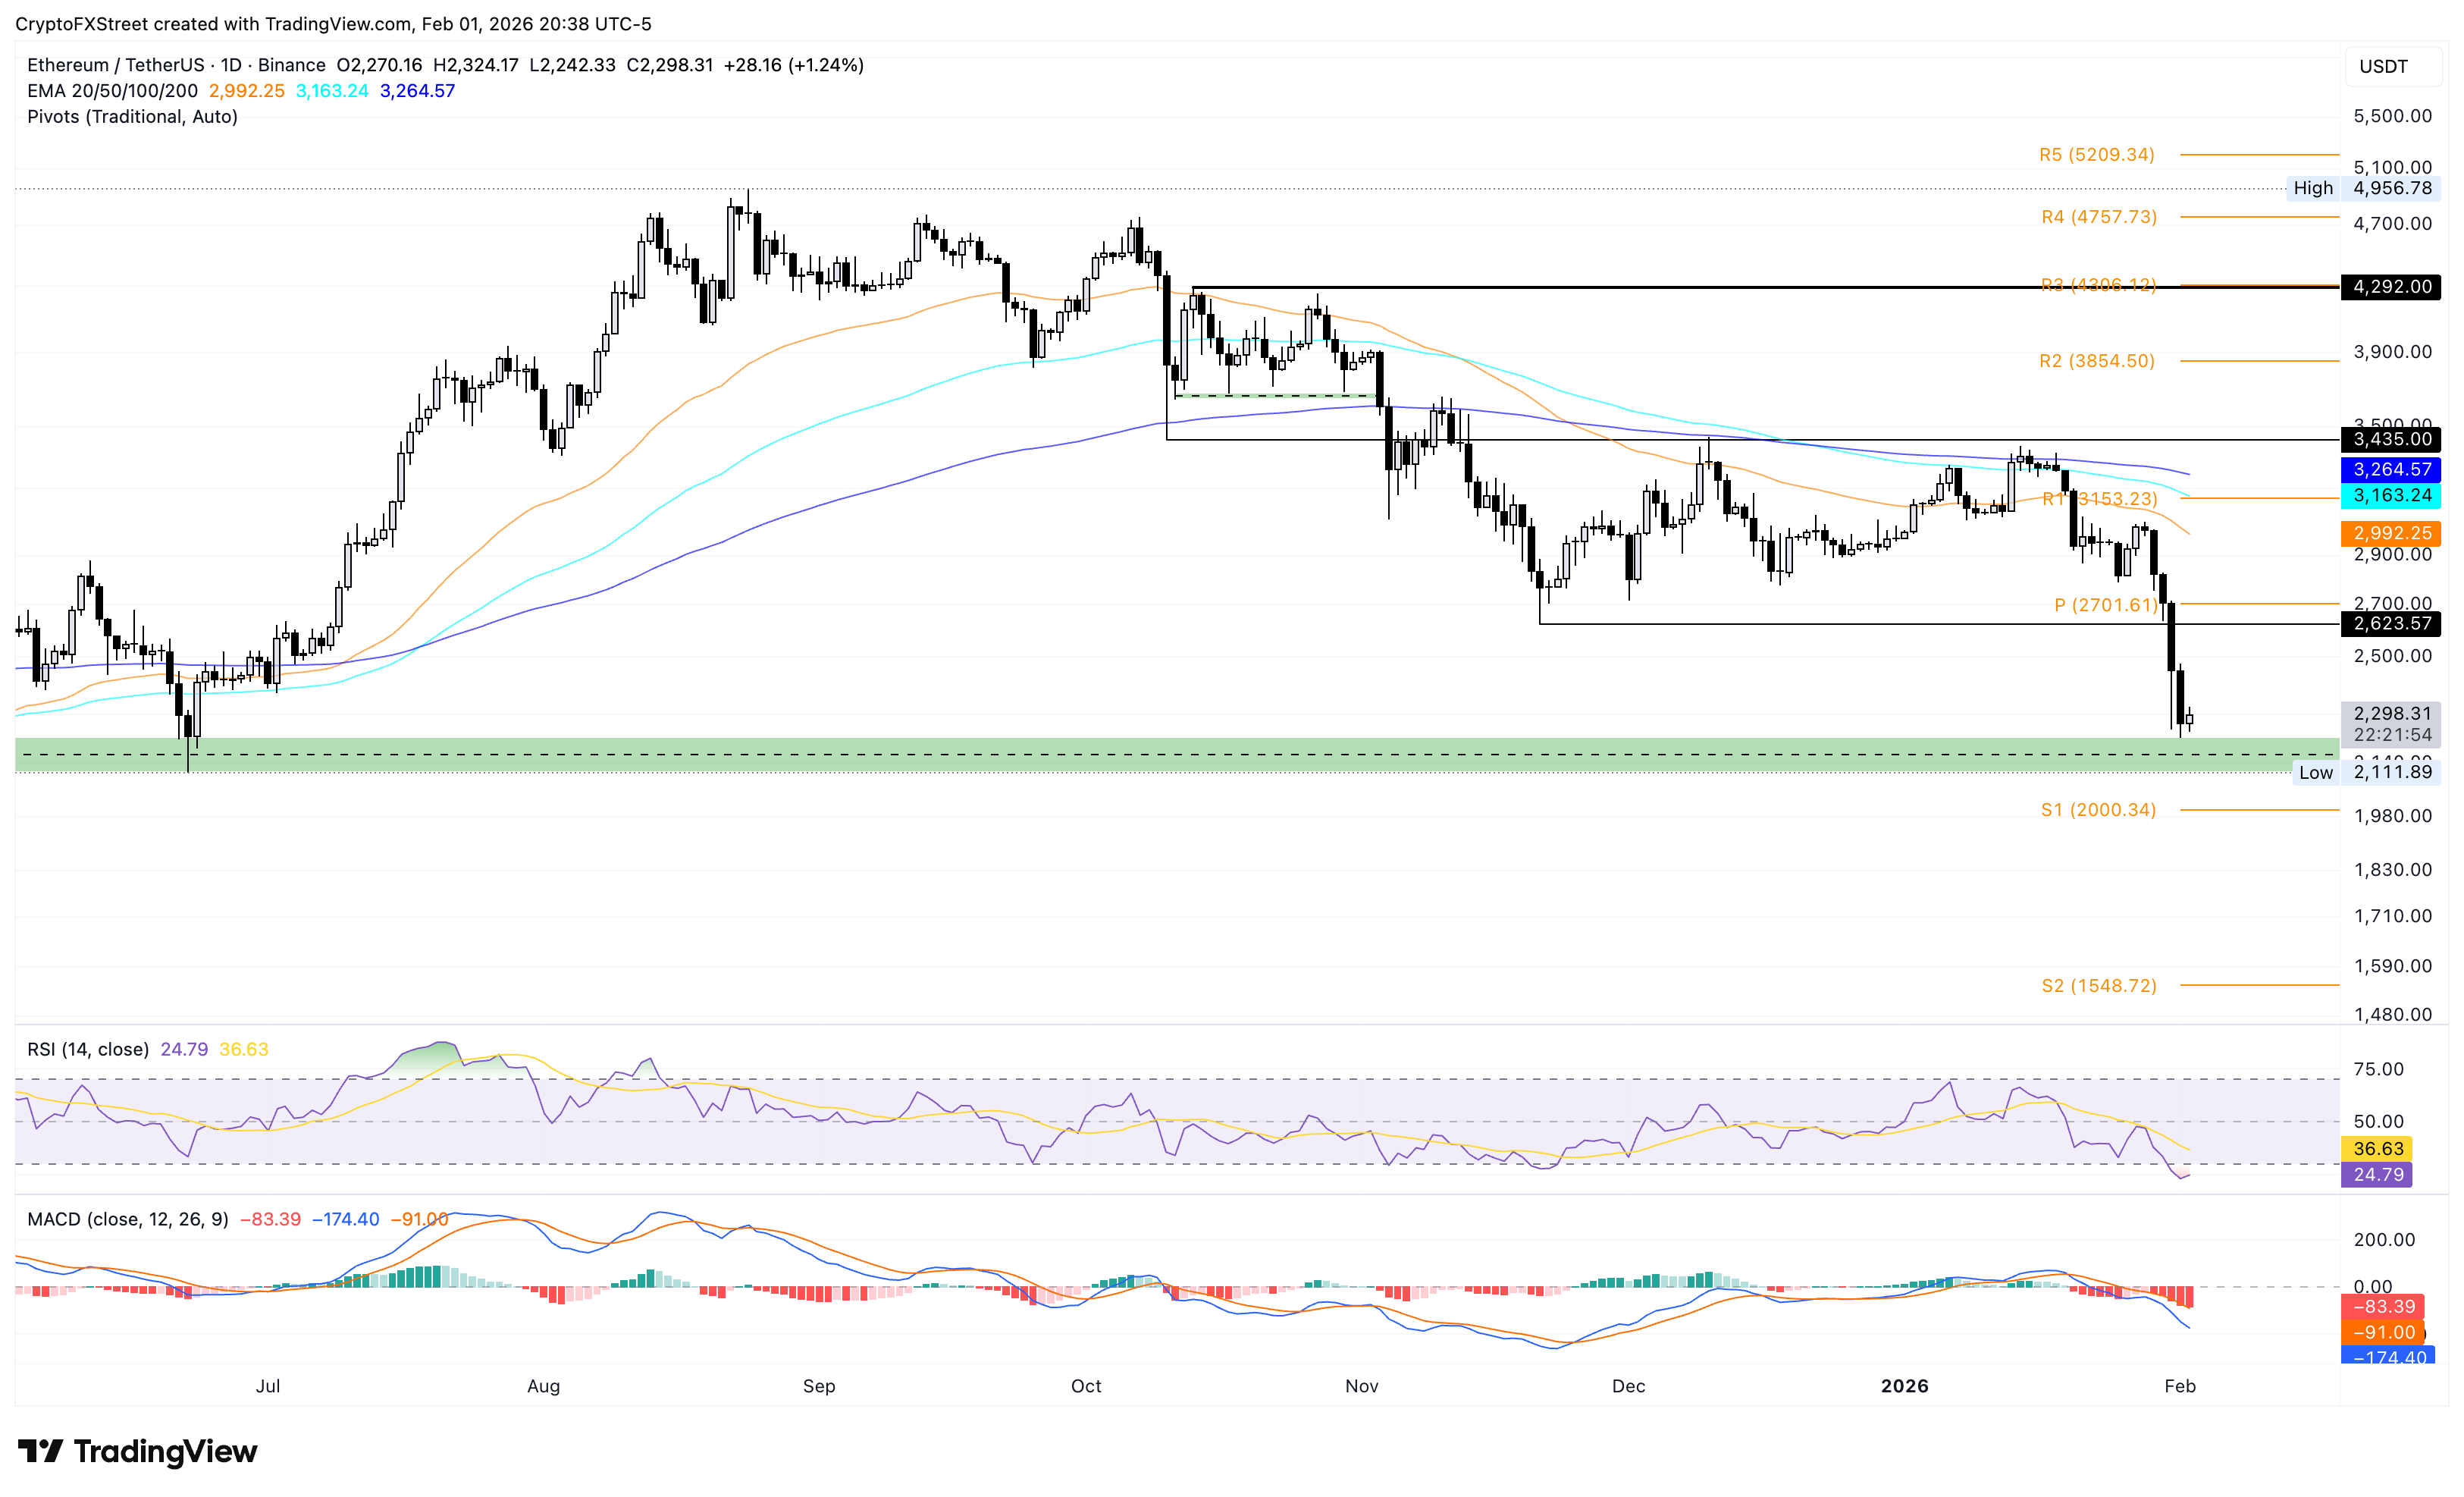
However, a rebound from the support zone could aim for the $2,500 round figure.
Kaspa risks further loss in a wedge pattern
Kaspa is closing near $0.3000 at press time on Monday, continuing its decline after a 22% loss last week. The falling trend in KAS approaches the support trendline of a falling wedge pattern on the daily logarithmic chart, close to the S1 Pivot Point at $0.02439.
The RSI at 23 signals oversold conditions as the prevailing downfall reflects a steady increase in selling pressure. Additionally, the MACD and signal line extend their decline below zero, indicating a persistent bearish momentum.
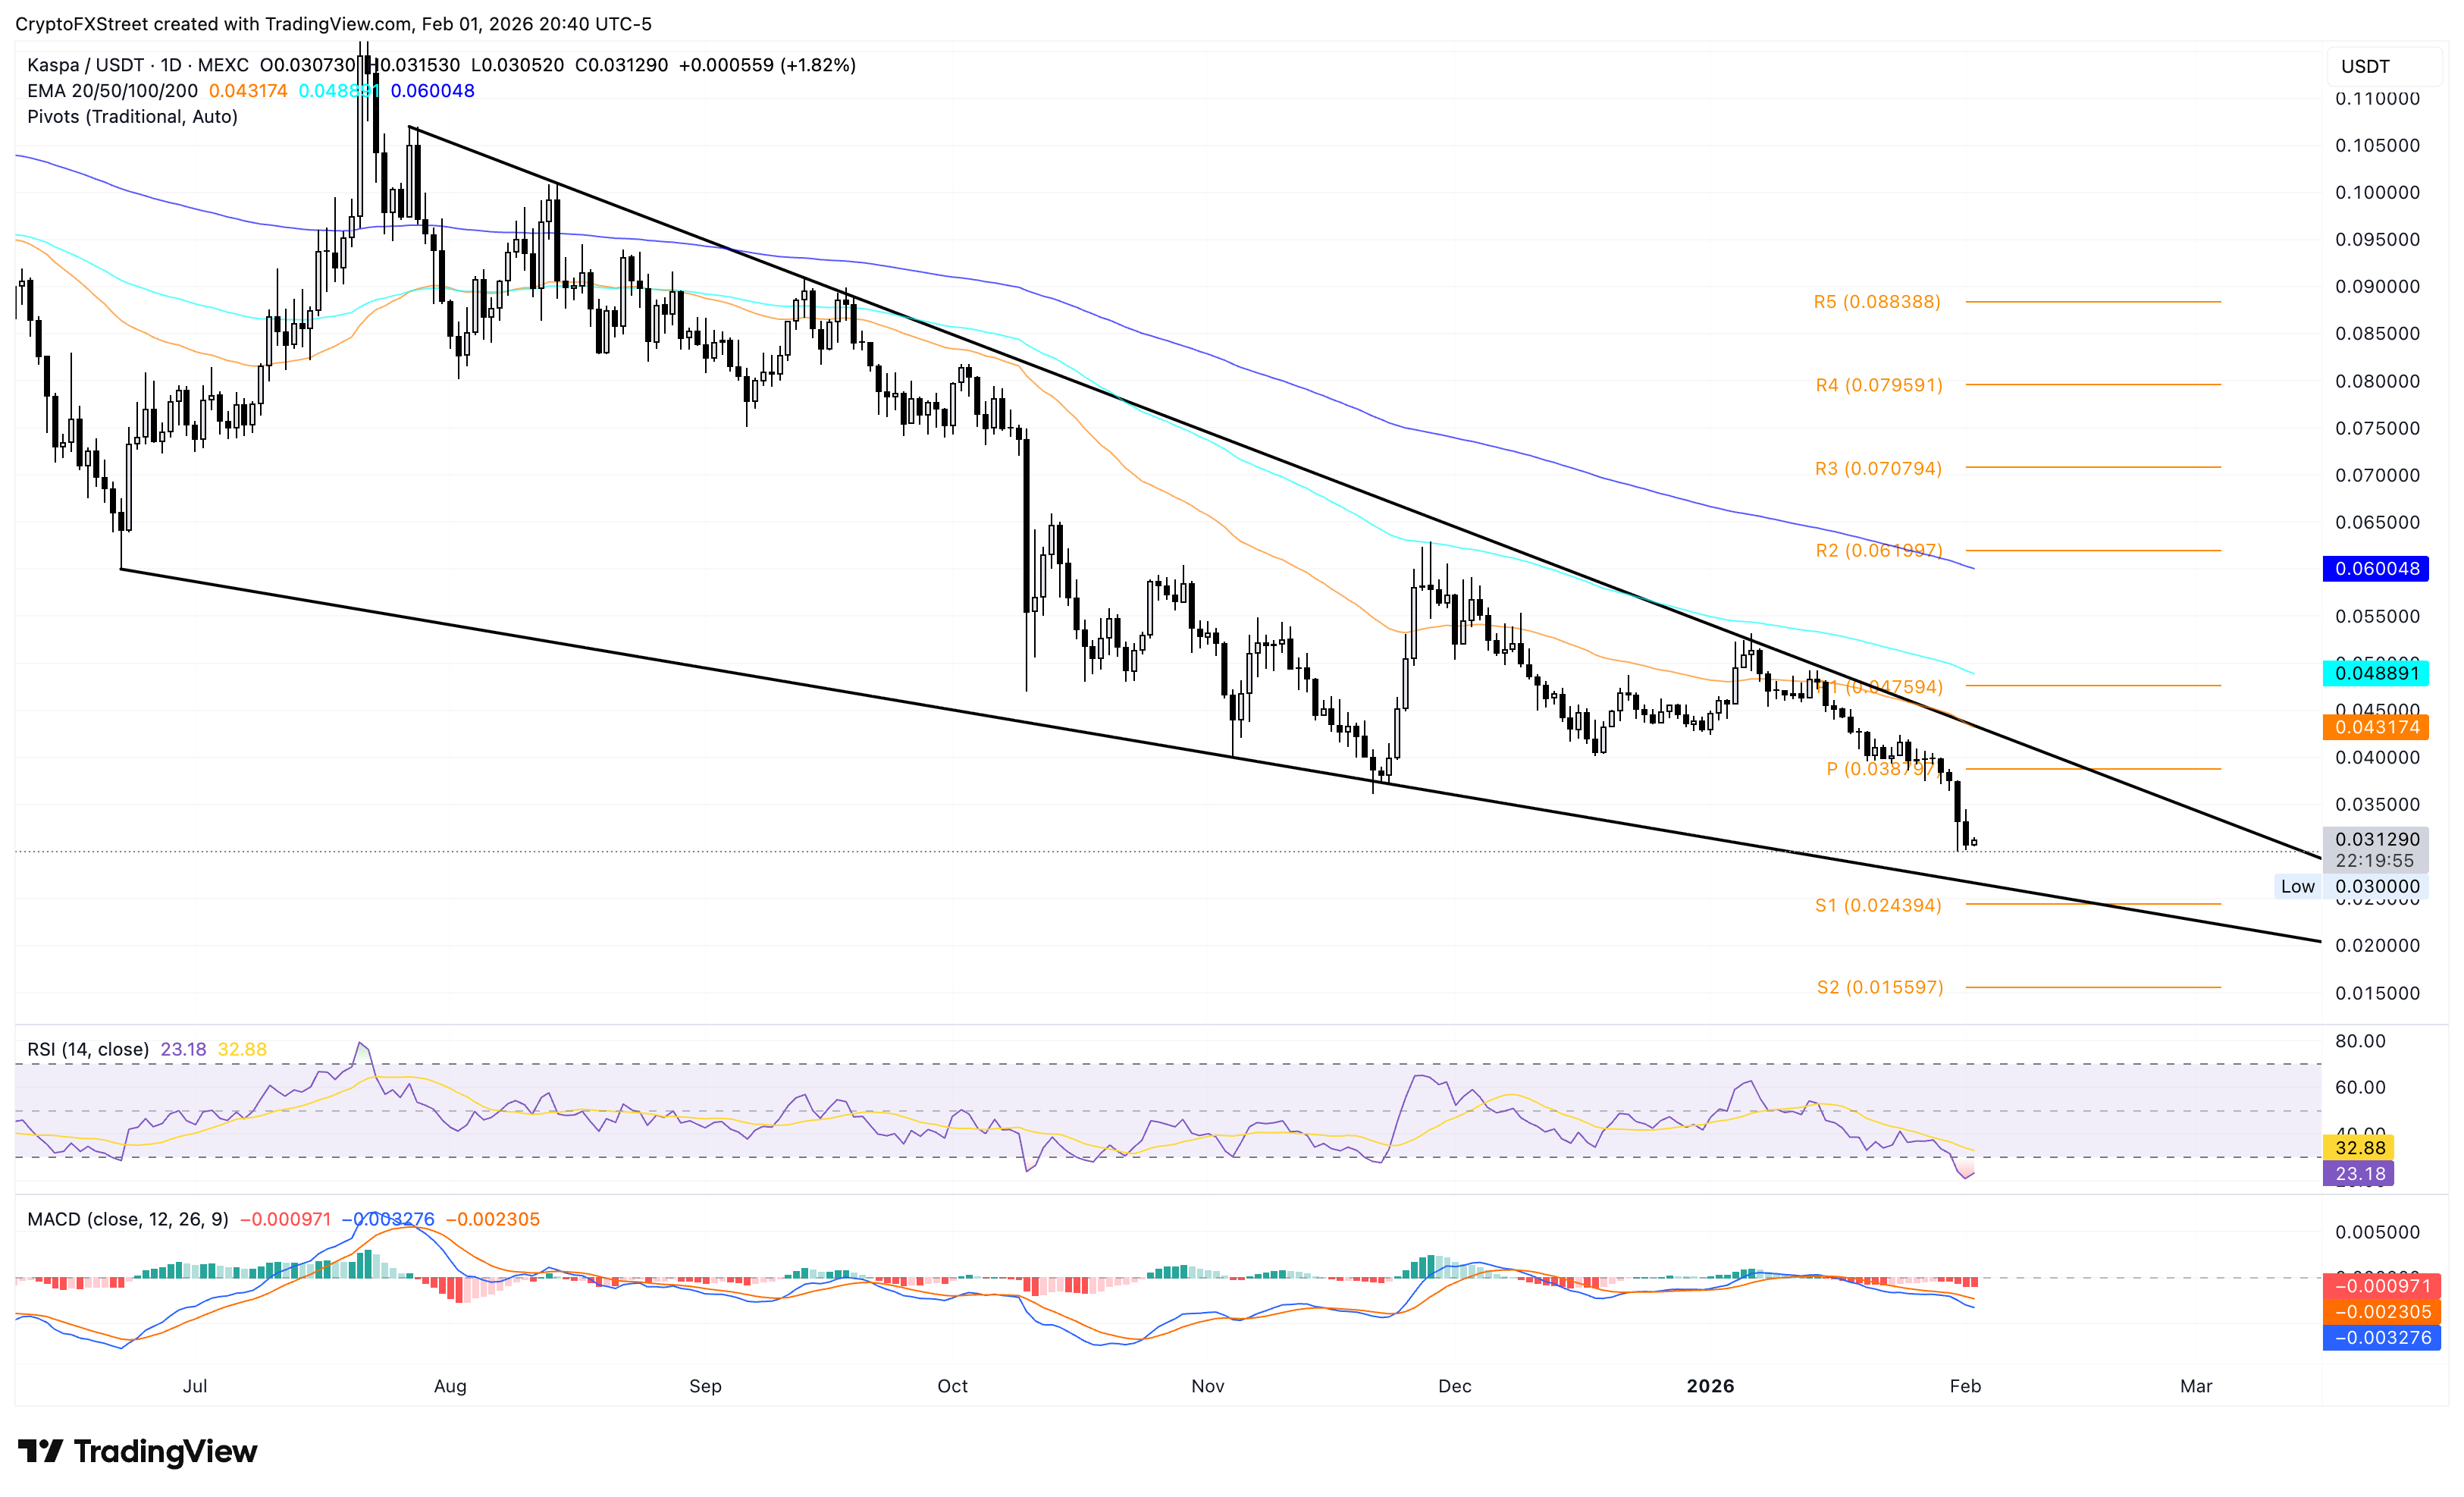
Looking up, despite the limited likelihood of a recovery, the center Pivot Point at $0.03879, near the resistance trendline, would serve as an immediate upside target.
Author

Vishal Dixit
FXStreet
Vishal Dixit holds a B.Sc. in Chemistry from Wilson College but found his true calling in the world of crypto.