Top Crypto Gainers: Dash, Story, Optimism – Altcoins rally as Bitcoin clears $95,000
- Dash trades above $50, recording nearly a 50% gain over the last 24 hours.
- Story tests the 200-day EMA with a 36% jump on Tuesday, with bulls targeting a breakout.
- Optimism holds steady above $0.3600, securing Tuesday’s 18% gains and aiming for $0.4000.

Altcoins, such as Dash (DASH), Story (IP), and Optimism (OP), are leading the broader cryptocurrency rally over the last 24 hours. The altcoins hold Tuesday's gains but ease on Wednesday, risking a potential rollback.
The sudden spike in altcoins aligns with Bitcoin’s (BTC) surge to $95,000 as December’s US Consumer Price Index (CPI) data came at 2.7%, and the core CPI at 2.6%, slightly below market expectations. This data suggests that inflation is gradually declining, relieving the Federal Reserve (Fed) of an immediate need to cut interest rates.
Dash targets further gains above $50
Dash trades above $50 at press time on Wednesday, holding Tuesday’s nearly 50% gains. The privacy coin struggles to surpass $60, facing opposition from the R2 Pivot Point at $61.
If DASH clears this level, it could aim for the R3 Pivot Point at $70.
The technical indicators on the daily chart suggest heightened buying pressure, as the Relative Strength Index (RSI) is at 67, hovering near the overbought boundary, and the Moving Average Convergence Divergence (MACD) is surging, with steadily rising histogram bars.
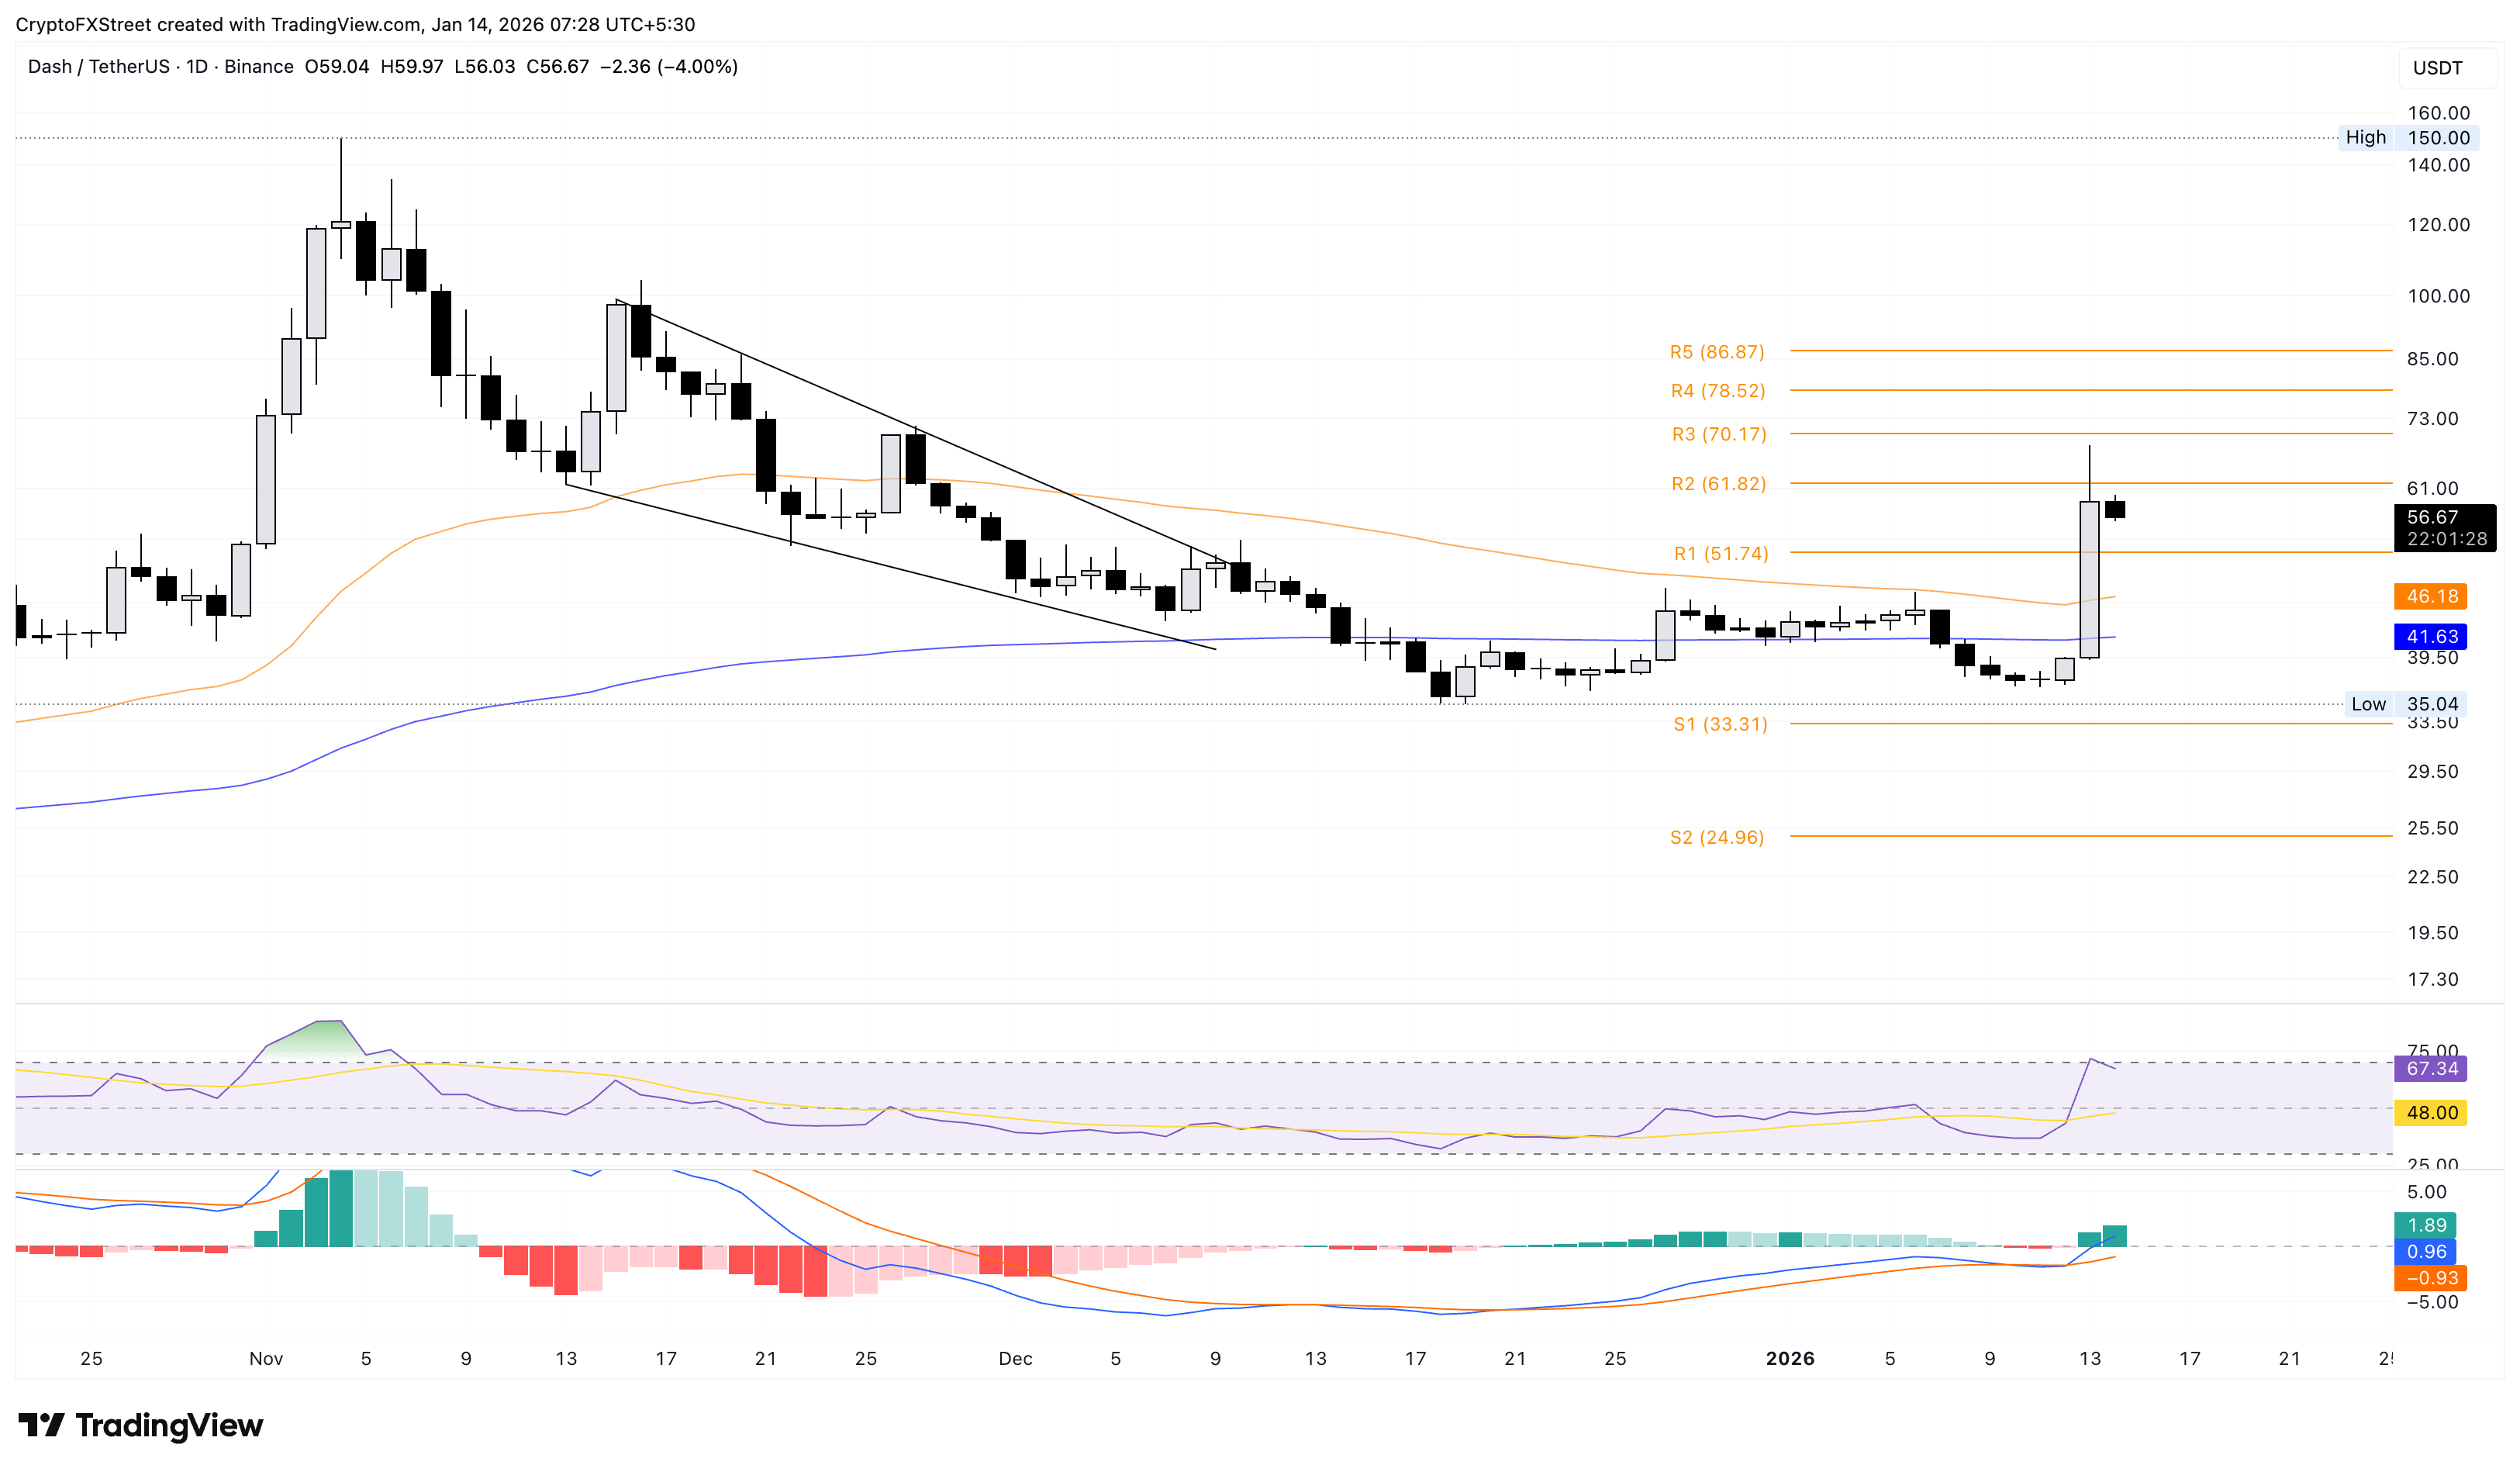
On the flip side, the R1 Pivot Point at $51, near the $50 psychological level, could provide immediate support.
Story eases the rally near the 200-day EMA
Story is down 3% at the time of writing on Wednesday, cooling off from the 36% rally on Tuesday. The meme coin faces headwinds at the 200-day Exponential Moving Average (EMA) at $4.10, capping the gains above the $4.00 round figure.
If IP clears this moving average and the November 12 high at $4.31, it could aim for the $7.11 level, last tested on October 14.
The technical indicators on the daily chart point to strong upward momentum. The RSI at 83 hovers deep into the overbought zone while MACD and signal line rise with steadily increasing green histogram bars, indicating a boost in bullish momentum.
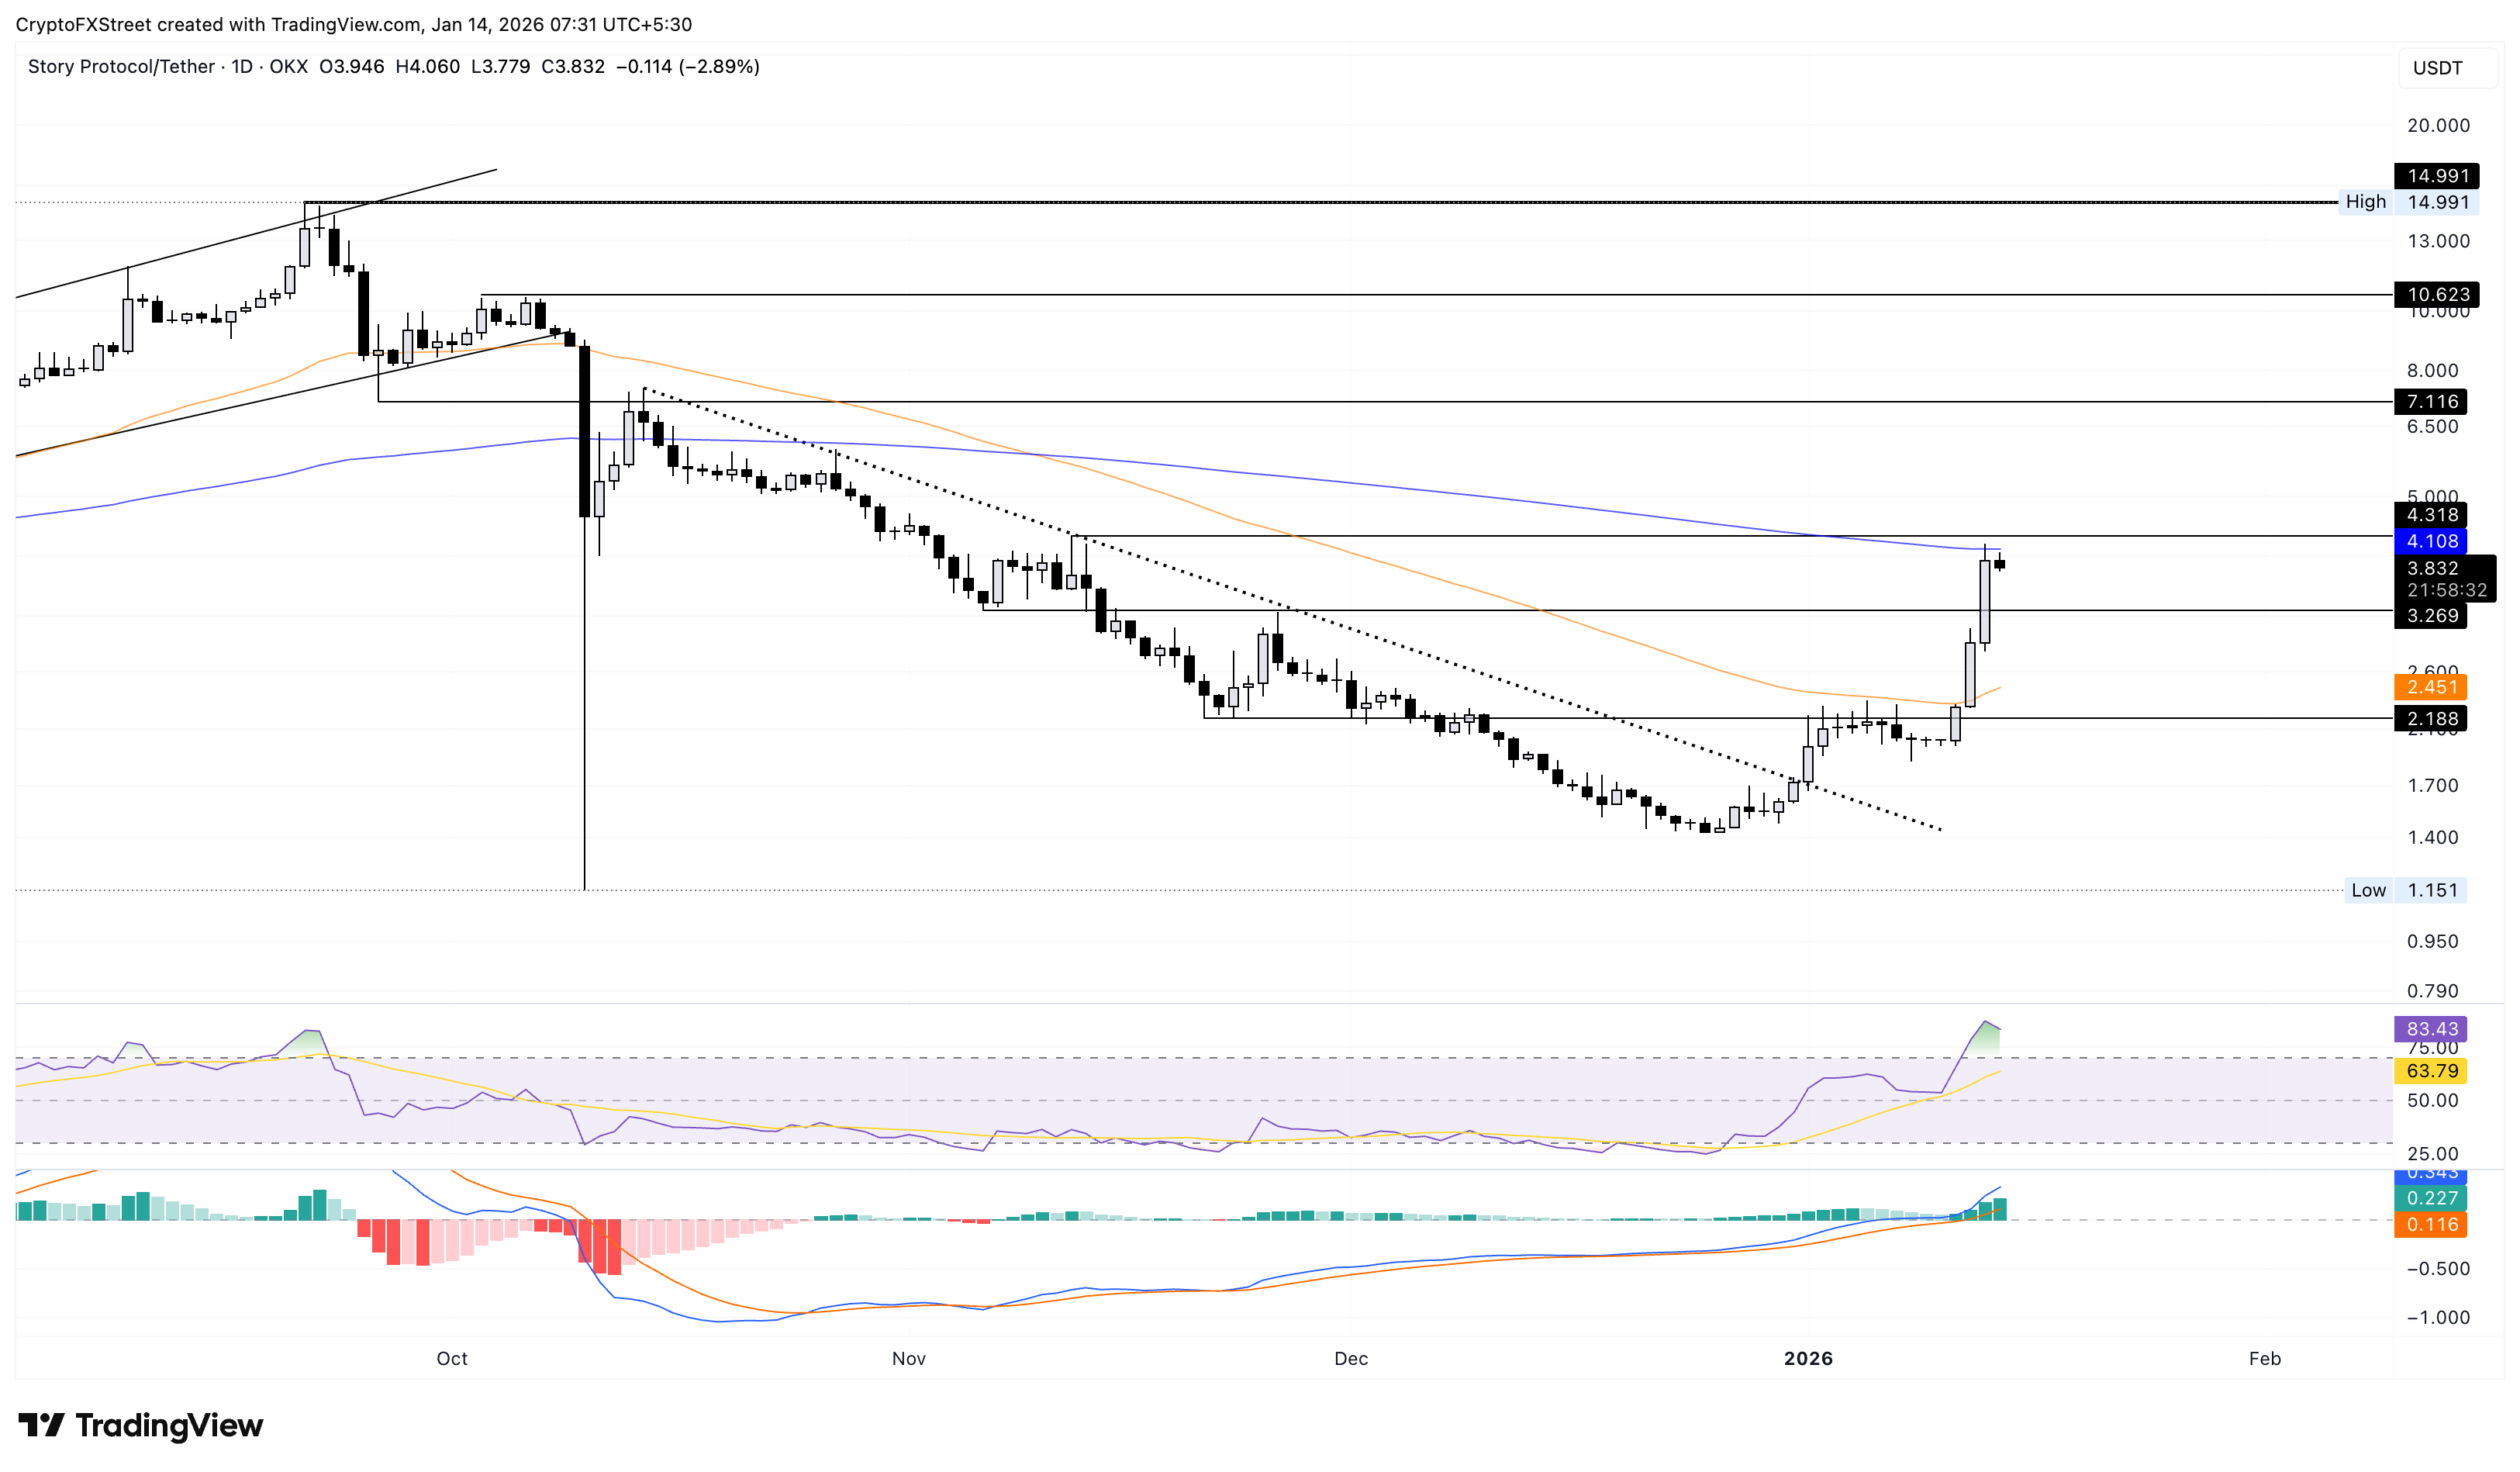
Looking down, a reversal from $4.00 could test the November 6 low at $3.26.
Optimism takes a breather after a sudden surge
Optimism holds steady above $0.3600 at press time on Wednesday, following the 18% jump on the previous day. The layer-2 token aims for the October 17 low at $0.3944, near the $0.4000 round figure.
If OP clears this round figure, it could rise toward the $0.4561 level, which capped a rebound in mid-November.
Similar to Dash, the RSI at 68 and a steady rise in the MACD suggest heightened buying pressure in Optimism.
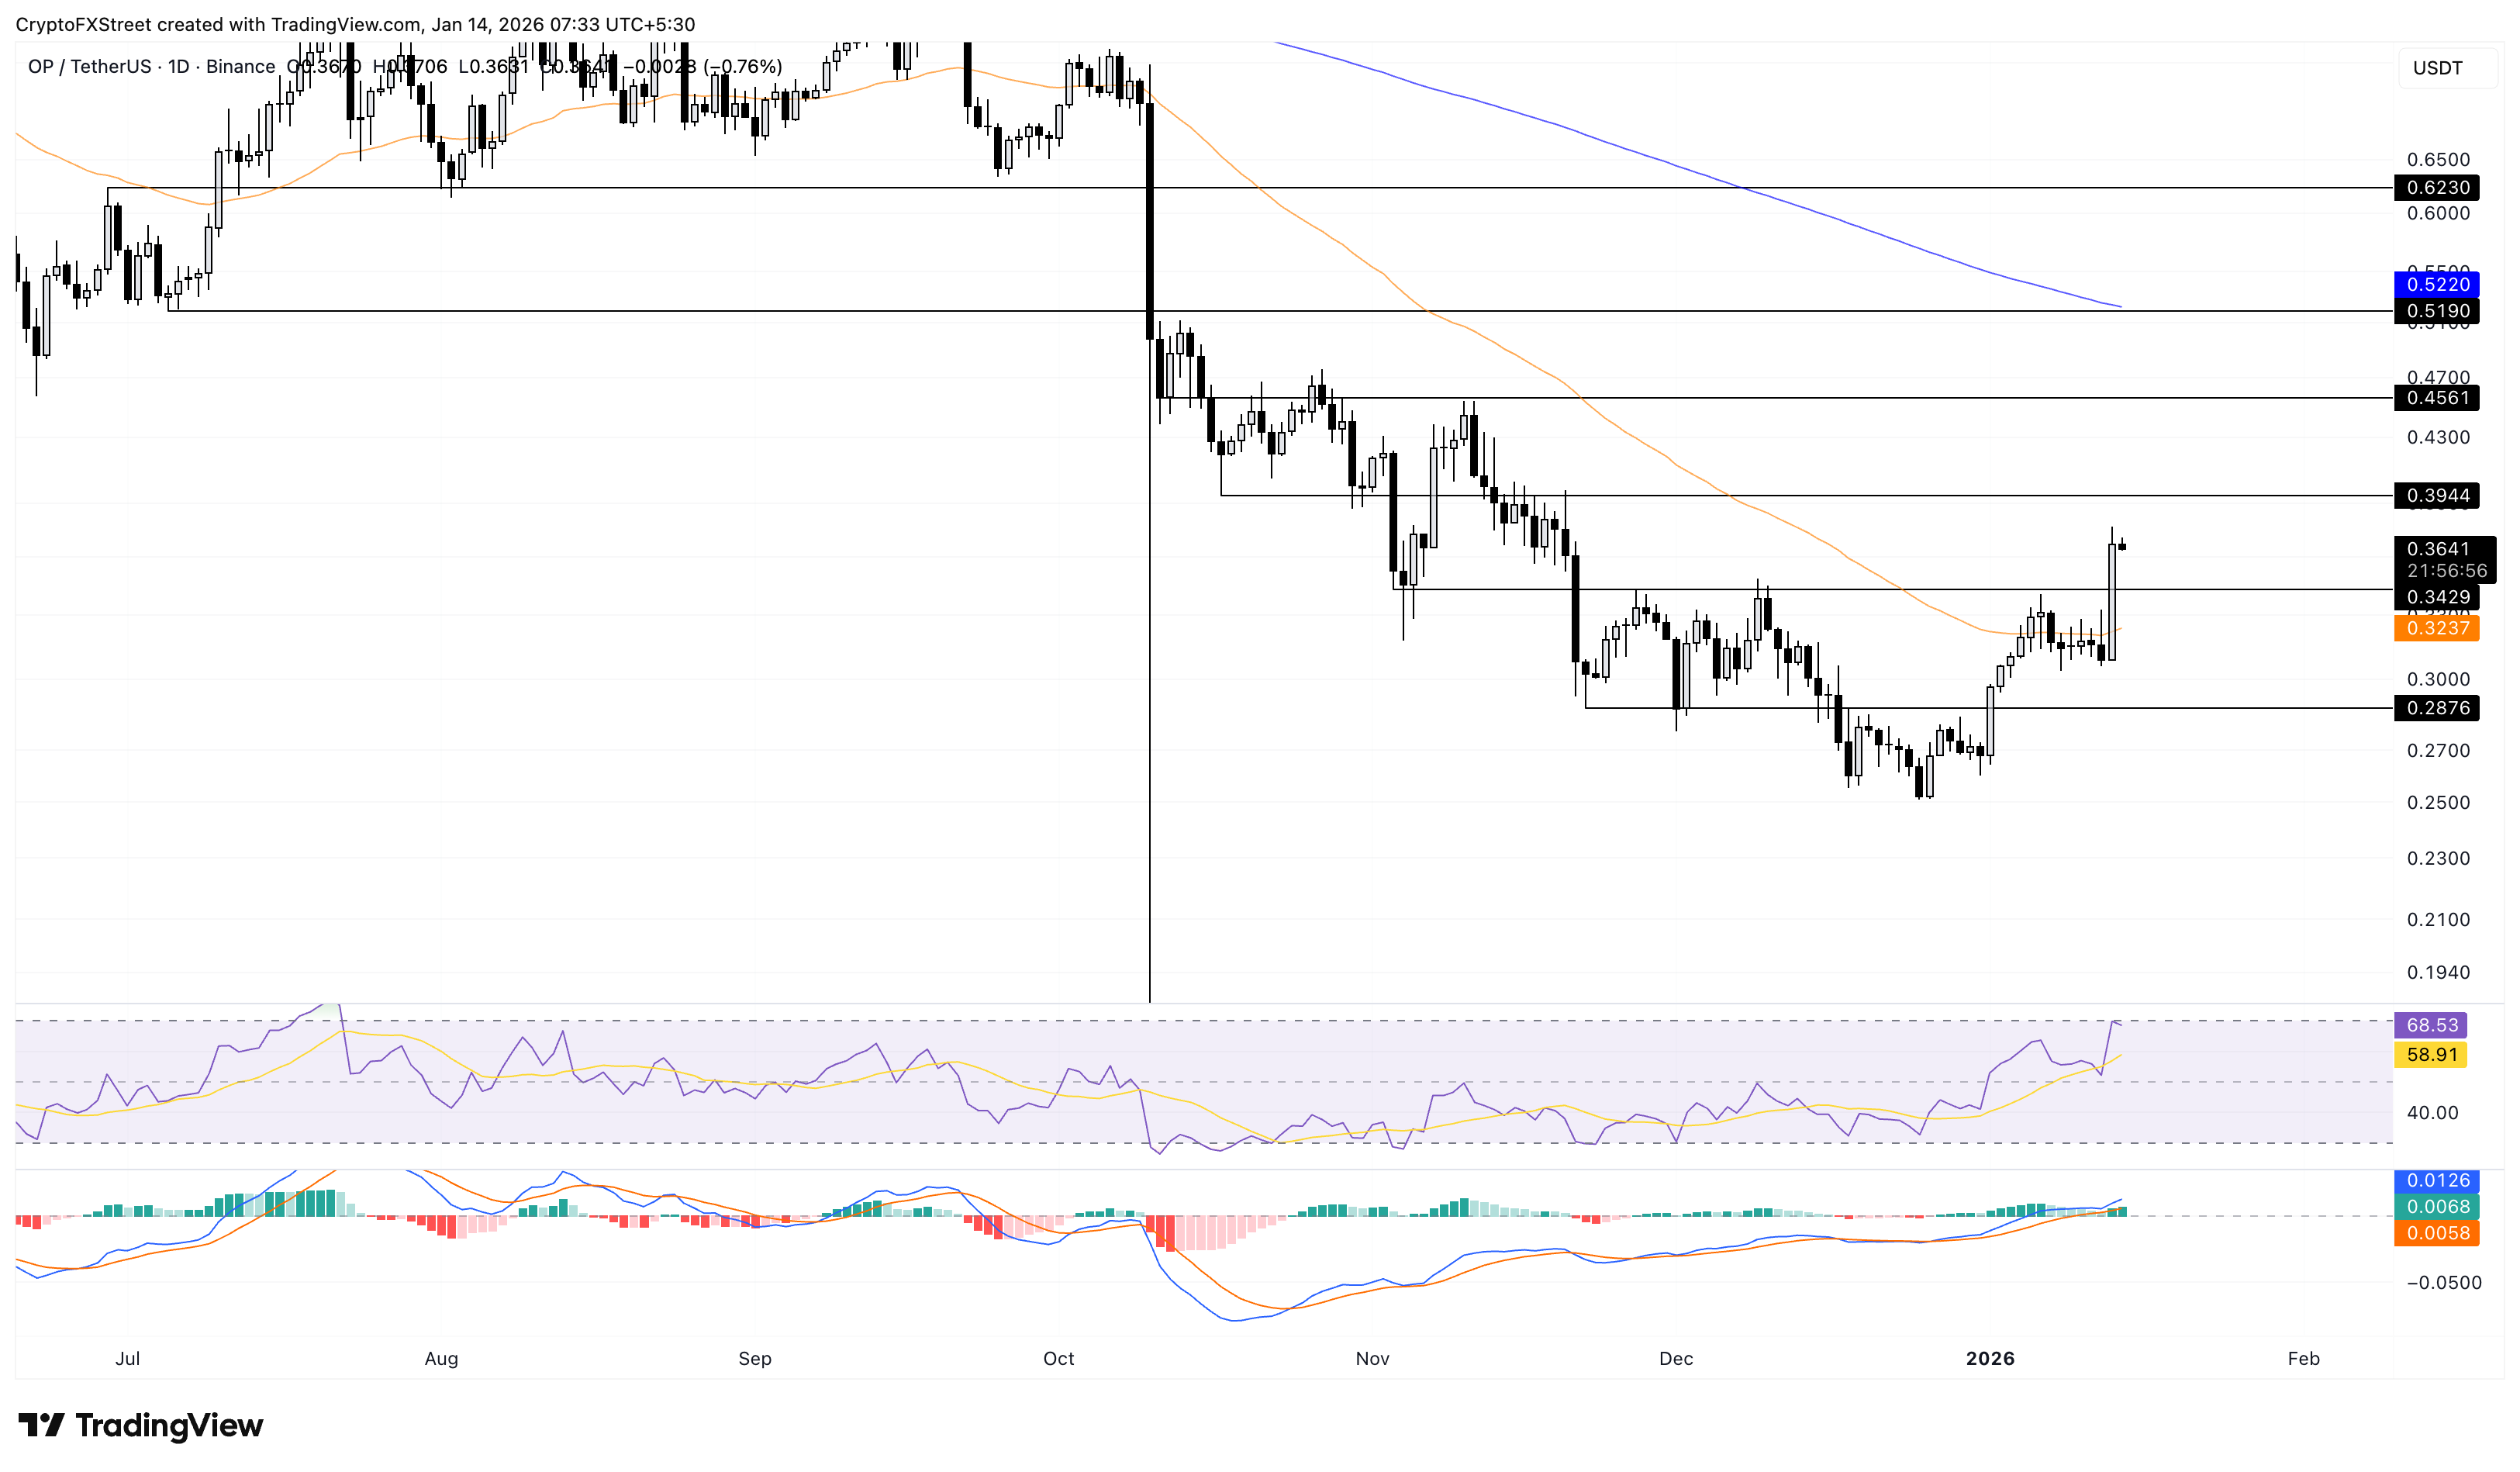
If OP reverses, it could find support at the November 3 low at $0.3429.
Author

Vishal Dixit
FXStreet
Vishal Dixit holds a B.Sc. in Chemistry from Wilson College but found his true calling in the world of crypto.


