Top 3 - Ripple, Bitcoin & Ethereum price predictions: Pure technical price analysis
- Slight price recovery during the weekend is not enough to change the tone, main Cryptos back on the way down
- Bitcoin is consolidating the $8365 level after the increase of buyers at that level

The Crypto board has seen important rises over the weekend, although it hasn't been enough to change the bearish trend of the market in the short-term. We will still need some days until the technical scenario favors again a bullish comeback.
Last week, we wrote about the importance of how the moving averages were positioned, and how they might need some time to re-group after the big bearish leg that the Crypto market has experienced during this first half of the year. These kind of turnarounds are never quick.
XRP/USD 4H chart
-636618890186816426.png)
Ripple reached the $0.7470 during the weekend, meeting the trendline lost on Friday May 11th. The bearish bounce has wasted no time but doesn't have much room to keep going down, right now trading at $0.7070 and with the trendline at $0.7375. This is the resistance to beat, the one that would end the bearish run of the last days. All the moving averages are trading above that price. The 50-EMA is trading around $0.7501, followed by a price resistance at $0.7695. Above there, the resistances are located at $0.78, right where the 200-SMA is, and at the important $0.80 level.
Below the current price, immediate support at $0.7065, followed by $0.68 and $0.665.
MACD in the Ripple 4-hour chart is trading crossed to the upside, but still inside the bearish area of the indicator. It still has room to cover before reaching the equilibrium line, where it will fight before being crossed. This scenario supports the possibility of uncertainty in the upcoming days.
Directional Movement Index in the same chart shows the buyers losing some faith in more falls, while the increase in the buyers supports the possibility of a floor being reached during the bearish movement. ADX is still at high levels, but with a diminishing profile.
BTC/USD 4H chart
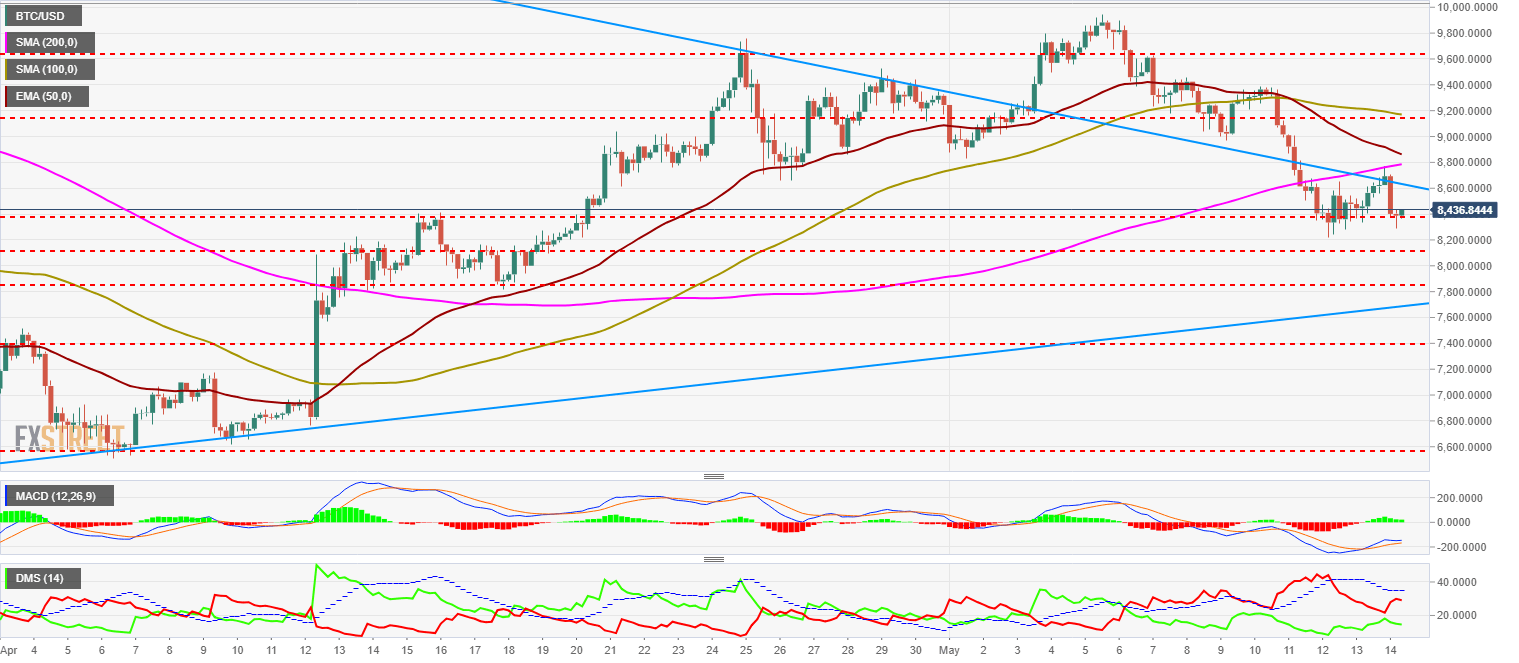
Bitcoin reached during the weekend the 200-SMA at $8765 but was rejected to the downside later, resting now at $8386, where it stopped the bearish leg initiated last week. The moving averages are trading above the current price levels and will act as an attraction level to this one. The projection of these lines proposes a cross area in the $8500/$8900 area in the upcoming days.
On the upside, resistance in the trendline at $8600, followed by the area where the 200-SMA and the 50-EMA are trading. Above there, and as a final resistance to the upside, we find the $9155 level.
On the downside, the first support level is at the current $8430 level, followed by the $8127 and $7850 levels.
MACD in the Bitcoin 4-hour chart shows a similar profile than the Ripple, and the logic of this scenario is similar. It will need some time to get into a purely bullish situation.
Directional Movement Index in the same chart shows how the sellers diminished when the price reached the current level, and also how the buyers keep increasing. ADX is retreating although still at meaningful levels.
ETH/USD daily chart
-636618892102995493.png)
Ethereum is the only asset in today's analysis that has been able to trade above the current moving averages. ETH/USD is trading just below the 100-SMA and the 50-EMA, although way above the 200-SMA. Despite the current dips, its profile is still bullish, although is now entering a lateral-expansive structure that might weaken the chart scenario in the medium term. Ethereum is losing relative strength against Bitcoin, and might surrender its leadership to BTC/USD.
On the upside, main resistances are located at $712, $760 and $812. Below the current price, the support is at the current level of $697. Below there, the main supports are $657 and finally the 200-SMA at $641.
MACD in the Ethereum 4-hour chart is trading very close to the equilibrium line, showing a profile that might propose a bullish attack later today.
Directional Movement Index in the same chart is showing buyers overcame sellers during the weekend, before losing again the lead earlier today. Buyers have reacted with strength to the lows at $660.
Author

Tomas Salles
FXStreet
Tomàs Sallés was born in Barcelona in 1972, he is a certified technical analyst after having completing specialized courses in Spain and Switzerland. He expanded his technical training following the guidance of great experts on the financial markets.


