Top 3 price predictions for Bitcoin, Ethereum, and Ripple: short-term analysis
- BTC/USD trading above $9200 but stuck below $9273, a key level to breach to end the current retracement
- Similar situation in Ripple, with the key level located at $0.851215

Cryptocurrencies are bouncing up in the early trading hours today. This is just a rebound for now, as main Cryptos have not been able to trade above the median price of the bearish daily candlesticks from last Wednesday.
To get a more clear perspective of the current scenario, we can't lose track of the moving average structures. The structural analysis of these MAs (200-SMA, 100-SMA and 50-EMA) might allow us to understand the development of a first congestion area, as these moving averages are getting closer and closer. They should meet at some point during the next weeks in a tight price area that might generate some volatility.
BTC/USD 4H chart
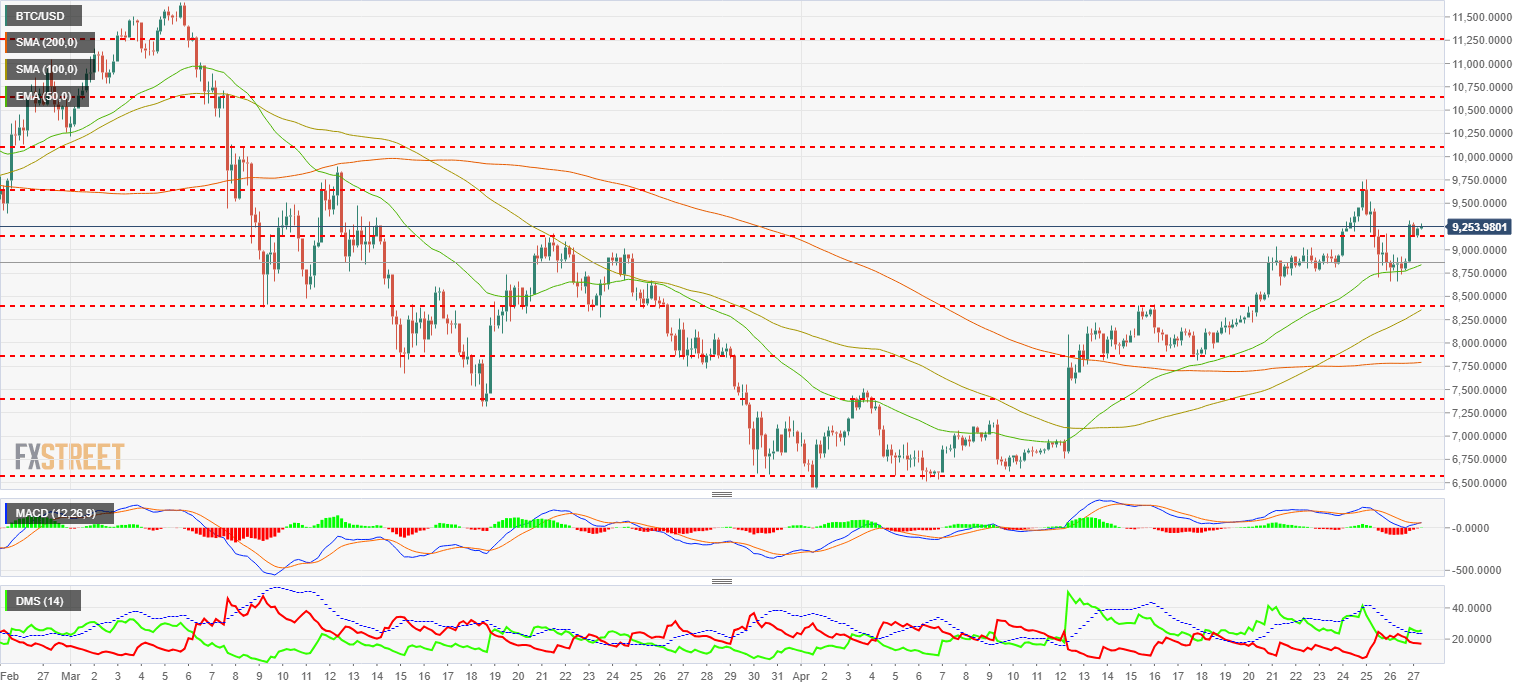
Bitcoin has not been able to break above $9273, so today's bounce needs to be tagged as a simple bounce from the significant falls from the last couple of days. Only above that level, we would see a rise to relative highs, located at $9750.
BTC/USD found support yesterday in the 50-EMA at $8875, from where it turned back up in the last trading hours from the American session. Bitcoin has overcome the resistance located at $9150, but hasn't been able to leave such level behind.
MACD in the Bitcoin 4-hour chart turned to the upside above 0 level but without crossing the signal line up. A bearish move in the first attempt to cross up is possible. The structure is positive in the short term for a bullish development, but possible sudden changes to the scenario are not out of the cards.
Directional Movement Index in the same chart shows again a positive structure to the Bitcoin price. D+ has overcome the ADX, gathering bullish potential, while sellers are diminishing and are below the level indicating trend strength.
ETH/USD 4H chart
-636604208295412568.png)
Ethereum is replicating the technical action of Bitcoin. Same considerations for future scenarios than in BTC/USD apply here, with the $666 level being the key level to consider the current up-move something bigger than a rebound. Trading above such level is the necessary step to attack the $700 resistance. Supports are located at $657, followed by $620 and $570.
MACD in the Ethereum 4-hour chart shows a similar profile to the Bitcoin one, trading in the bullish side of the indicator but still with notable chances of bearish moves in the short term.
Directional Movement Index in the same chart is diverging from the Bitcoin one, as D+ has not been able to overcome ADX, which limits the bullish scenario.
XRP/USD 4H chart
-636604208741665743.png)
Ripple is one of the main Cryptos of the week thanks to several positive news involving its platform in the mid-term. It has not impacted the price yet, as it is still anchored to the general Crypto behavior, but it might be really positive and attract more buying interest in the next bullish swing.
Ripple has broken below the 50-EMA, stopping at the $0.7675 support to reach, in the current bounce, the immediate resistance at $0.8500. Above there, $0.8815 looks like the key level to initiate a bullish trend, with the bigger resistance located at $0.955.
MACD in the Ripple 4-hour chart shows that the 0 level has been, as the indicator is fully moving inside negative territory. A bullish bounce to test the 0 line is possible, but it should continue with the falls afterwards.
Directional Movement Index in the 4-hour chart shows sellers in total control of the situation, although they are retracing. Buyers are increasing their positions but very slightly.
Author

Tomas Salles
FXStreet
Tomàs Sallés was born in Barcelona in 1972, he is a certified technical analyst after having completing specialized courses in Spain and Switzerland. He expanded his technical training following the guidance of great experts on the financial markets.


