Top 3 price prediction BTC, ETH, XRP: CFTC takes a surprisingly bold step to move cryptos forward
- The CFTC is open to Ethereum futures without anyone picking-up the ball.
- XRP is currently the only bullish option currently in the Top Three.
- Current volatility levels have last been seen in May.

Green is the dominant color the cryptocurrency market this European morning – at least among the Altcoins. Bitcoin, on the other hand, is flickering between red and green after standing with gains on Monday.
There are two significant developments highlight today:
- CFTC Chairman Heath Tarbert stated that we could see the launch of Etehreum futures as soon as 2020. He accompanied this statement with the realization that no group had shown interest in this launch.
And why? I sincerely believe that institutional investors still fail to understand the intrinsic value of Blockchain-supported projects. They know the possibility that Bitcoin acts as a reservoir of value – just like that.
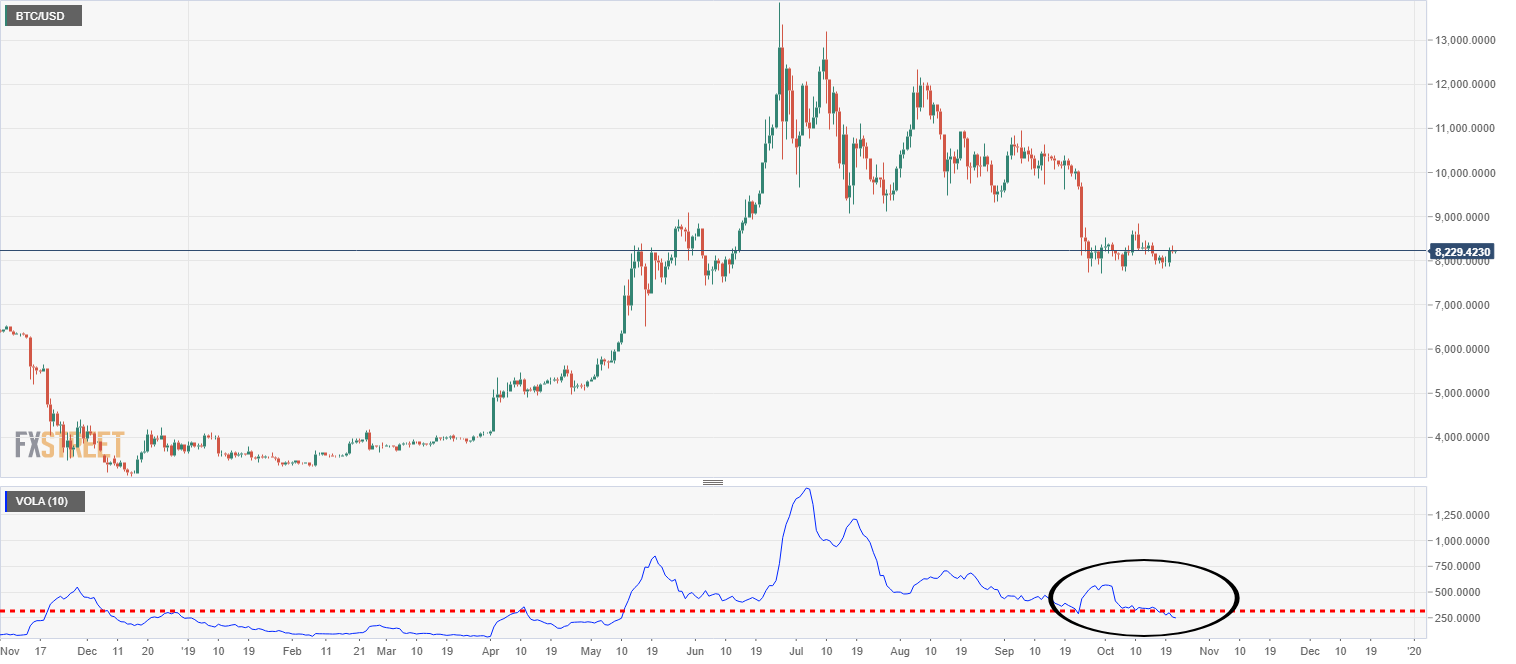
- Another comment comes from Josh Rager, a well-known community member. Rager claims that Bitcoin is close to an explosion of volatility. He bases his bold statement on the narrowing of Bollinger bands in the last sessions.
This forecast is a possibility, but BTC/USD volatility indicators do not seem to agree. Just in the last few sessions, the indicator that measures price volatility has dropped and entered a territory that has not been witnessed since last May. The chances of the decline continuing are higher than the options of a recent trend turn. (see image)
ETH/BTC Daily Chart
The ETH/BTC pair is currently trading at 0.0211 and currently appears to be supported by the EMA50 at exactly this point. There is clear support up to the 0.020 level with the SMA200, while below this second support level, the third one is already below the 0.019 level.
On the upside, the first resistance level is at 0.022, then the second at 0.023 and the third one at 0.025, where the SMA200 passes.
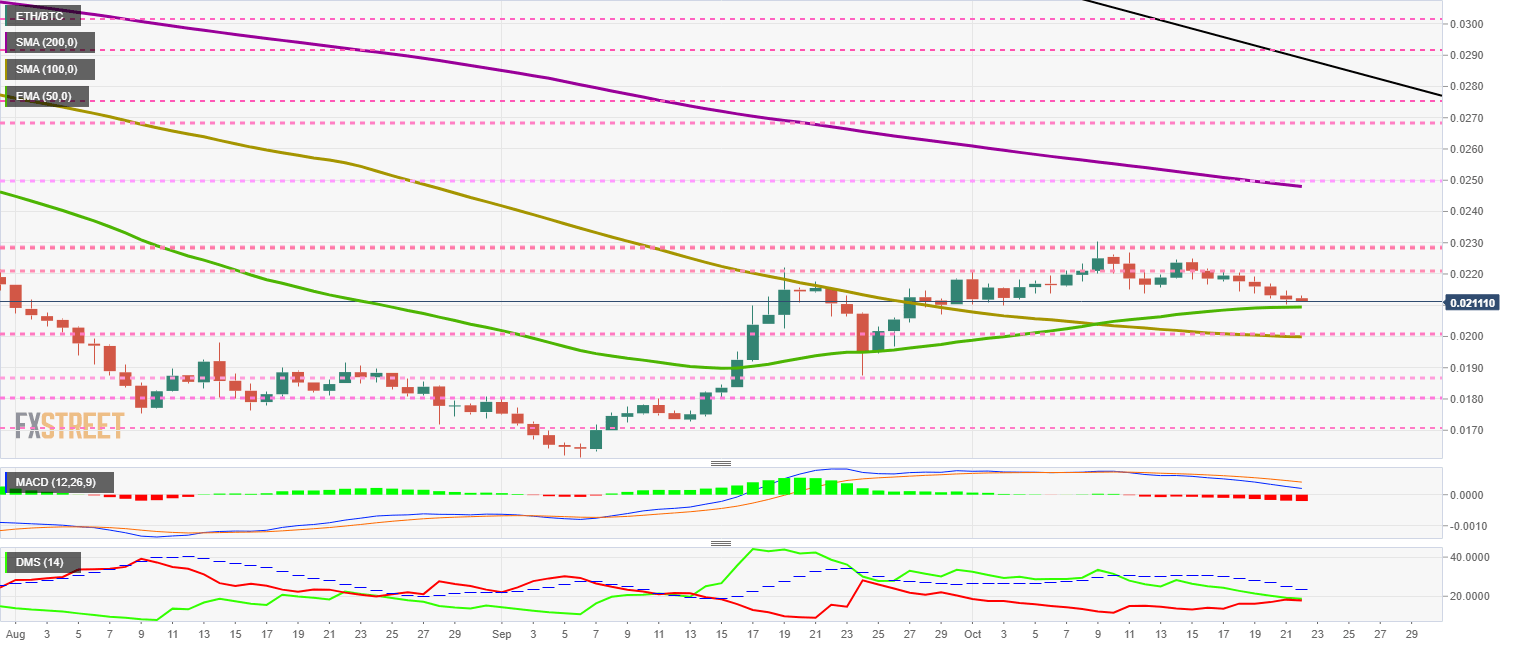
The MACD on the daily chart shows a continuation of the consolidation process, with a low profile and a gradually increasing line spacing.
The DMI provides us with considerably more information on the current situation of the asset. Bulls and bears are tied a little below indicator level 20. This configuration indicates that neither side of the market is now strong enough to lead the price. The ADX is in decline, which supports a decrease in trend strength.
BTC/USD Daily Chart
BTC/USD is currently trading at $8.259 and is trying to consolidate this mid-zone of the price range won yesterday. The main moving averages are between $9,000 and $10,000 and mark the moment of Bitcoin weakness.
Above the current price, the first resistance level is at $8,450, then a robust resistance at $8,850 where the EMA50 and the SMA200 converge and the third one at $9,150.
Below the current price, the first support level is at $8,200, then the second at $8,000 and the third one at $7,850.
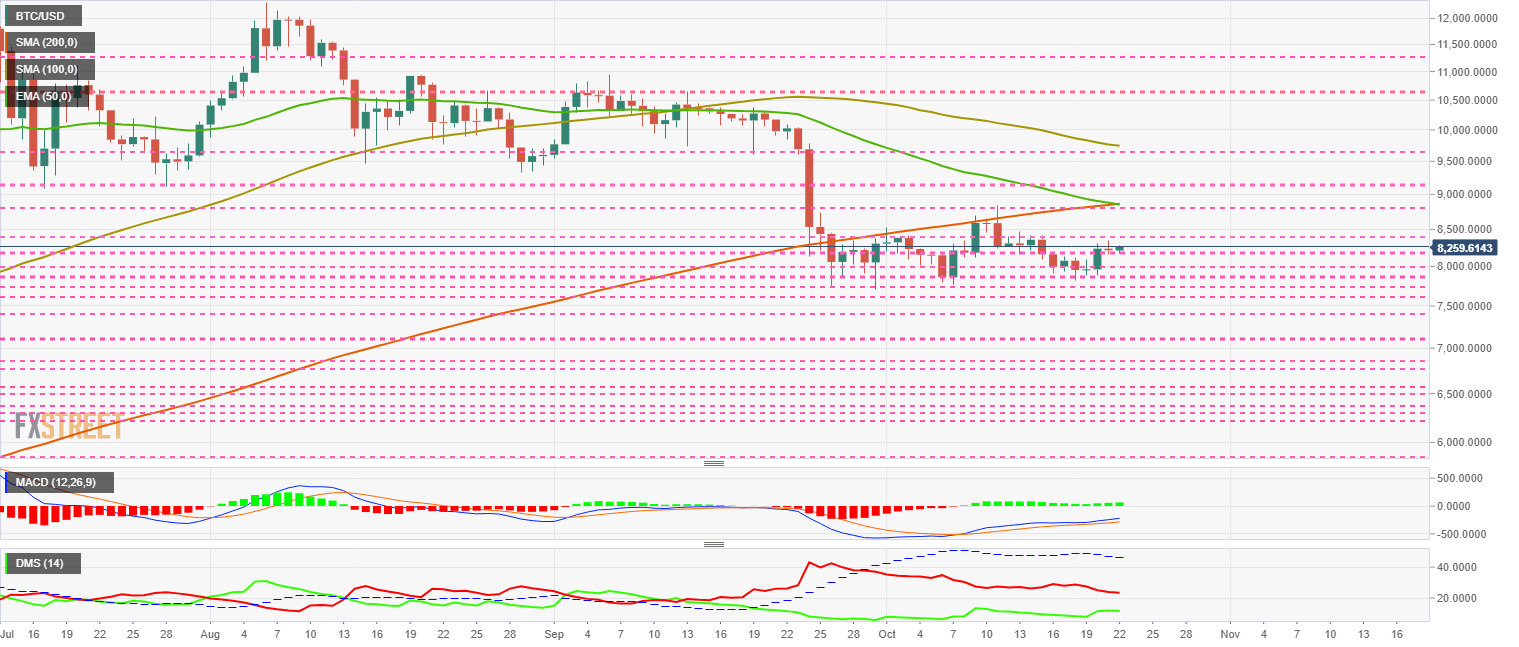
The MACD on the daily chart shows a bullish profile with a little opening between the lines. This configuration supports continued bullishness but with a limited momentum.
The DMI on the daily chart shows bears steadily dominating the price. The bulls do not show any recent changes in strength either.
ETH/USD Daily Chart
ETH/USD is currently trading at $174.4 and remains in the middle of the new price range.
Above the current price, the first resistance level is at $180, then the second at $185 and the third one at $190. As we can see, the bullish scenario is within the range of the ETH/UDS pair.
Below the current price, the first level of support is at $170, then the second at $161 and the third one at $155.
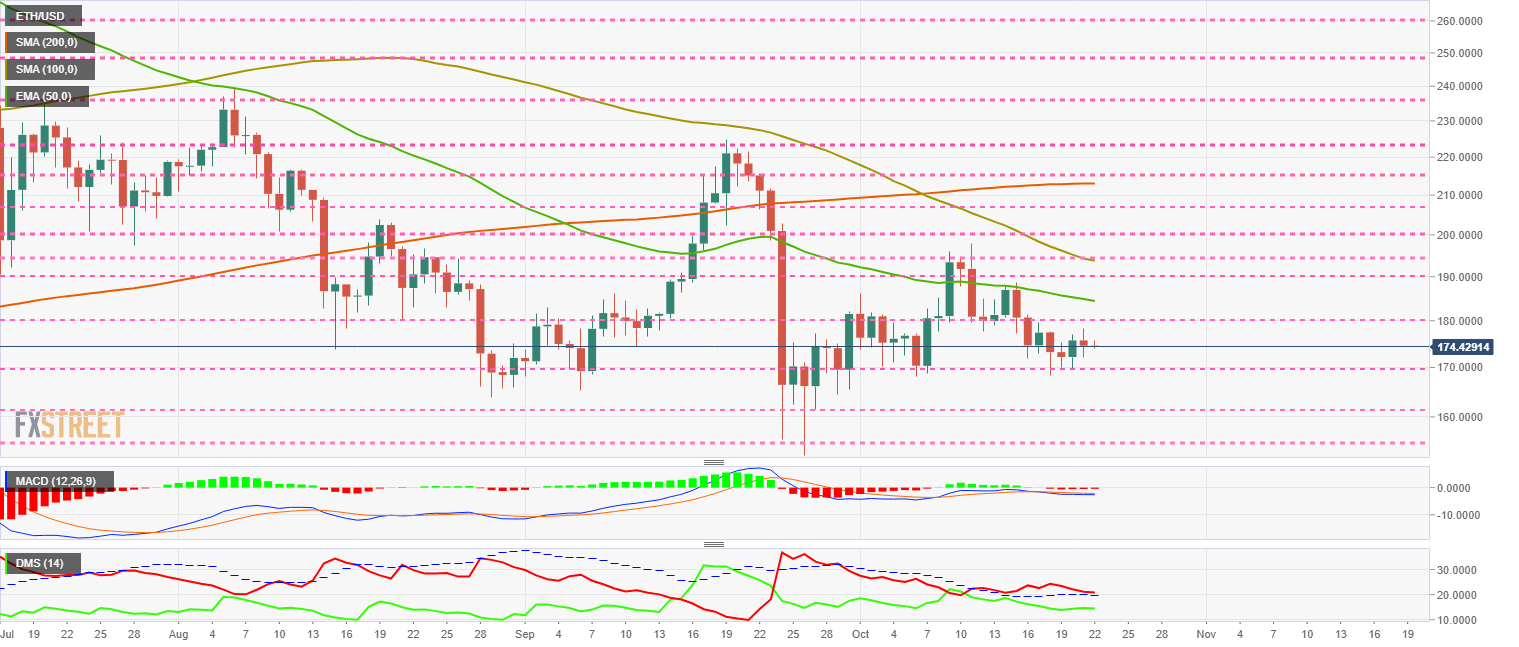
The MACD on the daily chart continues to be stuck at the zero levels on the downside. The profile is slightly bearish but barely open between the lines, highlighting the absence of clear direction.
The DMI on the daily chart shows bears stuck to the ADX line that supports it. If they lose this support, we could see significant price increases. In case of holding the level, the bears could see a new bearish phase.
XRP/USD Daily Chart
XRP/USD is currently trading at $0.2969 after a first attempt in Asian trading to break above the $0.30 level. The main target is $0.33 where the SMA200 awaits Ripple’s token.
Among the top three of the crypto board, XRP is the only one that we can consider to be in the bullish phase in the short term.
Above the current price, the first resistance level is at $0.30, then the second at $0.31 and the third one at $0.32.
Below the current price, the first support level is at $0.293, then the second at $0.29 and the third one at $0.283 as the most solid with the confluence of the SMA100 and the EMA50.
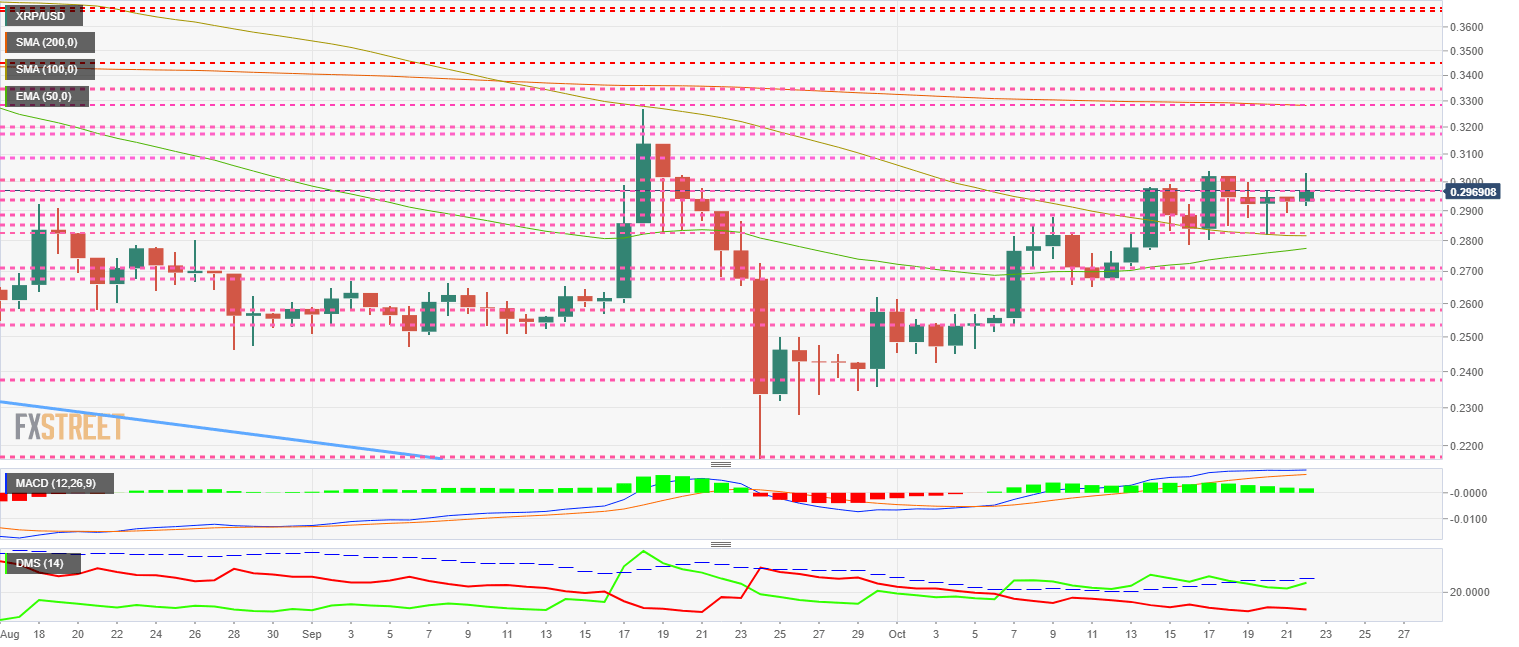
The MACD on the daily chart shows a loss of openness between the lines, reflecting the loss of momentum. The slope continues to rise.
The DMI on the daily chart shows the bulls trying to pass the ADX line again. If it doesn't, we could see a radical change in momentum and the bears would enter the game again.
Get 24/7 Crypto updates in our social media channels: Give us a follow at @FXSCrypto and our FXStreet Crypto Trading Telegram channel
Author

Tomas Salles
FXStreet
Tomàs Sallés was born in Barcelona in 1972, he is a certified technical analyst after having completing specialized courses in Spain and Switzerland. He expanded his technical training following the guidance of great experts on the financial markets.


