Top 3 price prediction BTC, ETH, XRP: Building on future profits
- Main pairs consolidate in the center of the price range.
- XRP is better placed and must lead the next upward trend.
- Predictable increase in volatility is due to the clash between bulls and bears.

The trading week is kicking off with a continuation of the last week's scenario.
The consolidation process continues and deepens, especially in the relationship between Ethereum and Bitcoin.
After ETH/BTC’s brilliant rise from the lows, it was time to consolidate the gains.
Market tempos are not only conditioned by the correlation of crypto activities with fiat currencies but the interrelation and the struggle for market dominance that also exerts a strong influence.
It is this last indicator that is now penalizing the market.
ETH/BTC Daily Chart
ETH/BTC is currently trading at the price level of 0.02113 and is looking for support at the EMA50 at 0.021. The cumulative decline from the cycle highs – remained at 0.023 – is above 10%.
The technical structure shows healthy and logical development. The reasonable projection for the next few days is for a bearish side, with a second support level at 0.020 where the SMA100 passes. Below this second level of support, the third one is at 0.020, where the bullish movement would be in danger of being interrupted.
On the bullish side, resistance levels are at 0.022 and then 0.023. The third resistance level for the ETH/BTC part is not so bright and could be at 0.025 - the level traversed by the SMA200.
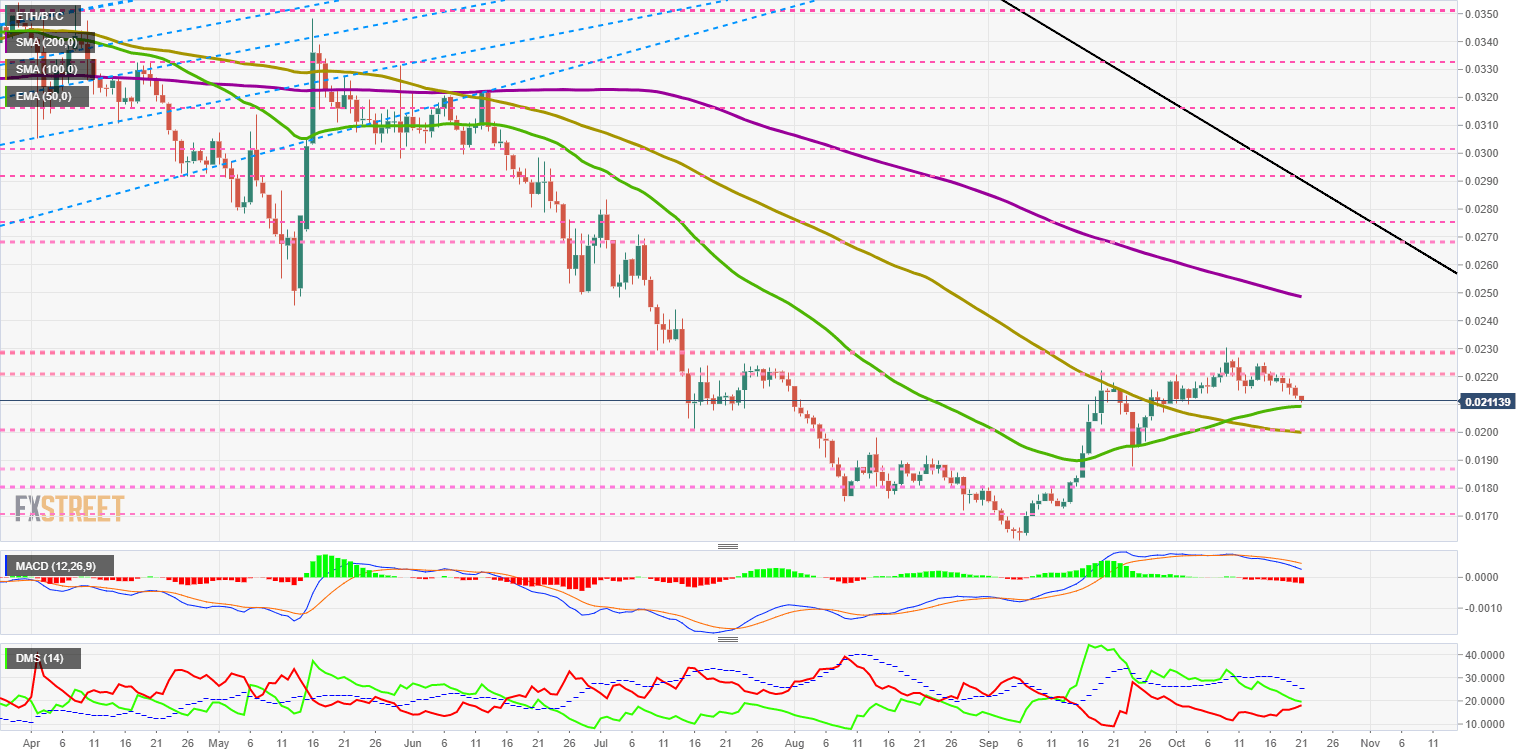
The MACD on the daily chart opens and clearly shows an acceleration in the bearish trend. Soon we will reach the support provided by the zero levels, where we will see the future scope of the move.
The DMI on the daily chart shows how the two sides of the market are about to collide. The shock will undoubtedly lead to increased volatility.
BTC/USD Daily Chart
BTC/USD is currently trading at $8,220 and returns to the intermediate level of the $7,900 to $8,600 range. There is no clear catalyst for this bullish move.
Above the current price, the first resistance level is at $8,400, then the second at $8,800 and the third one at $9,125.
Below the current price, the first support level is at $8,000, then the second at $7,900 and the third one at $7,750.
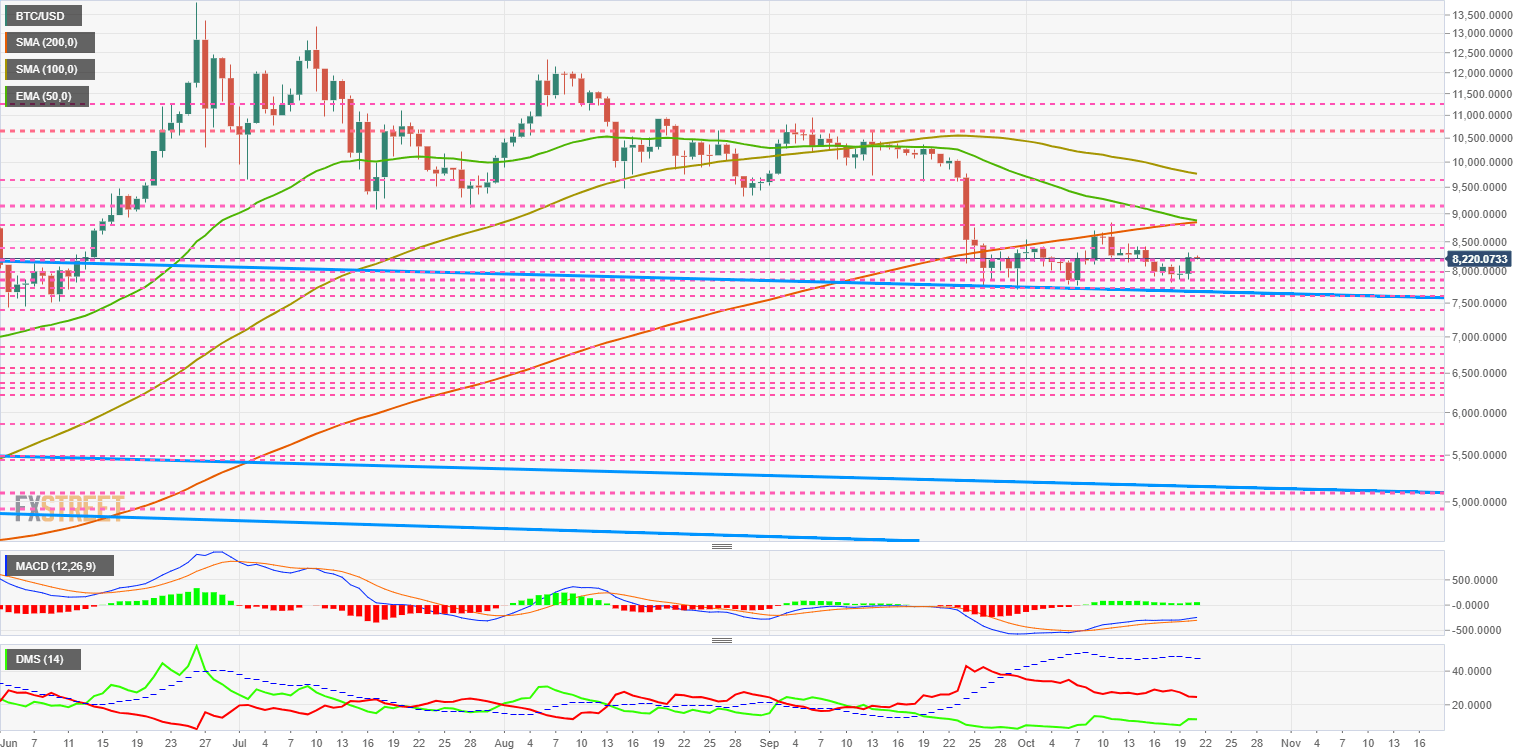
The MACD on the daily chart shows how the lines separate again and adopt a structure that would facilitate a new bullish momentum.
The DMI on the daily chart shows how the bulls increase their strength throughout the consolidation process as the bears lose it. It is a favorable structure for the price.
ETH/USD Daily Chart
ETH/USD is currently trading at the $174.22 price level and is now in the price middle zone of this entire consolidation process.
Above the current price, the first resistance level is at $180, then the second at $185 and the third one at $190.
Below the current price, the first support level is at $170, then the second at $160 and the third one at $155.
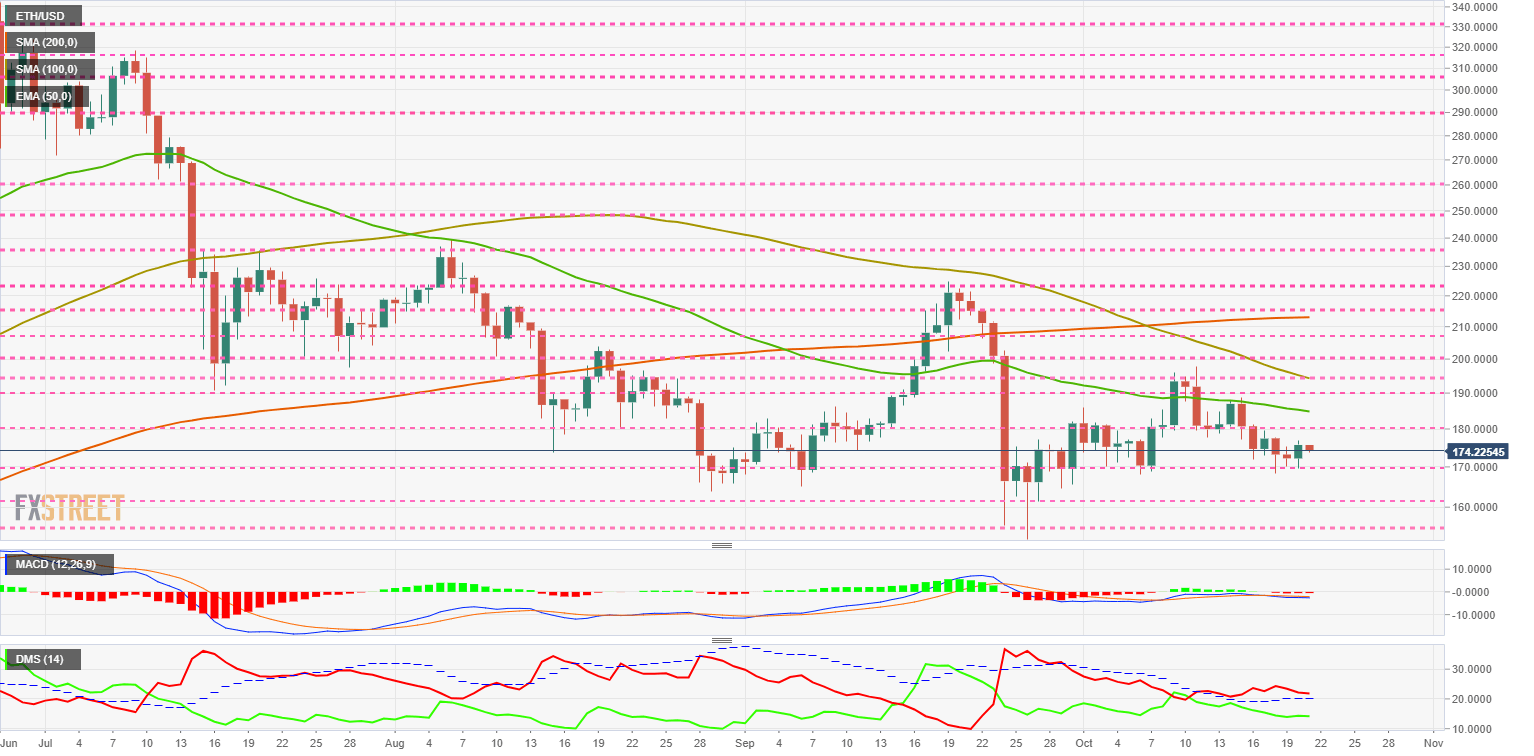
The MACD on the daily chart confirms the price weakness. Moving averages are shown to be unable to break above the 0 levels and insinuate an incursion into more negative zones.
The DMI on the daily chart shows bears above the ADX line. This structure indicates a high probability of bearish continuity. The bulls do not give up and maintain a level similar to the one they had at the end of last week.
XRP/USD Daily Chart
XRP/USD is currently trading at $0.2913 and is the only one among the top three cryptos that remains above the short term moving averages.
Above the current price, the first resistance level is at $0.2936, then the second at $0.297 and the third one at $0.300.
Below the current price, the first support level is at $0.288, then the second at $0.285 and the third one at $0.282.
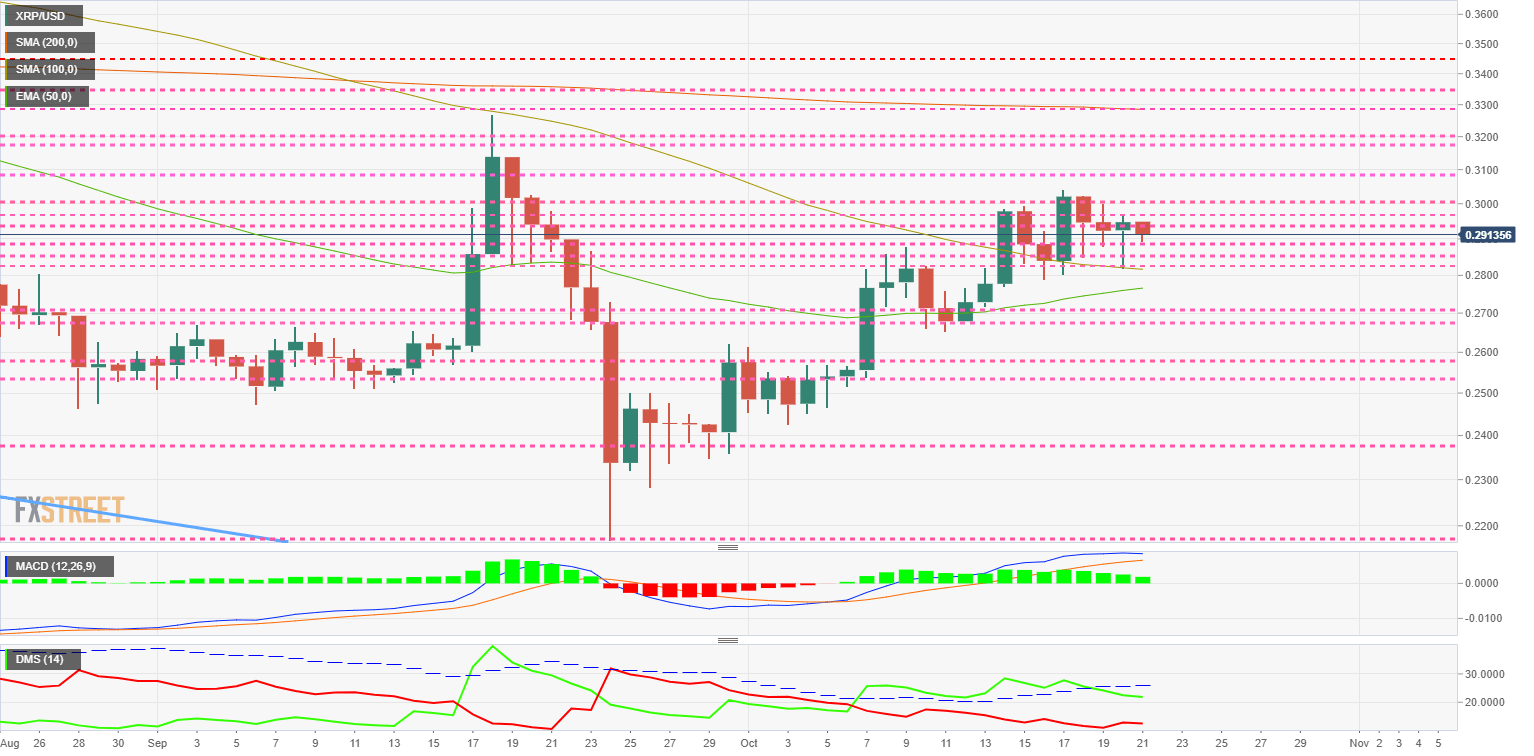
The MACD on the daily chart shows the loss of strength in the bullish trend that began at the end of September. It seems clear that in the next few days, the movement will be downward with increased volatility.
The DMI on the daily chart shows that the bulls are losing support for the ADX line, although the bears do not see it so clearly and are waiting for the moment.
Get 24/7 Crypto updates in our social media channels: Give us a follow at @FXSCrypto and our FXStreet Crypto Trading Telegram channel
Author

Tomas Salles
FXStreet
Tomàs Sallés was born in Barcelona in 1972, he is a certified technical analyst after having completing specialized courses in Spain and Switzerland. He expanded his technical training following the guidance of great experts on the financial markets.


