Top 3 Price Prediction Bitcoin, Ripple, Ethereum: Trend under construction, sorry for any inconvenience
- Weakness in prices after sharp rises.
- The underlying trend remains strong.

The universe of Cryptocurrencies comes back to life after months of winter prices and with it comes the interest of the less specialized media. Where until a few days ago there was silence and mistrust, now discreet questions about the possibility of seeing prices again at levels of December 2017 begin to appear.
It is impossible to say with certainty if this is going to happen, but the theory tells us that it is most likely to happen. Moreover, once those historical highs are reached, the market would decide whether to stay there and define a closed ecosystem for the price or continue to rise and expand the capacity to accumulate capital.
ETH/BTC 240 Minute Chart
The ETH/BTC pair continues to be the best treasure map currently available. There is no other chart in the framework of pure technical analysis that condenses so much information and is so clear.
This graph shows us how it is now when the Cryptocurrencies market is mutated back to bullish mode, completing the retreat from the peaks of the first tranche to the rise during the first week of the year.
An intermediate parallel trend line supports the ETH/BTC pair within the current technical framework. The pair is currently trading at the price level of 0.0322.
Above the current price, the first resistance level is at 0.0333 (price congestion resistance and upper parallel trendline). The second resistance level is at 0.035 (price congestion resistance and parallel bullish trendline), and the third resistance level for the ETH/BTC pair is at 0.0363 (parallel bullish trendline).
Below the current price, the first support level for the ETH/BTC pair is at 0.0321 (lower parallel bullish trend line). Then the second support level is at 0.0316 (price congestion support), and the third support level is at 0.0301 (price congestion support).
-636899732850898523.png)
The MACD on the 4-hour chart shows a typical price change direction structure. The sequence is as follows: first crossing attempt, rejection, second more or less clean crossing attempt and success. The model continues to be favorable to an upward movement.
The DMI on the 4-hour chart shows us how bears resist releasing the Ethereum and embracing the Bitcoin. The bulls remain above level 20 and have already fulfilled the pattern of a first attempt to cross up the ADX line, so if the bull attack is unleashed, the chances of victory are high.
Do you want to know more about my technical setup?
BTC/USD 240 Minute Chart
The BTC/USD pair is currently trading at $4.950 after leaving the Asian session high of $5,347 and failing to hold above the price congestion level of $5,100. Moving averages continue to be very inclined towards the upside and with much separation between them, which supports the continuation of the upside although with an increase in volatility.
Above the current price, the first resistance level at $5,100 (price congestion resistance), then the second resistance level for the BTC/USD pair is at $5,500 (price congestion resistance). The third resistance level is the most important of all. It is a robust confluence located between $6,300 and $6,500 with three price congestion resistances.
Below the current price, the first support level for the BTC/USD pair is at the price level of $4,550 (price congestion support), then a second support level at $4,430 (EMA50). The third level of support is at $4,200 (price congestion support and SMA100).
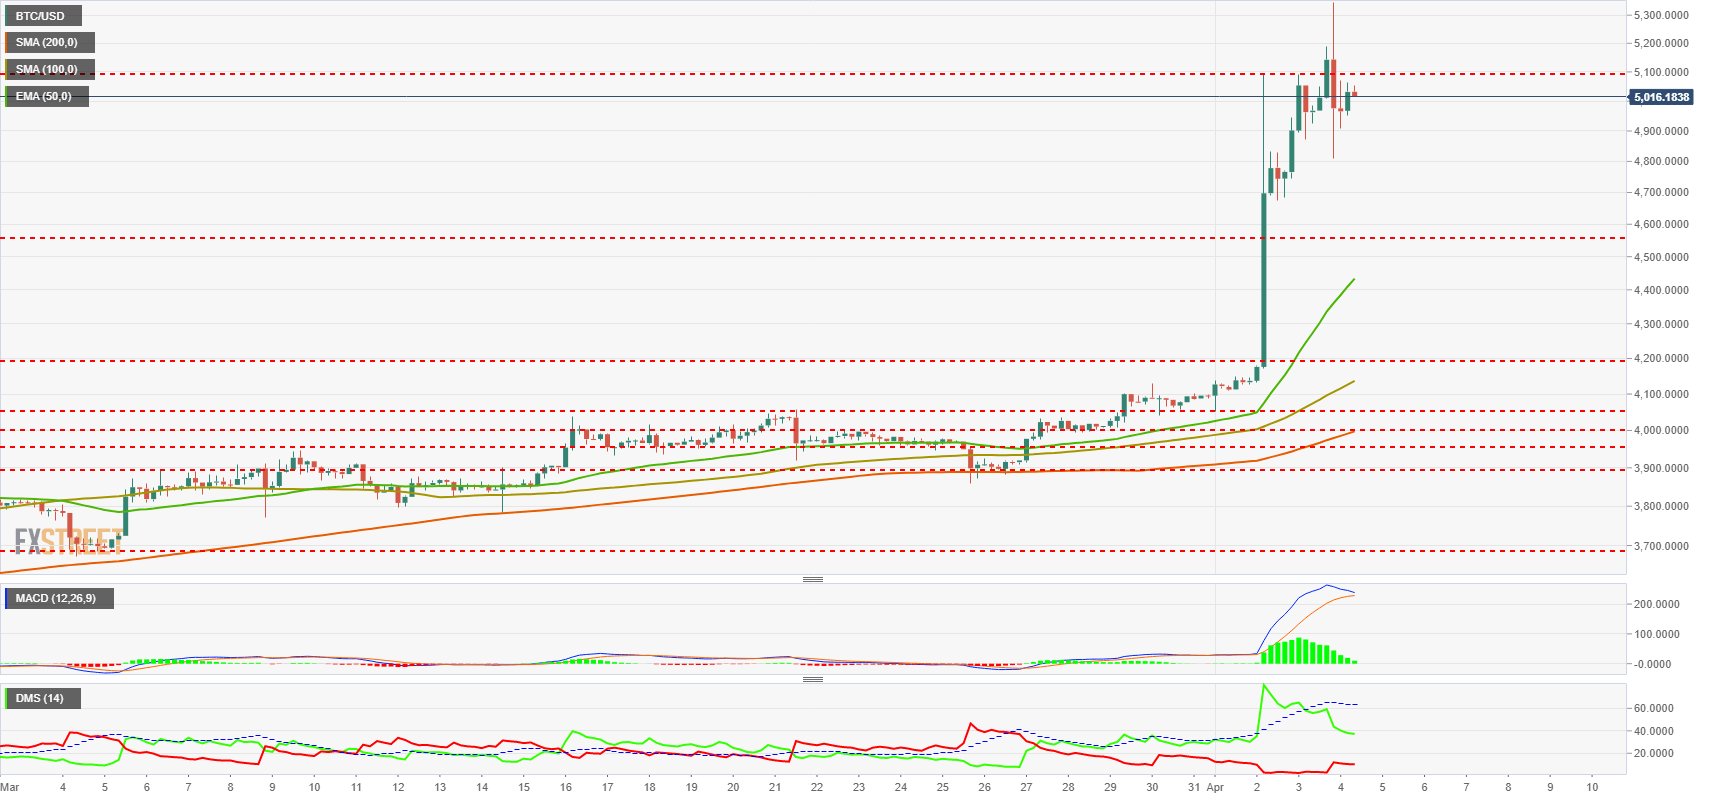
The MACD on the 4-hour chart shows an exhaustion profile but carries so much inertia that it resists crossing down. It proposes a side with a strong underlying bullish force.
The DMI on the 4-hour chart shows us how the bears do not believe that this rise is over and remain at minimum levels. The bulls lose the excessive levels reached and will probably go up again to try to overcome the ADX line again. They will probably fail.
ETH/USD 240 Minute Chart
The ETH/USD is currently trading at $160 after reaching the price congestion resistance at the $180 level. For now, it remains above the price congestion support at $162.
Above the current price, the first resistance level is at $180 (price congestion resistance). So the second resistance level is at $200 (price congestion resistance) and the third resistance level for the ETH/USD pair is at $215 (price congestion resistance).
Below the current price, the first support level is at $162 (price congestion support), then the second support level is at $150 (price congestion support and EMA50). The third level of support for the ETH/USD pair is at $142 (price congestion support, SMA100, and SMA200).
-636899734375621383.png)
The MACD on the 4-hour chart shows a bearish cross profile that the price is ignoring for now. A bullish rejection that would push the price to higher levels cannot be ruled out.
The DMI on the 4-hour chart shows us how the bears take for granted the level reached and increase their activity without overtaking the bulls. The bullish side of the market seems to agree and is withdrawing although it maintains control of the market.
XRP/USD 240 Minute Chart
The XRP/USD is currently trading at the $0.338 price level after leaving a relative high of $0.378. The decline has led to price congestion support at $0.328 (price congestion support).
Above the current price, the first resistance level is at $0.367 (price congestion resistance), then the second resistance level is at $0.39 (price congestion resistance), and the third resistance level for the XRP/USD pair is at $0.43 (price congestion resistance).
Below the current price, the first support level is $0.335 (price congestion support), then the second support level is $0.328 (price congestion support and EMA50) and the third support level in the XRP/USD pair is $0.318 (price congestion support, SMA100, and SMA200).
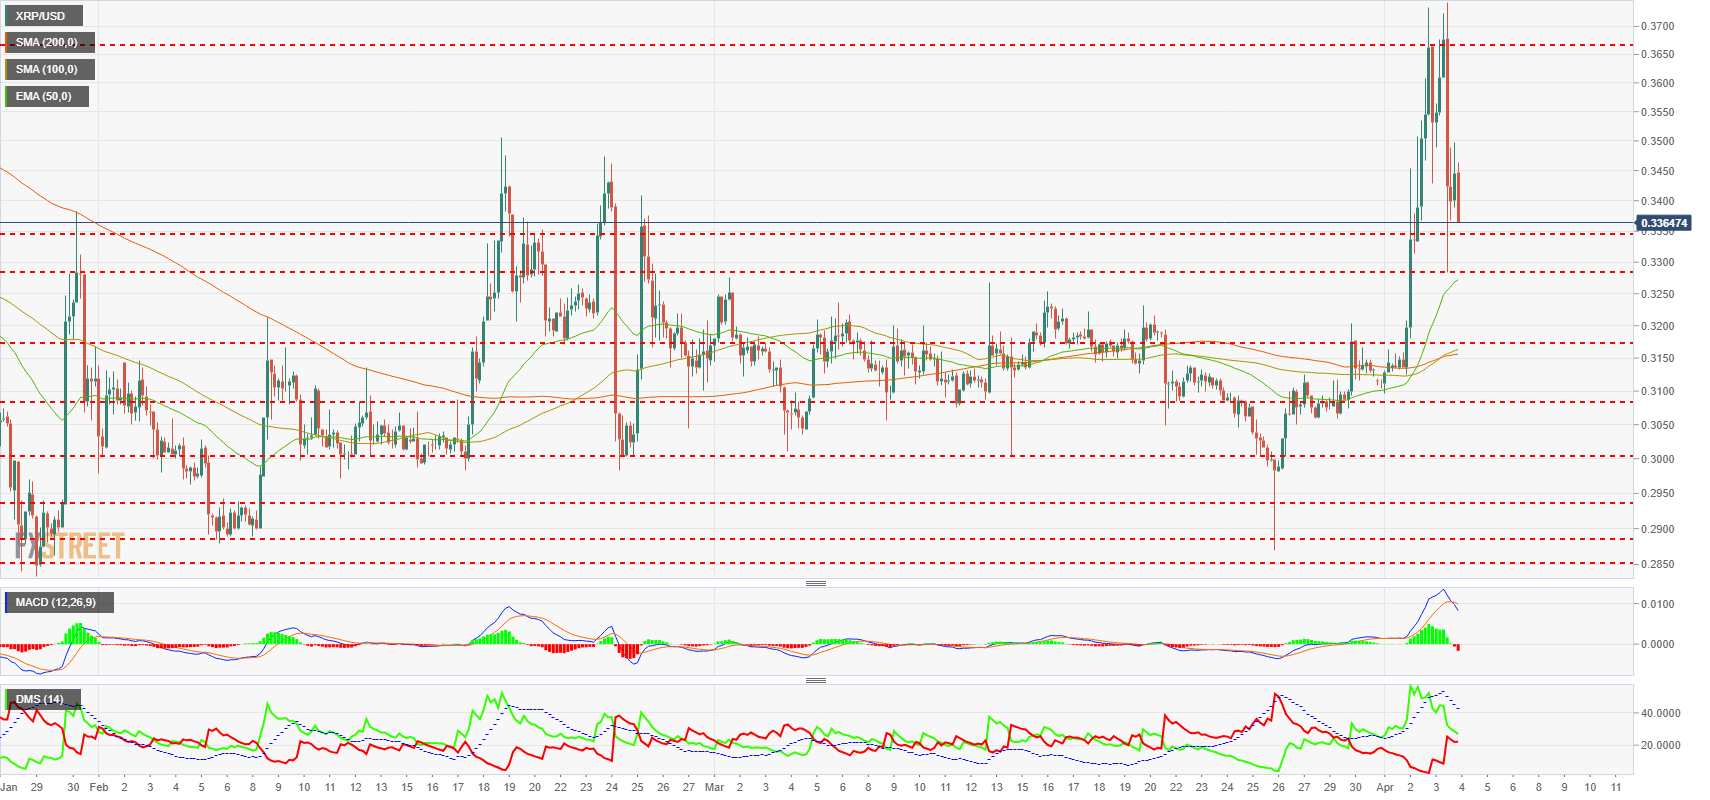
The MACD on the 4-hour chart shows the cross lines falling and reflects in the amplitude of the reversals.
The DMI on the 4-hour chart shows bears trying to take control of the situation while the bulls relax a lot and lose the big advantage they had. The most common pattern indicates a second attempt by the bulls to get above the ADX line, an effort that usually fails.
Author

Tomas Salles
FXStreet
Tomàs Sallés was born in Barcelona in 1972, he is a certified technical analyst after having completing specialized courses in Spain and Switzerland. He expanded his technical training following the guidance of great experts on the financial markets.


