Top 3 Price Prediction Bitcoin, Ripple, Ethereum: The epic battle to breach the wall is a slow-motion game
- The market is technically bullish but only by a few dollars without anything conclusive.
- Ethereum has made its second attempt to jump to $290.
- XRP plays another game but does not lose sight of the King.

In the article published yesterday, I have highlighted a potential window of opportunity to an upward movement that would take the three main protagonists of the Crypto market to higher prices.
The bullish escape attempt has begun late in the European session and remains prevalent now. The stakes could not be higher – the end of the crypto winter is at play.
After more than 18 months of substantial falls – typical to this market – and of some increases that have taken prices to 50% of the historical maximums, the future can be decided today.
It is not the first attempt of the bulls to send the bears to the cave. The first has occurred between May 26 and June 3 and miserably failed. The bears defended themselves well – prolonging the winter and burying any signs of spring.
The second attempt to enter the warm season has kicked off on Wednesday – and for now – has succeeded, but only just. BTC/USD tops the upper trend line of the long term downward channel by a mere $3 – a considerably fragile and unstable situation.
Bitcoin’s rise above this line is the first condition for declaring an end of Cryptowinter. The second condition – a better relative behavior of Ethereum against Bitcoin – is still in the works. The following analysis of ETH/BTC will provide more clues.
ETH/BTC 4-Hours Chart
The ETH/BTC crypto cross is currently trading at 0.032 and is conquering the upper parallel trendline at the lower end. The move is in play and is unconfirmed at the time of writing.
A break above 0.0347 is essential to ending the cold season in cryptos.
Above the current price, the first resistance level is at 0.0332 (price congestion resistance), the second one is at 0.0338 (first upper parallel trend line) and the third one is at 0.0346 (relative highs).
Below the current price, initial support level awaits at 0.0319 (lower parallel bullish trend line), the second is at 0.0316 (price congestion support) and the third for ETH/BTC is at 0.031 (EMA50, SMA100, and SMA200), significant support.
-636960156410892787.png)
The MACD on the 4-hour chart has fully entered the positive zone of the indicator. The profile is bullish, and the opening between the lines is essential. However, the structure is very fragile and can change quickly.
The DMI on the 4-hour chart shows how bulls dominate the market against bears that assume – without hesitation – that the end of winter is near.
BTC/USD Daily Chart
BTC/USD is currently trading at $8,128 and remains just above the long term bearish channel. However, it is still too early to declare victory.
Above the current price, the first resistance level is at $8,200 (price congestion resistance), followed by $8,450 (price congestion resistance) and finally by $8,770 (price congestion resistance and relative maximum).
Below the current price, the first support level is $8,120 (long term down channel ceiling trend line), then the second support level is at $8,000 (price congestion support). The third level of support for awaits at $7,800 (price congestion support).
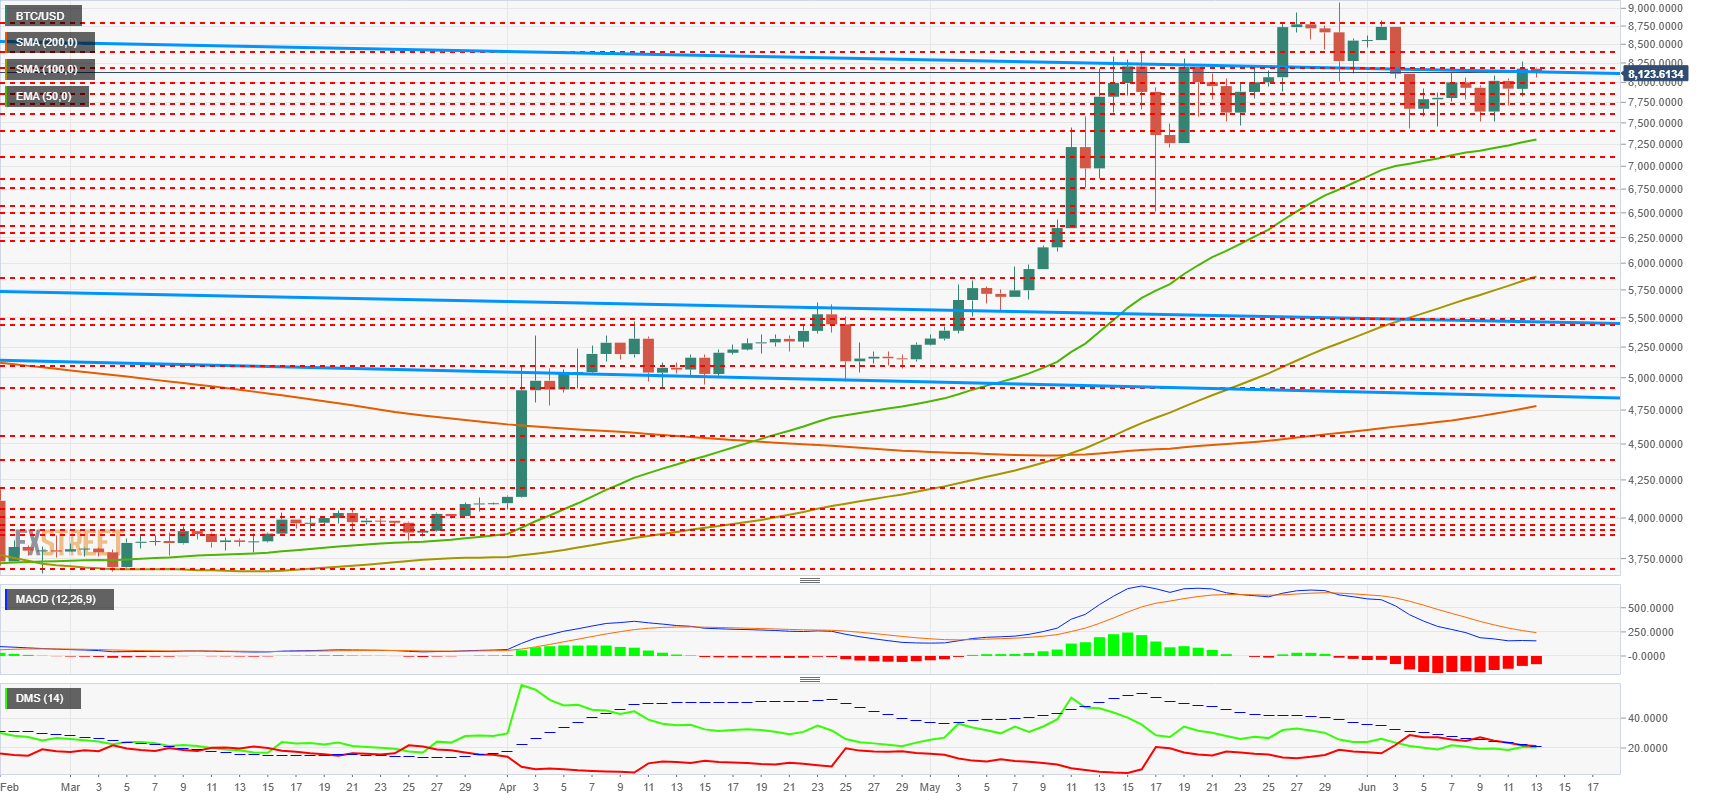
The MACD on the daily chart shows how the rally of the last few days has caused the bearish profile to decline. It is not common for the current structure to initiate a significant bullish movement.
The DMI on the daily chart shows a total tie between the two sides of the market. To increase the uncertainty of the moment, the ADX indicator moves at the same point as the D+ and D-.
ETH/USD Daily Chart
Vitalik Buterin’s creation trades at $259.4. From this point, resistance is far away at $290, a big jump and one that will require significant inflows of funds.
Above the current price, the second resistance level is at $310 (price congestion resistance). The final line is $320 (price congestion resistance).
Below the current price, the first support level is at $245 (price congestion support), the second one is $238 (price congestion support). The third level of support for Ethereum is at $222 (price congestion support and EMA50).
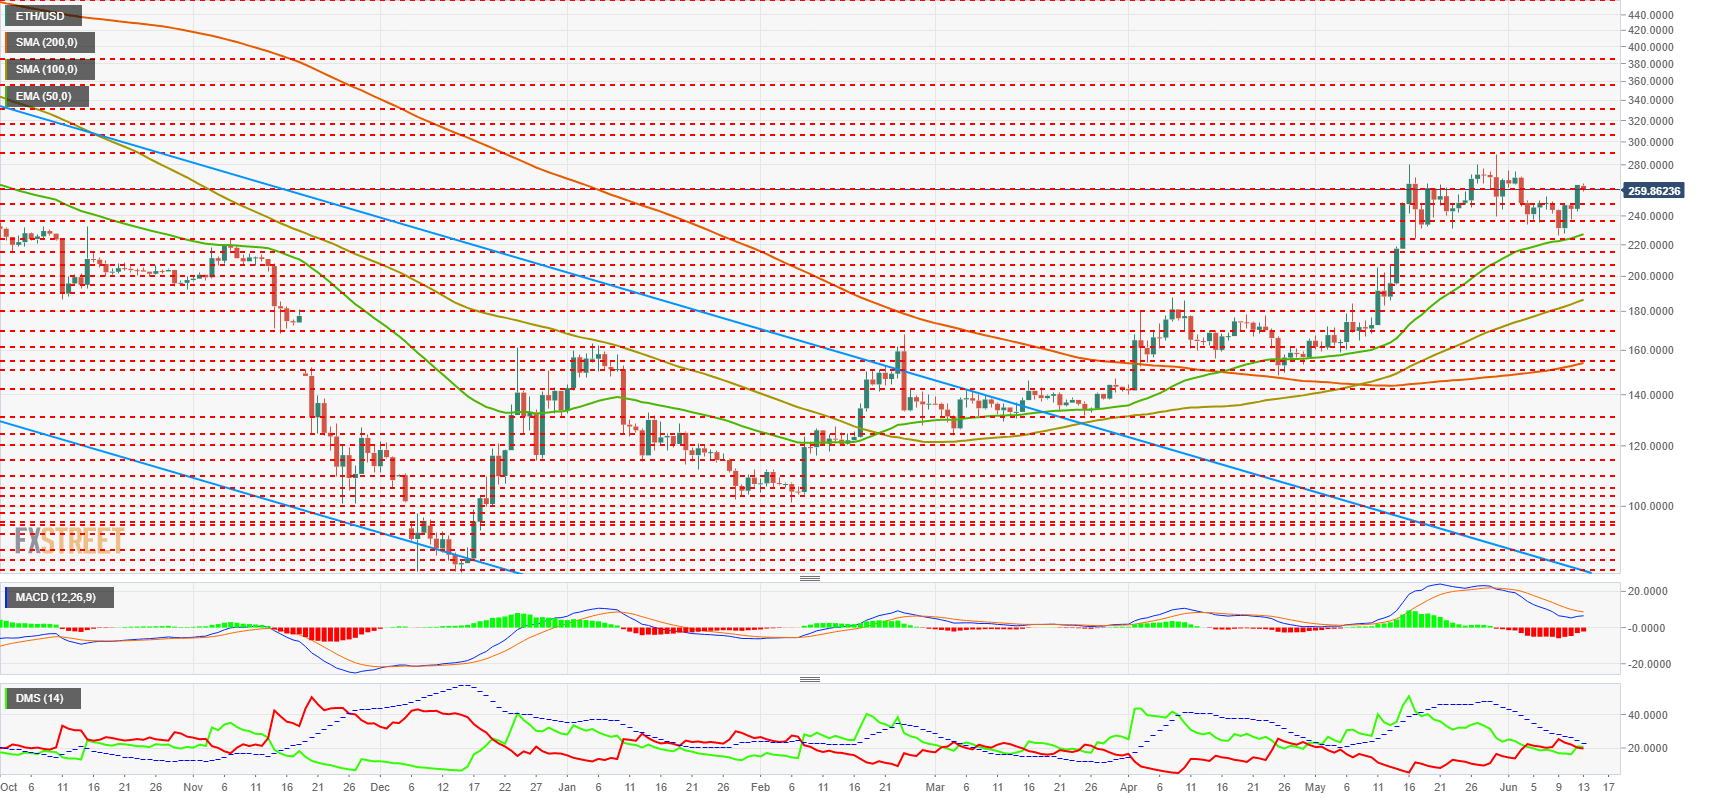
The MACD on the daily chart shows a profile that invites us to think about a possible bullish cross. From a more conservative position, it is more likely to turn down again – before heading for new relative highs.
The DMI on the daily chart shows a very similar situation between both sides of the market, although bulls have a small advantage. Both sides of the mark are below the ADX line, which will provide an extra signal as soon as one of them achieves the bullish break.
XRP/USD Daily Chart
XRP/USD is currently trading at the $0.4040 price level and continues within the flag structure.
Above the current price, the first resistance level is $0.413 (price congestion resistance), followed by $0.43 (price congestion resistance) and finally by $0.438 (price congestion resistance) – and that would mean the break up of the flag figure.
Below the current price, the first support level is $0.39 (price congestion support) and the second one is $0.382 (EMA50). The third support level for the XRP/USD pair is $0.368 (double price congestion support).
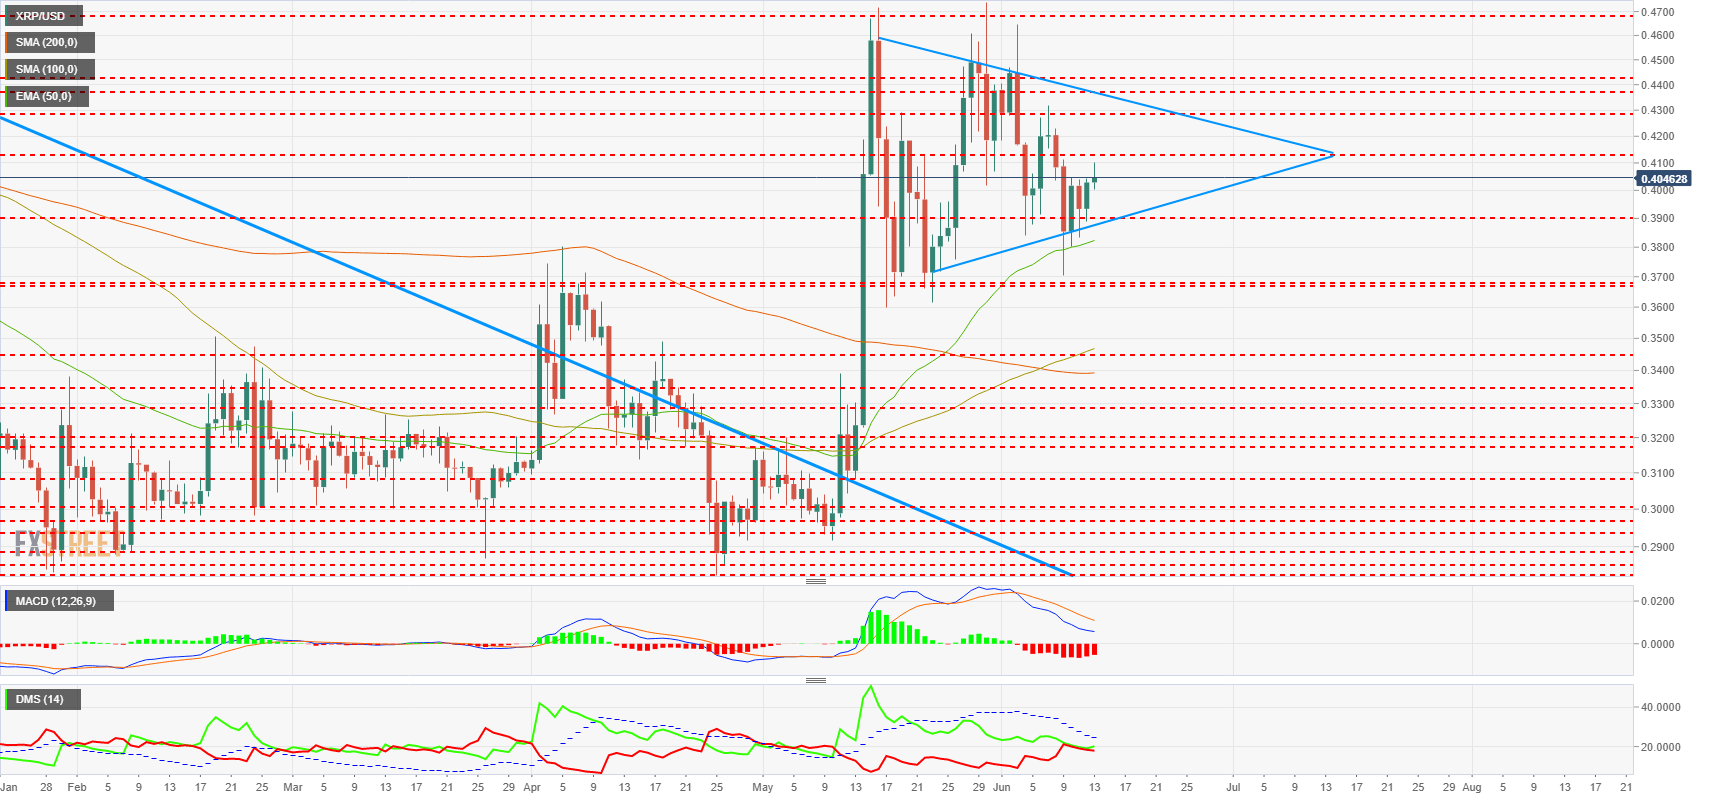
The MACD on the daily chart shows a bearish structure – both for inclination and for the opening between lines. It is surprising that with this setup, XRP/USD is not ceding any ground.
The DMI on the daily chart shows how after Wednesday’s tie between bulls and bears, the bullish side gets a small advantage over the bears today. The ADX continues to decline, typical of flag-like structures that compress the price.
Get 24/7 Crypto updates in our social media channels: Give us a follow at @FXSCrypto and our FXStreet Crypto Trading Telegram channel
Author

Tomas Salles
FXStreet
Tomàs Sallés was born in Barcelona in 1972, he is a certified technical analyst after having completing specialized courses in Spain and Switzerland. He expanded his technical training following the guidance of great experts on the financial markets.


