Top 3 Price Prediction Bitcoin, Ripple, Ethereum: Losing support and vulnerable to more sudden collapses
- Bitcoin's strength highlights Altcoins' weaknesses.
- The market needs all participants to reach the Moon.
- There's still time to avoid early autumn in this spring.

What wasn't supposed to happen is happening. The Crypto market is currently losing the upward trend that began in mid-December and is entering a completely new scenario. This new scenario lacks medium or long term upward trend lines; Therefore we are going to have to build or, in any case, recover the lost trend lines from yesterday.
If the ETH/BTC pair does not manage to build or recover the previous scenario, the future of the vast majority of Altcoins will be to progressively lose value against Bitcoin, either because the king exponentially increases its value, or because Altcoins sink their prices to derisory levels.
There is still an opportunity to turn this situation around in the next few hours, recover the last parallel uptrend line and get back into the game.
ETH/BTC 4 Hours Chart
The ETH/BTC pair on the daily chart shows how the structure of parallel bullish lines has been lost, and the pair is now resting on a level of support for price congestion that already served as support at the beginning of February.
Below the current price, the first support level is at 0.0301 (price congestion support), so the second support level for the ETH/BTC pair is at 0.029 (price congestion support). The third support level is at 0.0278 (price congestion support).
Above the current price, the first resistance level is at the parallel bullish baseline, at the price level of 0.0306. The second resistance level is at 0.0316 (price congestion resistance and upper parallel trend line). The third resistance level for the ETH/BTC pair is at 0.0332 (price congestion resistance and upper parallel trendline).
-636916980092889630.png)
The MACD on the daily chart opens slightly lower and dramatically increases the chances of a downward movement in the medium term that will significantly damage Altcoins' valuations against Bitcoin.
The DMI on the daily chart shows the bears are rising while sending the bulls to shallow levels, cutting down the ADX line. The structure is strongly bearish for Ethereum.
BTC/USD 4 Hour Chart
The BTC/USD pair is currently trading at the $5,478 price level, narrowly losing support for price congestion at $5,500. The loss of the bullish momentum in the ETH/BTC pair also negatively affects Bitcoin, as the leading pair in the Crypto market indicates the overall health of the market.
Below the current price, the first support level is at $5,328 (EMA50), then the second support level is at $5,225 (price congestion support). The third level for BTC/USD is $5,100 (price congestion support).
Above the current price, the first resistance level is at $5,500 (price congestion resistance), then the second one is at $5,900 (price congestion resistance) and the third resistance level for BTC/USD is at $6,300 (price congestion resistance).
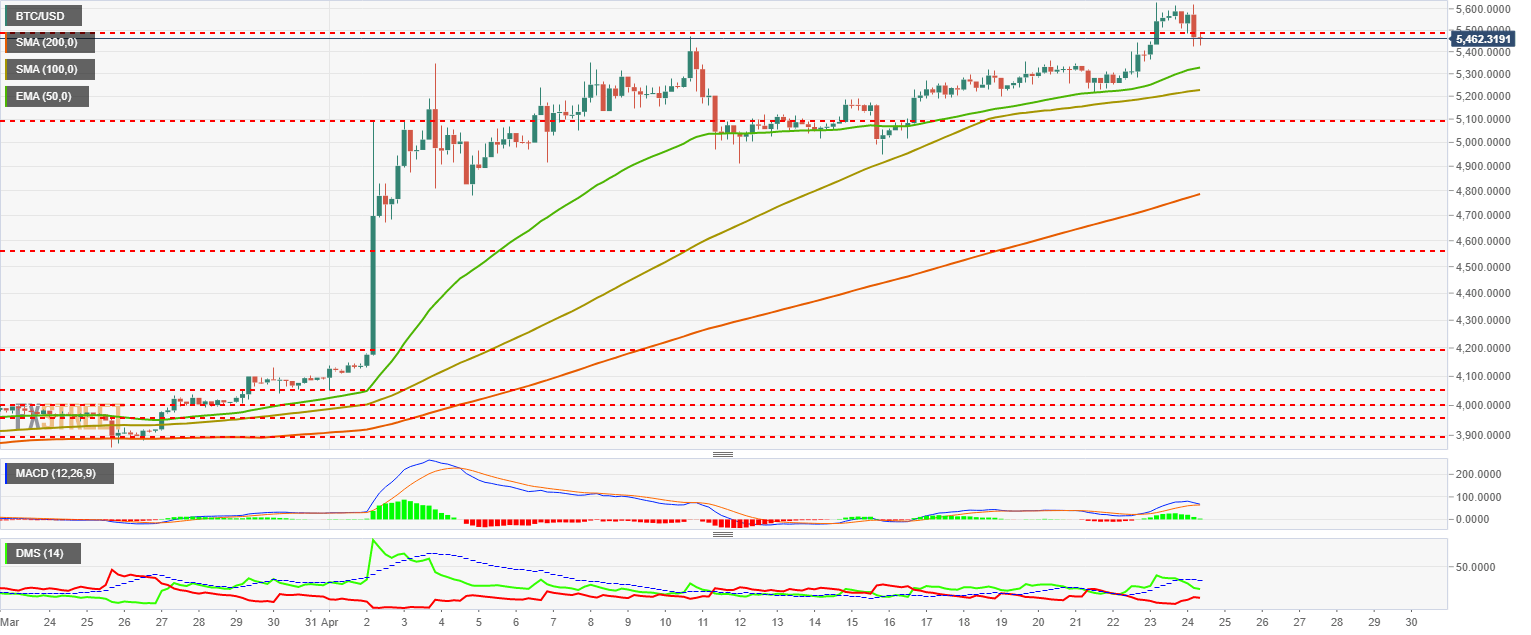
The MACD on the four-hour chart shows how after the rise from $5,100 to $5,300 the indicator remained horizontal, but in this last tranche from $5,300 to $5,600 the indicator has accelerated and is now predisposed to cross downwards.
The DMI on the four-hour chart shows bulls losing strength and getting below the ADX line, which complicates the bullish development. The bears react to the rise and get very close to the current level of the bulls. It proposes a scenario of bearish laterality and increased volatility.
ETH/USD 4 Hour Chart
The ETH/USD is currently trading at the $164.3 price level after losing the support provided by the EMA50 and the SMA100 at $172.
Below the current price, the first support level is at $161 (price congestion support), then the second support level is at $158 (SMA200) and the third support level for the ETH/USD pair is at $151 (price congestion support).
Above the current price, the first resistance level is at $170 (EMA50 and SMA100), then the second resistance level is at $180 (price congestion resistance) and the third resistance level in the ETH/USD pair is at $190 (price congestion resistance).
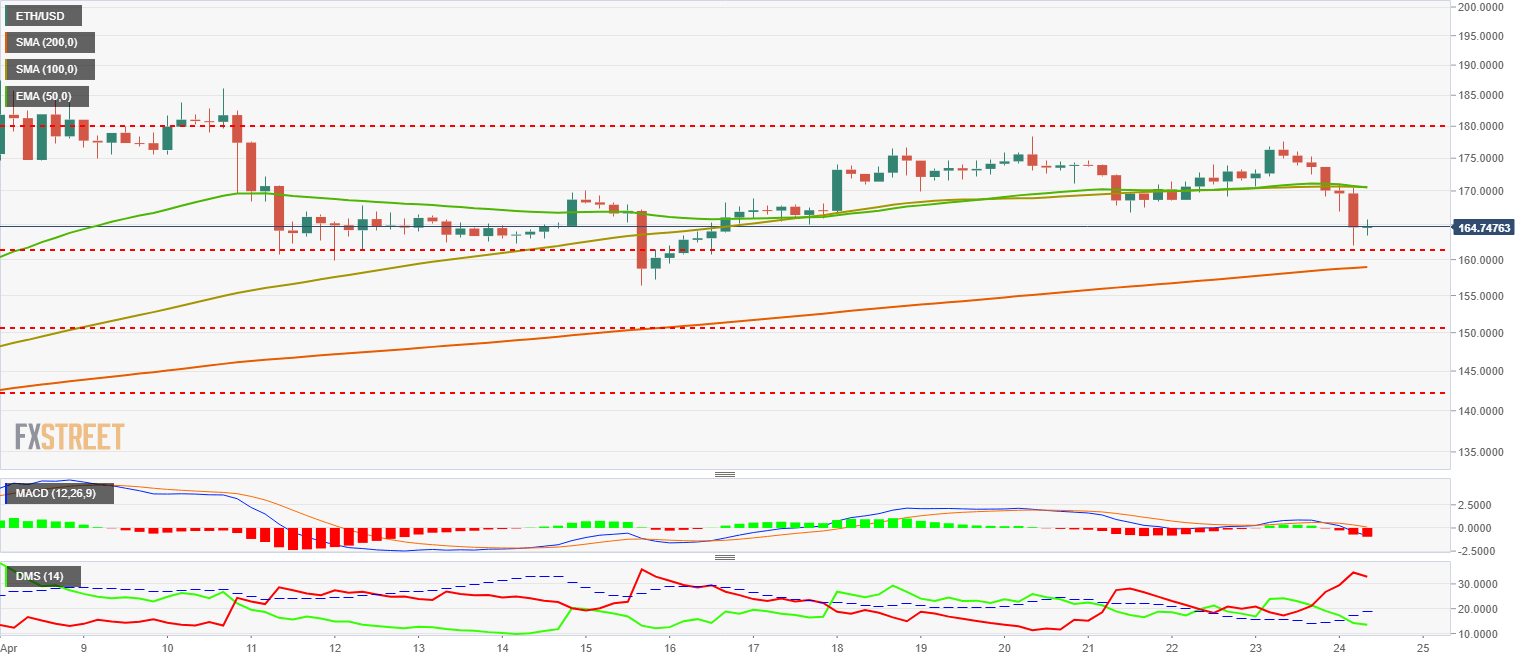
The MACD on the four-hour chart crosses firmly downward and crosses the 0 levels of the indicator with ease. By tilting and opening between lines, the movement can be deep and lasting.
The DMI on the four-hour chart shows bears dominating the market and even reaching exceptional levels. On the other hand, the bulls lose the fight and are dropped below the ADX line. The most likely scenario is of bearish continuity.
XRP/USD 4 Hour Chart
The XRP/USD is currently trading at the $0.299 price level, after falling dramatically at the end of the Asian session. The strength of the decline has reached levels not seen since last November.
Below the current price, the first support level is $0.293 (price congestion support), then the second support level is $0.288 (price congestion support). The third level of support for the XRP/USD pair is $0.285 (price congestion support).
Above the current price, the first resistance level is $0.30 (price congestion resistance), then the second resistance level is $0.308 (price congestion resistance). The third resistance level is at $0.317 (price congestion resistance).
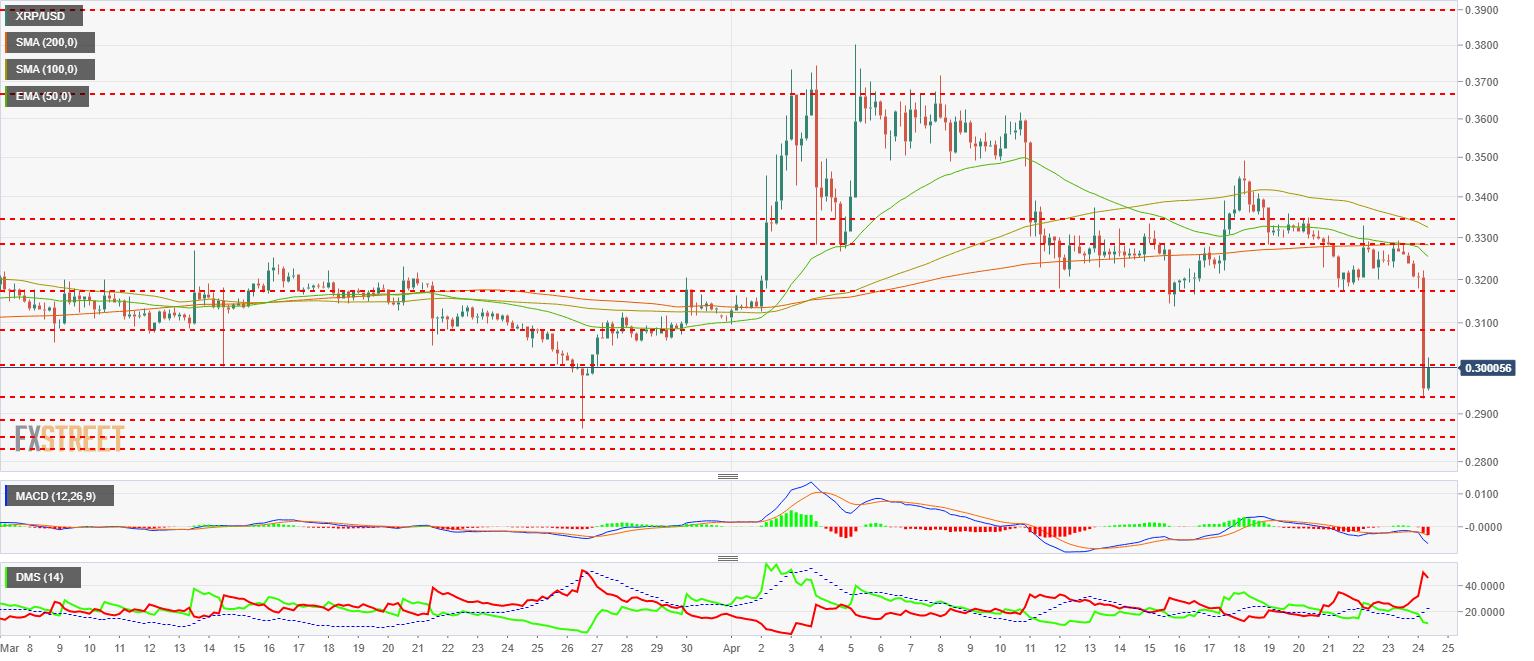
The MACD on the four-hour chart is rotating downward with strong inclination and openness. It is an aggressive move and may trigger a counter movement, but the bottom of the market is negative in the next few days.
The DMI on the four-hour chart shows bears dominating the market strongly, reaching levels not seen since last November. The bulls on the other hand sink and pierce the ADX line. The most likely scenario is the continuation of the bearish movement.
Get 24/7 Crypto updates in our social media channels: Give us a follow at @FXSCrypto and our FXStreet Crypto Trading Telegram channel
Author

Tomas Salles
FXStreet
Tomàs Sallés was born in Barcelona in 1972, he is a certified technical analyst after having completing specialized courses in Spain and Switzerland. He expanded his technical training following the guidance of great experts on the financial markets.


