Top 3 price prediction Bitcoin, Ripple, Ethereum: Ethereum points to the Moon as Bitcoin takes a break
- ETH/USD exceeds $220 and is bidding to lead the market.
- Bitcoin sets a bear trap and recaptures $10,000.
- XRP stalls between technical levels and fails to consolidate $0.30.

Arriving at the end of the week, we can say that what has happened in the last days will mark the last quarter of the year for the cryptocurrencies market.
The most important news is the upward movement of Ethereum, both against USD and Bitcoin.
The surge of the leader of the Altcoin segment has dragged with it other components of the Top Altcoin list. The most prominent is Stellar Lumens, Cardano, Tron, and IOTA. On the other hand, EOS and Ethereum Classic have lost courage and the upward pace of this start of the Altcoins season.
For next week, the most exciting event on the calendar is the meeting between members of Congress and the SEC to speak. They will discuss, among other things, Libra, Bitcoin and the need to further regulate cryptocurrencies business to be able to open the doors to the great exchange platforms. It is scheduled for Tuesday the 24.
In the short term, the news is in Bitcoin, which went out to hunt bears at the last minute on Thursday and dragged them over $10,150 again.
ETH/BTC Daily Chart
The ETH/BTC cross is trading at 0.0214 and is down at the beginning of the European session. It averaged 100 periods on the daily chart on Thursday, and it seems that the time may have come for a short break.
Above the current price, the first resistance level is at 0.0217, then the second at 0.0229 and the third one at 0.027.
Below the current price, the first support level is at 0.0201, then the second at 0.0193 and the third one at 0.0186.
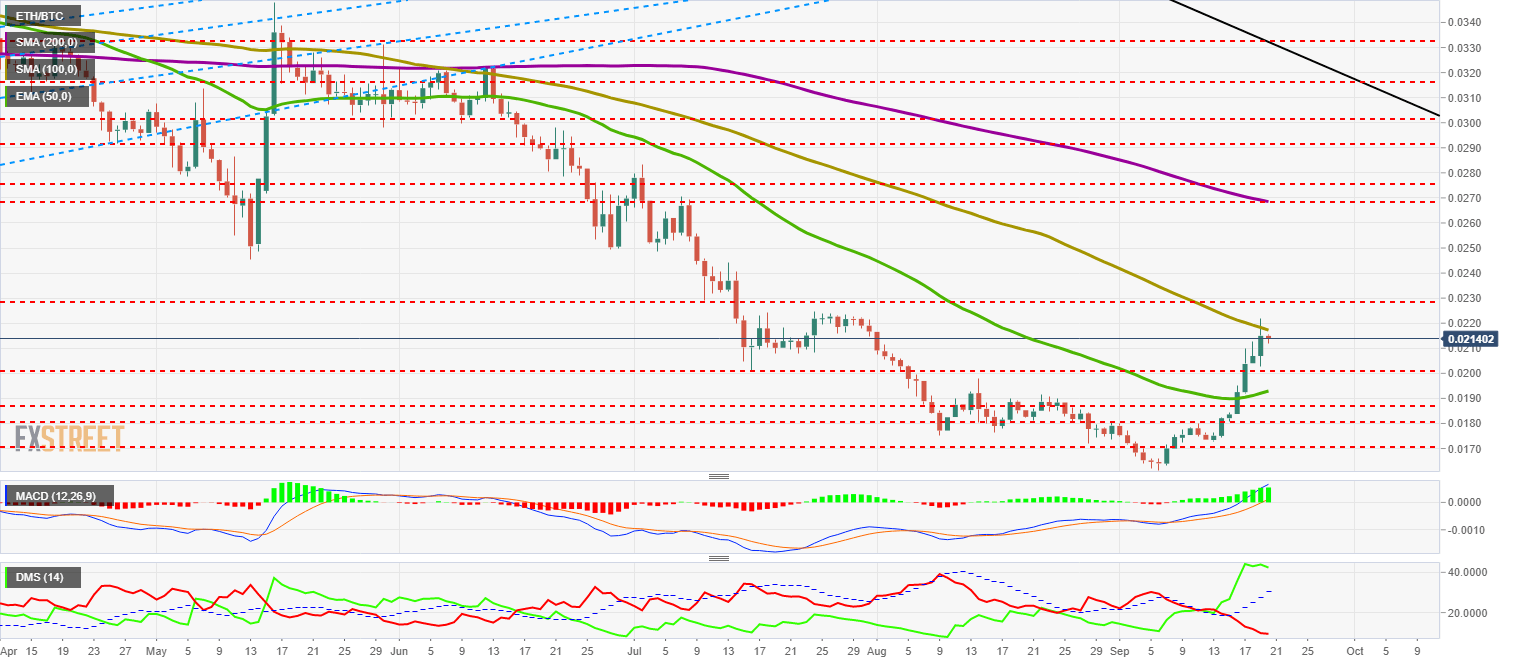
The MACD on the daily chart further boosts the bullish profile and proposes new highs for the next few days. The only negative point is an extremely bullish setup that can cause some bearish movement against it.
The DMI on the daily chart shows the bulls at recent cycle highs. It seems to have reached a technical ceiling, so sales possibilities are increasing. Bears continue to retreat and move at lows unseen in many months.
BTC/USD Daily Chart
BTC/USD is at $10,144 and enjoys Thursday’s late hour rally. In less than an hour, Bitcoin recovered to the $10,000 level and made life very difficult for bears lurking around $8,200.
The technical structure hasn't changed, and Bitcoin cannot beat the main moving averages – allowing the bears will try again soon.
Above the current price, the first resistance level is at $10,450, then the second at $10,625 and the third one at $11,300.
Below the current price, the first support level is at $9,650, then the second at $9,180 and the third one at $8,807.
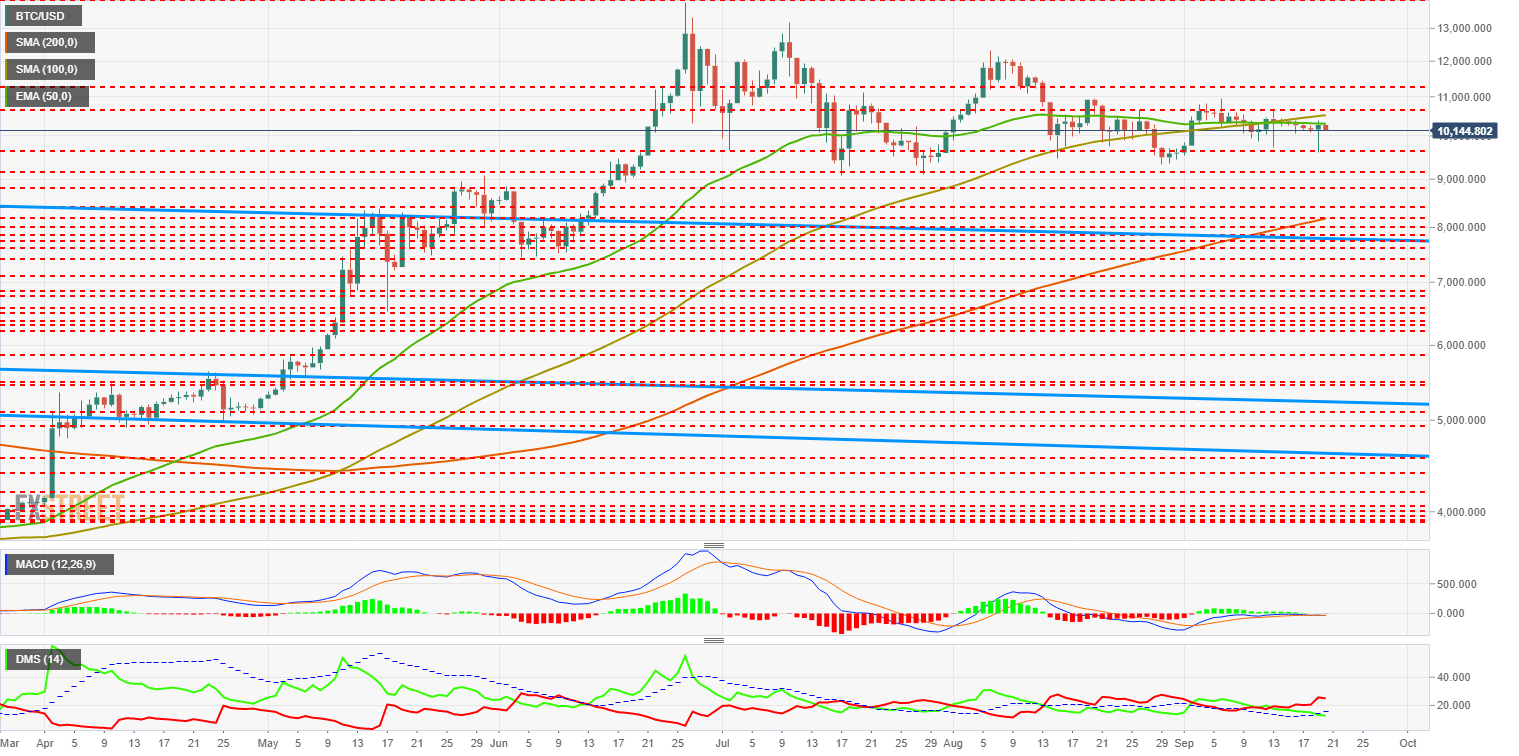
The MACD on the daily chart shows a flat profile just below the zero lines. Erratic movements can be expected, mainly downwards.
The DMI on the daily chart shows how the bears manage to hold the advance while they manage to send the bulls below the ADX line, which will complicate any bullish attempt in the short term.
ETH/USD Daily Chart
ETH/USD is currently trading at $217.2 following a failure to exceed the 200-period simple moving average. This sign of weakness is the first in 9 days.
Above the current price, the first resistance level is at $220, then the second at $229 and the third one at $236.
Below the current price, the first support level is at $215, then the second at $207 and the third one at $200.
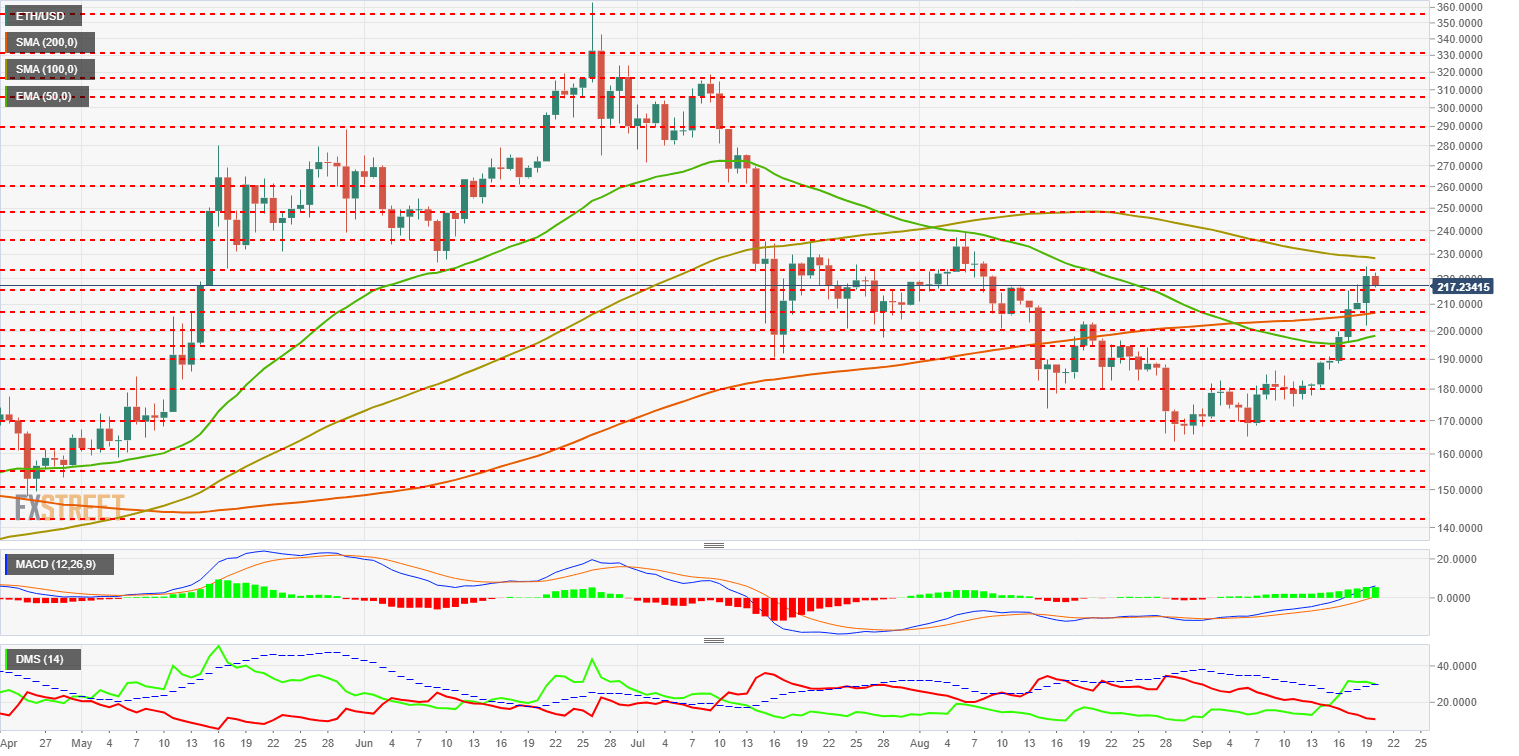
The MACD on the daily chart shows a bullish profile, preserving the openness between the lines and even improving the bullish slope.
The DMI on the daily chart shows the bulls just above the ADX line and jeopardizes the bullish trend. The bears continue to lose strength and go to minimum levels not seen in several months.
XRP/USD Daily Chart
XRP/USD is currently trading at $0.2942 and looks like it is going for the second day of consecutive downturns. XRP is trapped between the 50-period exponential moving average and the 100-period simple moving average.
Above the current price, the first resistance level is at $0.30, then the second at $0.31 and the third one at $0.32.
Below the current price, the first support level is at $0.293, then the second at $0.289 and the third one at $0.283.
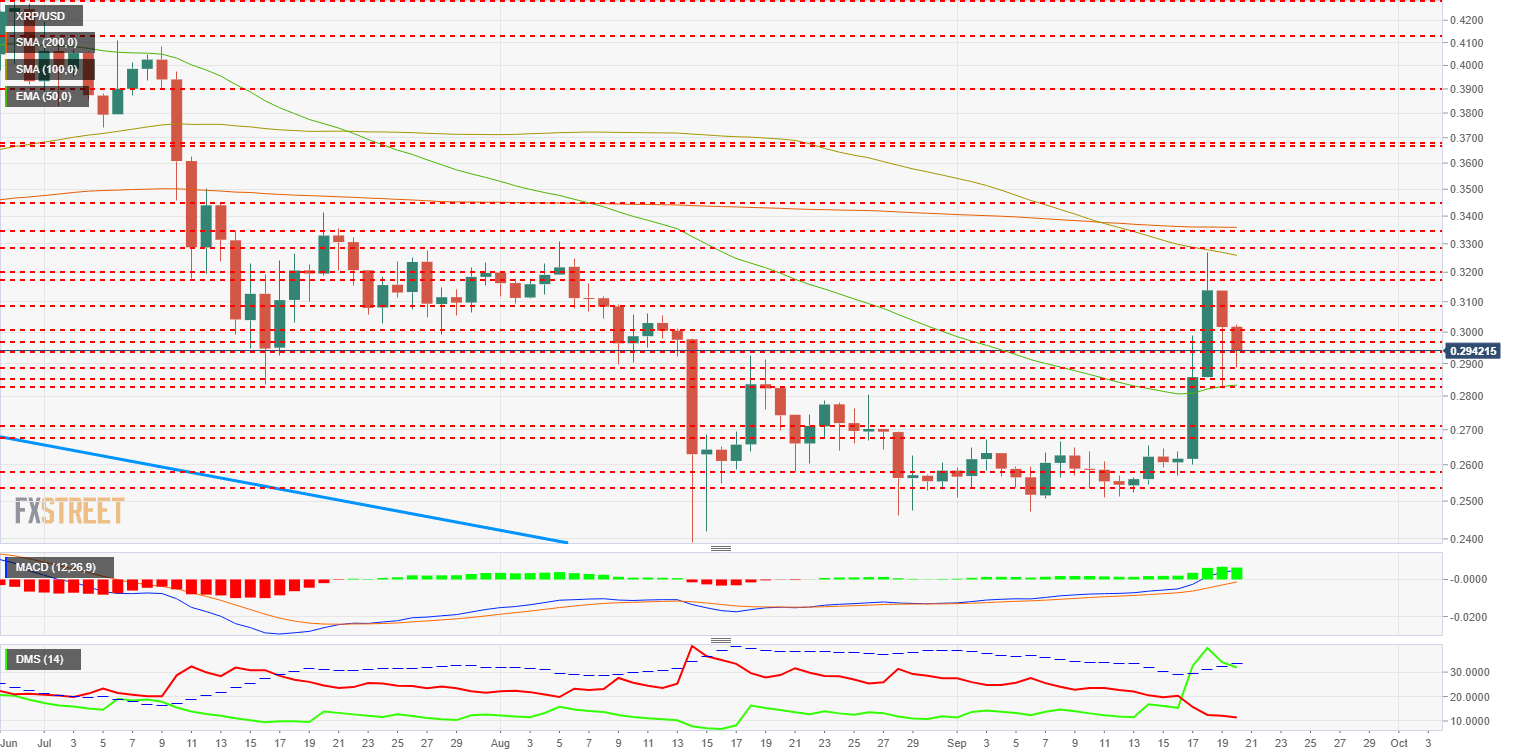
The MACD on the daily chart shows an improvement in the bullish profile. The amplitude between the lines is potentially bullish, although the slope is not as positive. We can expect a lateral bullish movement in the next few days.
The DMI on the daily chart shows how the bulls drill down the ADX lines, which is a sign of weakness as well as a loss of bullish momentum. The bears do not react and continue to lose strength with each passing day.
Get 24/7 Crypto updates in our social media channels: Give us a follow at @FXSCrypto and our FXStreet Crypto Trading Telegram channel
Author

Tomas Salles
FXStreet
Tomàs Sallés was born in Barcelona in 1972, he is a certified technical analyst after having completing specialized courses in Spain and Switzerland. He expanded his technical training following the guidance of great experts on the financial markets.


