Top 3 Price Prediction Bitcoin, Ripple, Ethereum: BTC/USD knocks on the bullish trend door with targets beyond the moon
- A close above $8,350 would end the long term bearish trend for Bitcoin.
- Until now, BTC/USD has been within a long-term downward structure.
- XRP/USD may explode upwards if it consolidates the momentum.

Bitcoin continues to advance relentlessly towards the roof of the long-term downspout. This channel has governed the development of the King of cryptocurrencies since the beginning of 2017.
The arrival at this level of resistance should cause a pause in the enormous current upward movement of Bitcoin, a break that should be used by the Altcoins to raise and close the current negative differential against the King.
The ETH/BTC guidance chart continues to show the ongoing bearish trend, despite the sharp rises taking place throughout the Altcoins universe. Bitcoin is doing exceptionally well that very few manage to gain ground.
In the last three weeks, Bitcoin has had a 20% higher net yield versus a basket made of 50% Ethereum + 50% other main Altcoins. This situation should be corrected if the typical pattern is still active, but there is a possibility that the Crypto market has entered another paradigm where things don't work that way.
ETH/BTC Daily Chart
The ETH/BTC crypto cross is trading at the price level of 0.026, after setting a low at 0.02454 and as it continues crushing Altcoiners' morale.
Above the current price, the first resistance level is at 0.0269 (price congestion resistance). The second resistance level for the ETH/BTC pair is at 0.0275 (price congestion resistance and EMA50), then the third resistance level is at 0.029 (price congestion resistance and SMA100).
Below the current price, the first support level should be sought in the early months of 2017. This old support level is at 0.0229 (price congestion support), then the second support level is at 0.0200 (price congestion support). The third level of support for the ETH/BTC pair is at 0.0155 (price congestion support).
-636934241301610041.png)
The MACD on the four-hour chart crossed down again yesterday, and today, it seems to want to try the upside once again. This development must be the natural one as the indicator is in very negative territory, but in the meantime, the bearish trend is still active.
The DMI on the 4-hour chart shows that bears are losing some strength while the bulls do just the opposite and approach the 20 levels of the indicator. A meeting between both sides of the market is possible already today and if Ethereum wins, it could start an Altcoins season that promises to be spectacular.
BTC/USD Daily Chart
BTC/USD is currently trading at $8.225 after reaching the long term bearish channel ceiling. Yes, you read that right, bearish. At least at the time of writing.
Bitcoin, which has risen from $3,200 to $8,330 since December, remains within a bearish structure. If it breaks it up, we will finally be able to end the significant 2018/2019 downtrend, and the limit for the Bitcoin price will be in unchartered territories, beyond the all-time highs.
Above the current price, the first resistance level is $8,230 (long term bear channel ceiling), then the second resistance level is at $8,430 (price congestion resistance). The third resistance level for the BTC/USD pair is at $8,775 (price congestion resistance).
Below the current price, the first support level is $8,000 (price congestion support), then the second support level is at $7,980 (price congestion support). The third level of support for BTC/USD is $7,750 (price congestion support).
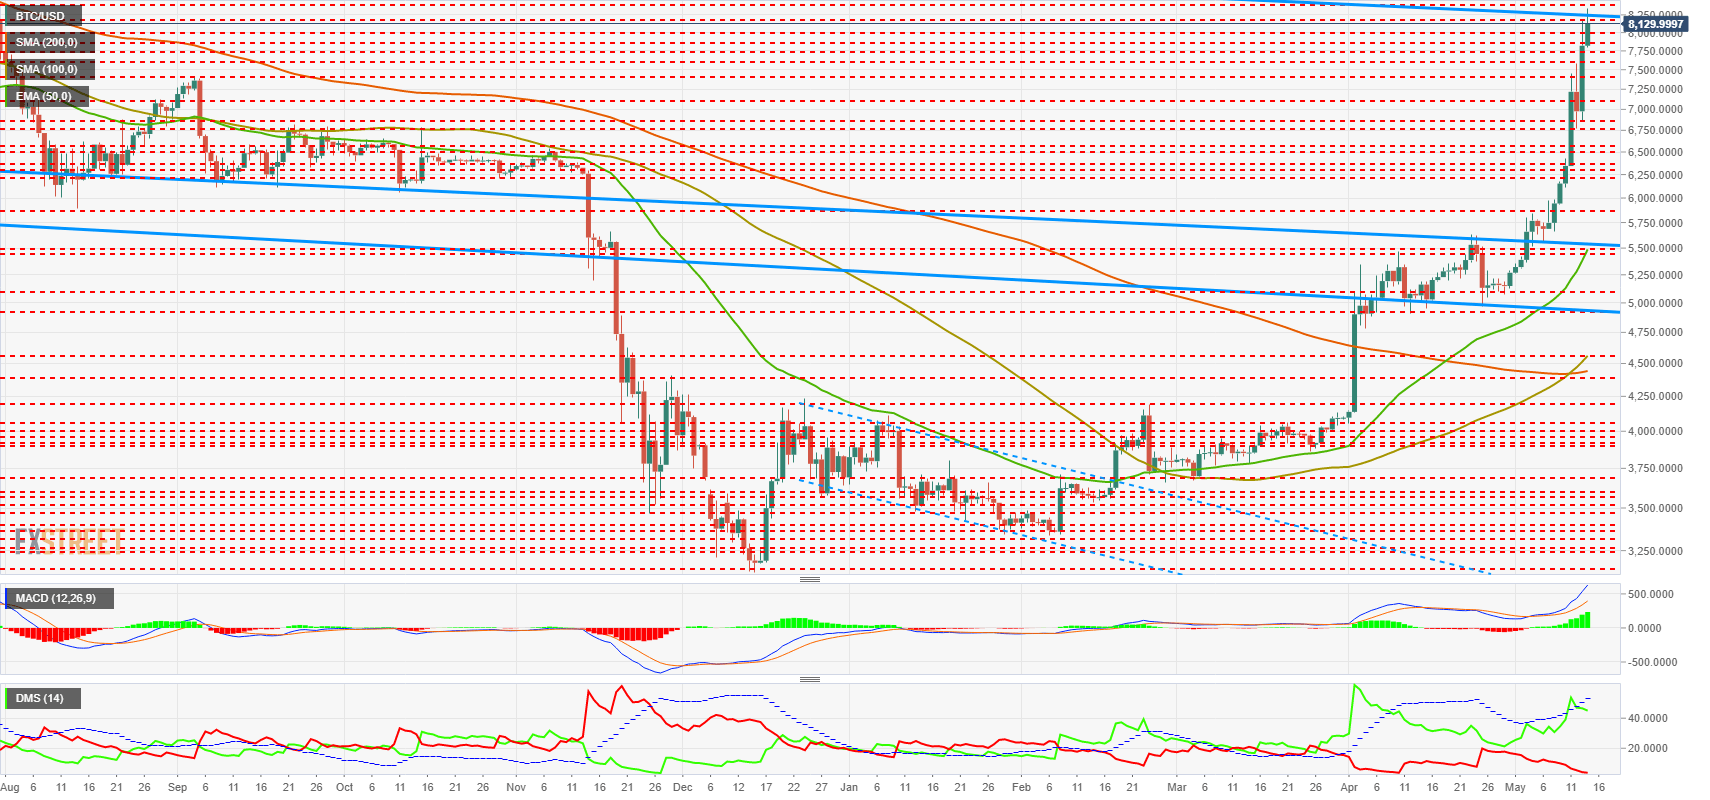
The MACD on the daily chart shows an extreme bullish profile with a large opening between the lines. The indicator shows such a strongly bullish structure that at any time a quick and robust correction can appear as normal.
The DMI on the daily chart shows how bears go to minimum levels that are typically followed by price cuts. Bulls dominate the moment, although they cross down the ADX line, which heralds an increase in market instability.
ETH/USD Daily Chart
ETH/USD is trading at $208. As we can see from the daily chart, Ethereum escaped the bearish structure in March, and since then it has been moving slightly higher. Perhaps the time has come for it to move higher with more violence.
Above the current price, the first resistance level is at $208.5 (price congestion resistance), then the second resistance level is at $225 (price congestion resistance). The third resistance level is at $236 (price congestion resistance).
Below the current price, the first support level is at $199.9 (price congestion support), then the second support level is at $190 (price congestion support). The third level of support for the ETH/USD pair is at $180 (price congestion support).
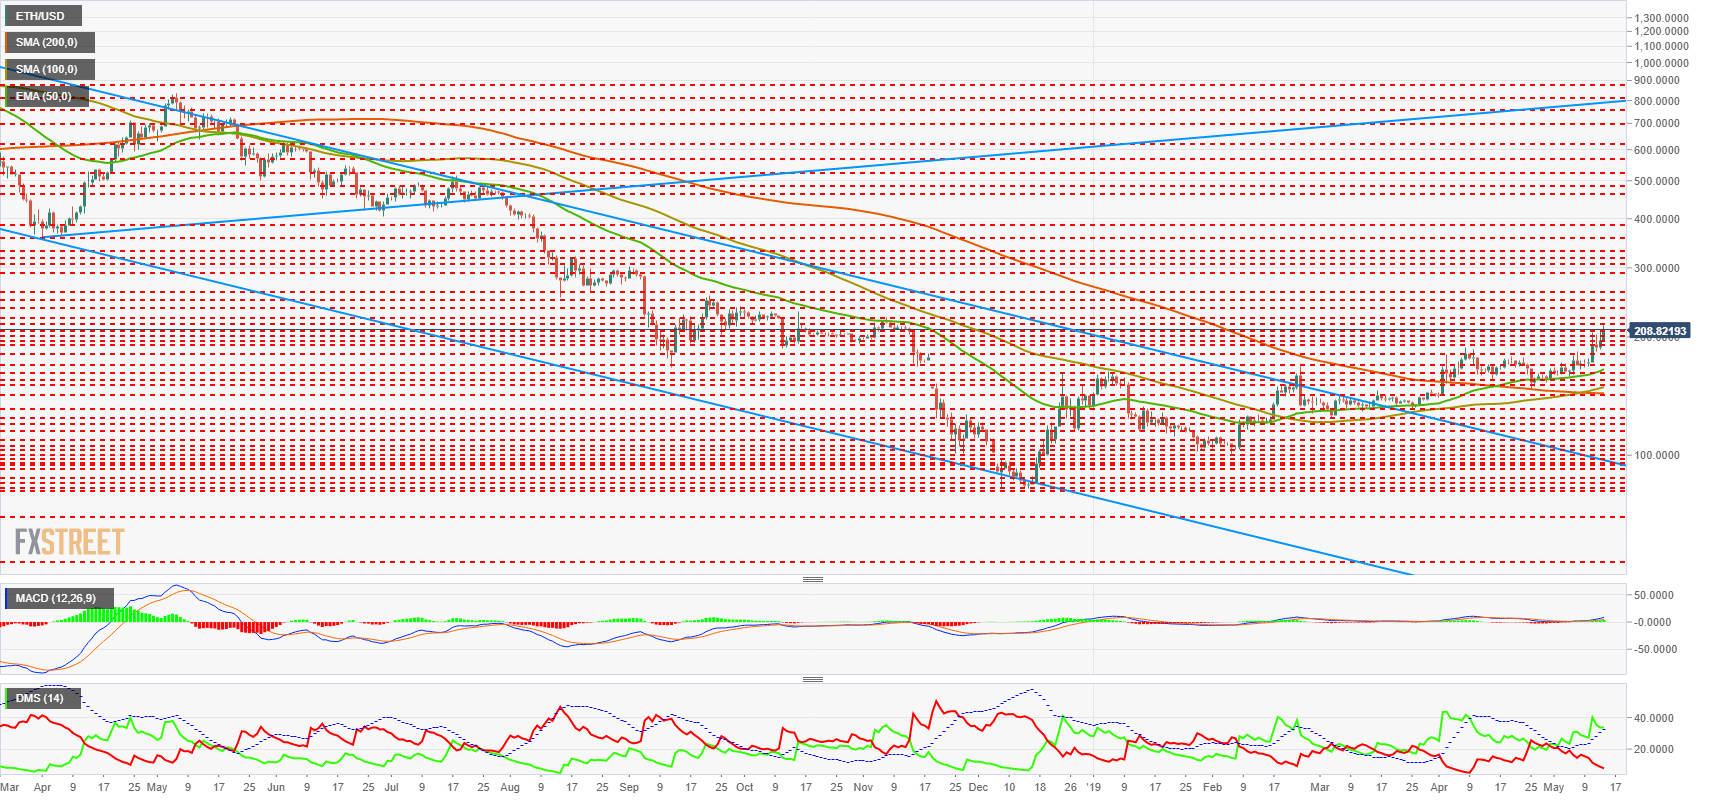
The MACD on the daily chart shows a reasonably bullish profile with a good opening between the lines. The structure is less developed than in the case of Bitcoin, so it retains more potential than consuming before entering final phases.
The DMI in the daily chart shows that bulls are in control of the situation and still well placed above the ADX line. The bears, on the other hand, go to the lows but with room to fall even lower.
XRP/USD Daily Chart
XRP/USD is currently trading at $0.374, after hitting a session high above $0.40. As we can see, XRP has come out of the long term bearish parallel channel, entering through the big door on the bullish neutral side of the market.
Above the current price, the first resistance level is at $0.39 (price congestion resistance), then the second resistance level is at $0.413 (price congestion resistance), while the third resistance level for the XRP/USD pair is at $0.423 (price congestion resistance).
Below the current price, the first support level is $0.368 (price congestion support), then the second support level is $0.346 (price congestion support). The third level of support is for the XRP/USD pair at $0.334 (price congestion support).
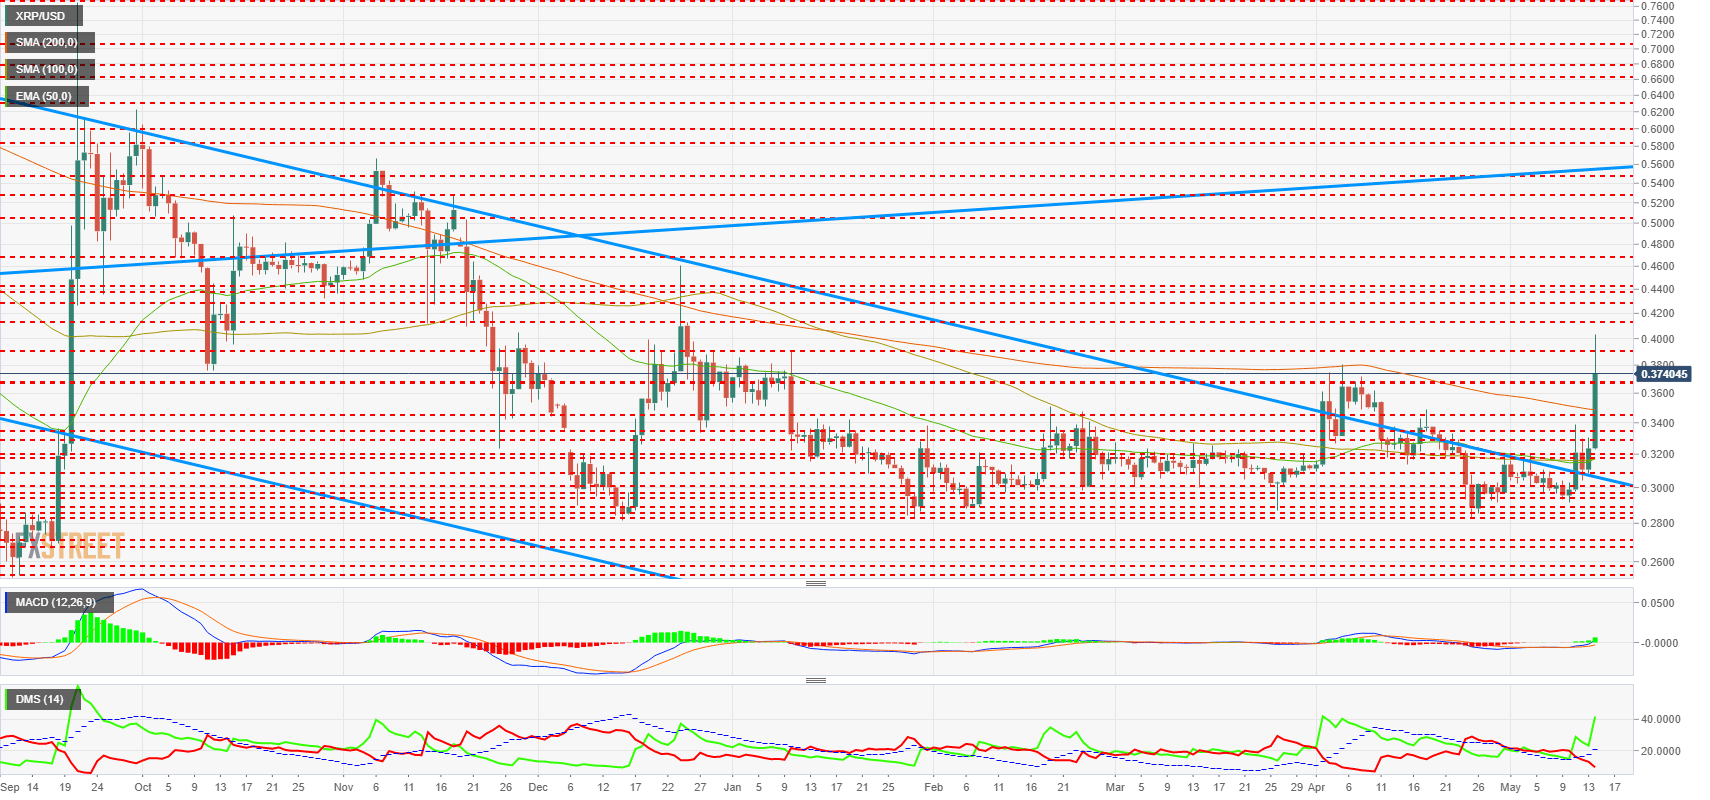
The MACD on the daily chart shows a slightly cross profile on the upside with a little opening between the lines as a result of the youthfulness of the movement. Besides, the indicators remain below the zero lines of the indicator, so if the trend persists and enters the positive zone, the rises can be scandalously bullish.
The DMI on the daily chart shows the bulls taking control with authority as the bears' sink. The structure is at an early stage, so you have a long way to go.
Get 24/7 Crypto updates in our social media channels: Give us a follow at @FXSCrypto and our FXStreet Crypto Trading Telegram channel
Author

Tomas Salles
FXStreet
Tomàs Sallés was born in Barcelona in 1972, he is a certified technical analyst after having completing specialized courses in Spain and Switzerland. He expanded his technical training following the guidance of great experts on the financial markets.


