Top 3 Price Prediction Bitcoin, Ethereum, XRP: Set for a dive before the next big bull market
- The Cryptoverse continues to spread and will be accessible from WhatsApp.
- Markets speed up the consolidation process and may drop in search of reliable levels of support.
- The next few days could be the last throes of a 14-month bear market.

Crypto goes mainstream – the cryptoverse is spreading to people's daily lives.
The first initiative comes from WhatsApp. Users of Facebook’s popular instant messaging application will be able to exchange Ether among themselves and other tokens that function over the ERC20 protocol.
The second thing to note is a statement from a former PayPal executive, Dan Schatt, in which he states that stablecoins can facilitate the acceptance of Blockchain technology by the traditional financial system. Stablecoins may function as virtual bridges between the two systems – the fiduciary and the decentralized – can be the gateway to the technology for the general public.
Despite this potential, Vodafone withdrew from Libra's stablecoin project on Wednesday, although it said it would continue to support it with a less prominent position.
ETH/BTC 4-Hours Chart
The ETH/BTC cross is currently trading at the price level of 0.01938. During the Asian session, Ether lost strength against Bitcoin, something that usually happens when the market falls.
But the fall has no technical impact at the moment, and the previous scenario remains intact.
The EMA50 average loses a bit of tilt and is already heading towards the projection area of the SMA100 and 200.
Above the current price, the first resistance level is at 0.0192, then the second at 0.020 and the third one at 0.0217.
Below the current price, the first support level is at 0.01905, then the second at 0.01877 and the third one at 0.0185.
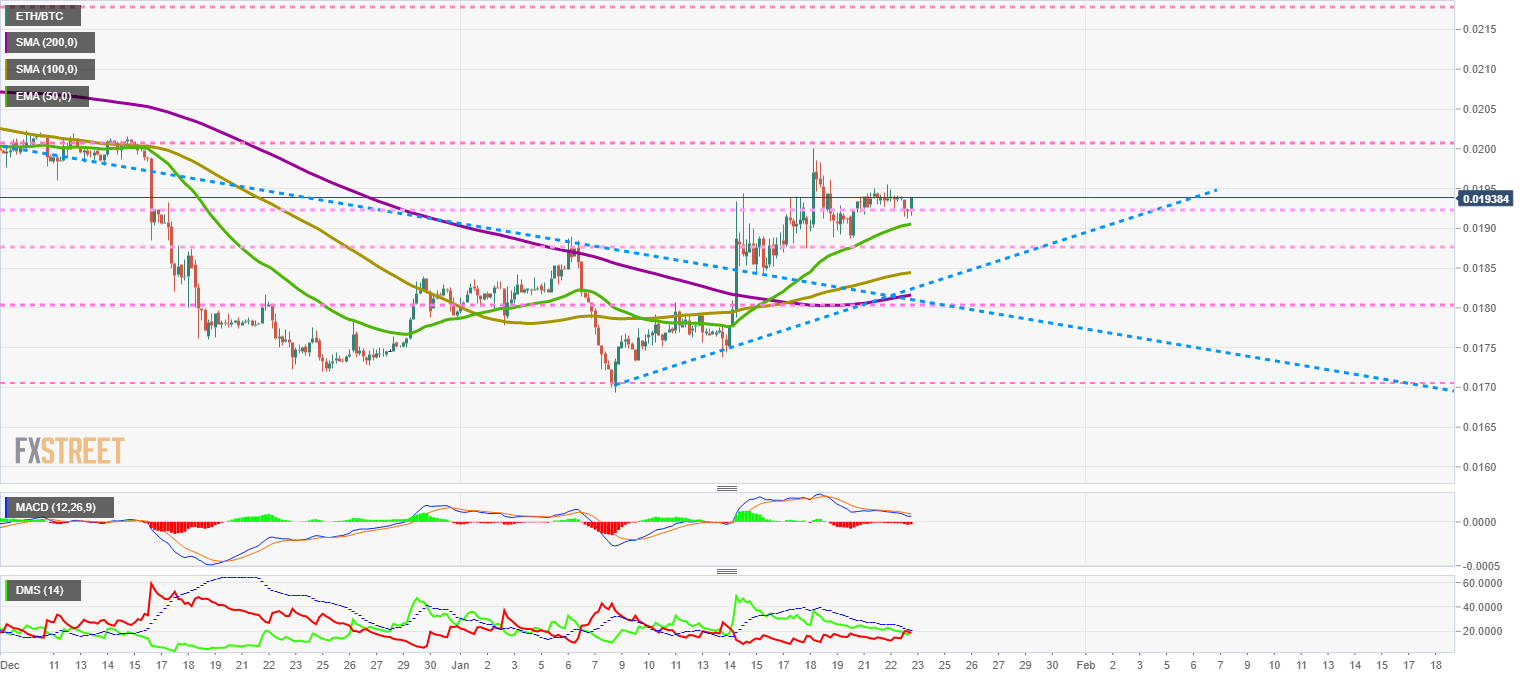
The MACD on the 4-hour chart is tilting downward and looking for support in the neutral zone of the indicator. At that point, the path taken by the moving averages will indicate the market's tone for the coming weeks.
The DMI on the 4-hour chart shows a small advantage for bears over bulls, but not enough to give the selling side a victory.
BTC/USD 4-Hours Chart
BTC/USD is currently trading at $8,403 and is losing support of the EMA50. The short term exponential average loses its upward profile and seems to be heading towards the SMA100 level at $8,400.
Above the current price, the first resistance level is at $8,600, then the second at $8,800 and the third one at $9,150.
Below the current price, the first support level is at $8,500, then the second at $8,400 and the third one at $8,200.
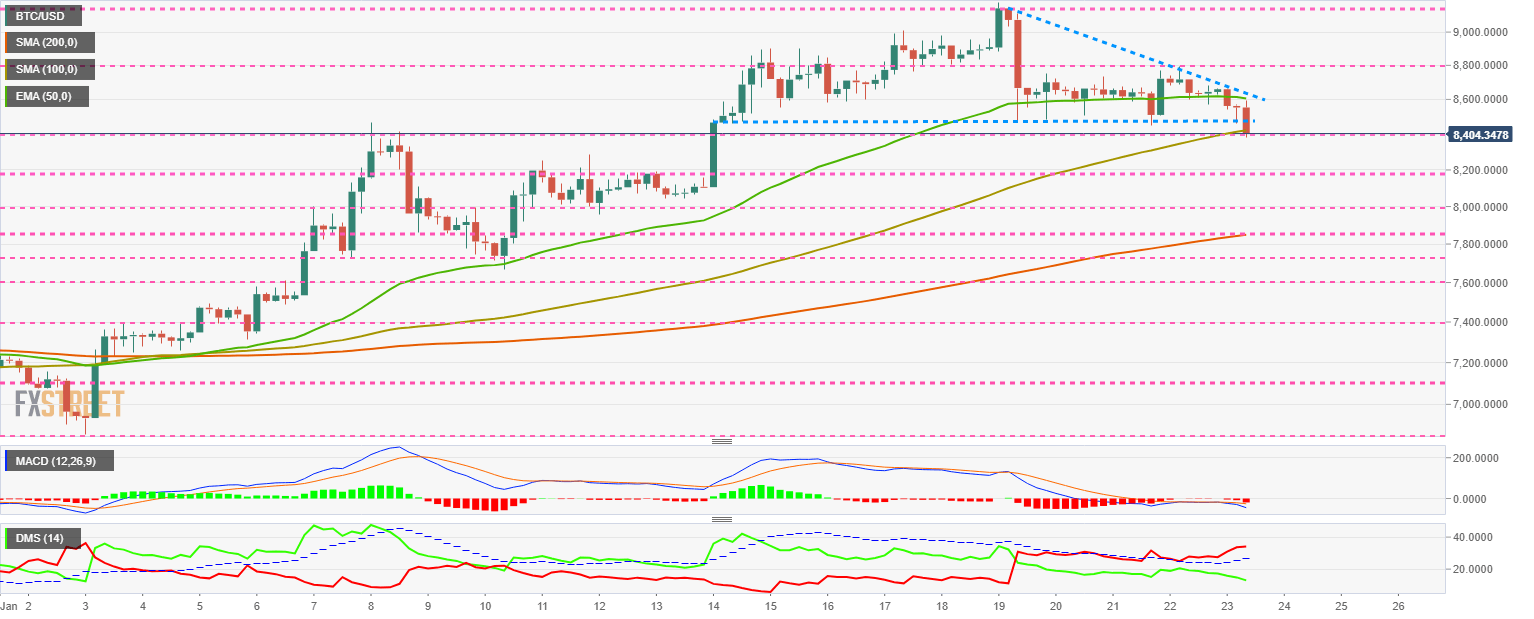
The MACD on the 4-hour chart is heading back down, suggesting a bearish test that could drag the price down to $7,800 in the worst-case scenario.
The DMI on the 4-hour chart shows that despite the declines, bears are losing strength while bulls are gaining it. This behavior is divergent with the price and should keep us alert to the chart and flexible to act in case of a sudden change in direction.
ETH/USD 4-Hours Chart
ETH/USD is currently trading at $162.6 and is trading below the EMA50 for the first time since the 13th.
Moving averages continue to trend higher, although the short term exponential is beginning to lose momentum.
Above the current price, the first resistance level is at $167, then at $170 and the third one at $180.
Below the current price, the first support level is at $160, then the second at $155 and the third one at $151.5.
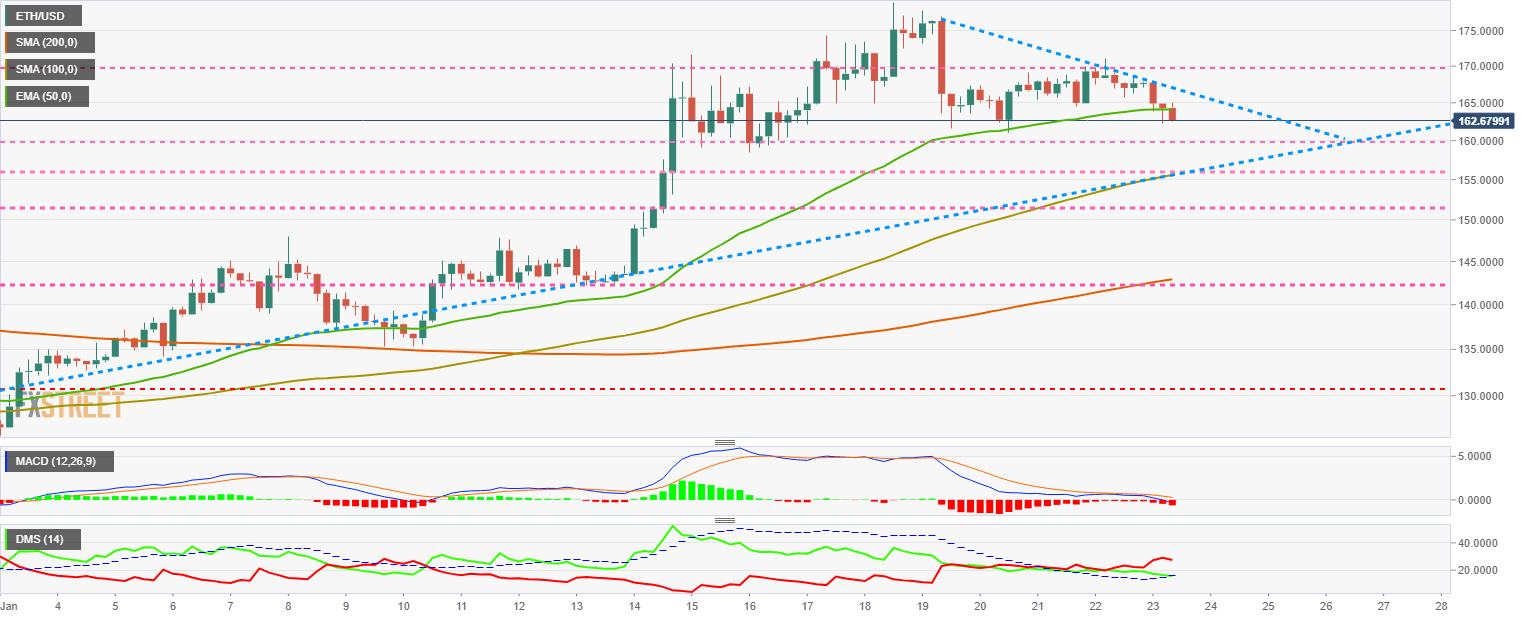
The DMI on the daily chart shows bears taking advantage of the bullish trend, although both sides of the market are moving above the ADX line. This setup is conducive to sudden changes in market control.
XRP/USD 4-Hours Chart
XRP/USD is currently trading at $0.2261 and has lost all support from the EMA50 on the 4-hour chart. The exponential moving average is curving downward, and the SMA100 is losing its upward slope, which could signal a wide range of downward movement.
Above the current price, the first resistance level is at $0.2317, then the second at $0.2375 and the third one at $0.2538.
Below the current price, the first support level is at $0.224, then the second at $0.217 and the third one at $0.2100.
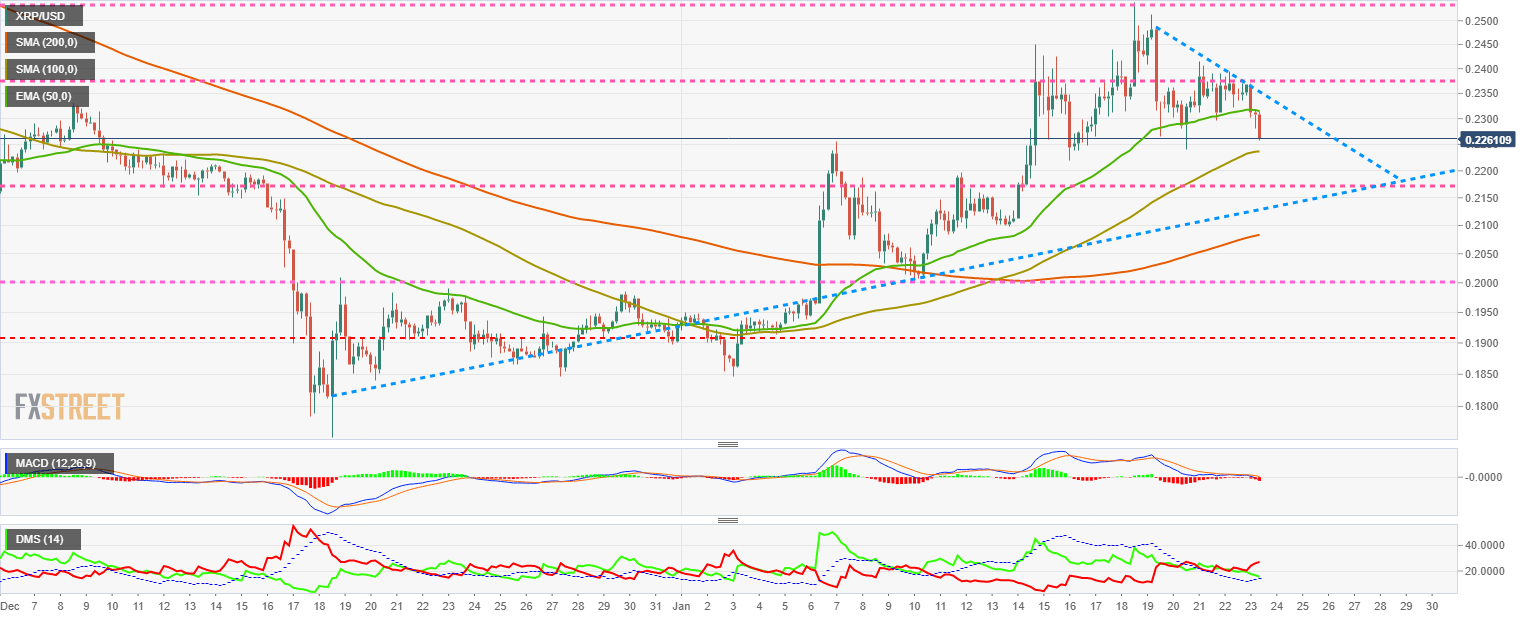
The DMI on the 4-hour chart shows that bears are taking advantage of the bullish trend. Both sides of the market are holding above the ADX line, which would allow for a quick change of scenery and price direction.
Get 24/7 Crypto updates in our social media channels: Give us a follow at @FXSCrypto and our FXStreet Crypto Trading Telegram channel
Author

Tomas Salles
FXStreet
Tomàs Sallés was born in Barcelona in 1972, he is a certified technical analyst after having completing specialized courses in Spain and Switzerland. He expanded his technical training following the guidance of great experts on the financial markets.


