Pi Network Price Forecast: PI approaches trendline resistance as 60 million token transfers raise concern
- Pi Network is nearing its descending trendline on Wednesday, with a breakout or rejection likely to dictate the next directional move.
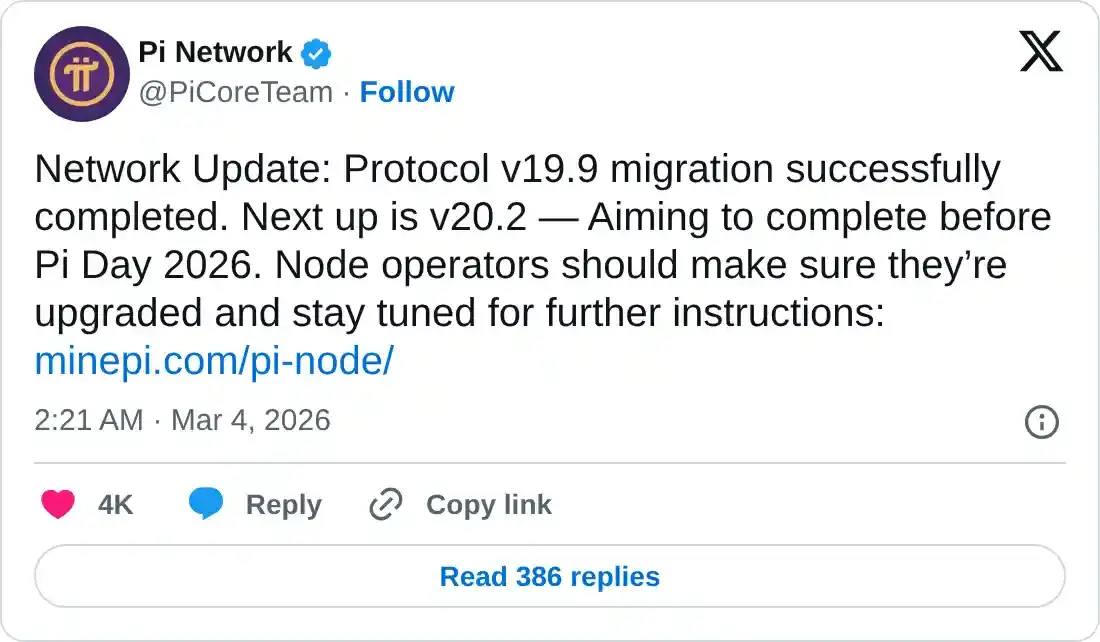
- Pi announces that the protocol v19.9 migration is completed, with the team now targeting v20.2 rollout ahead of Pi Day 2026.
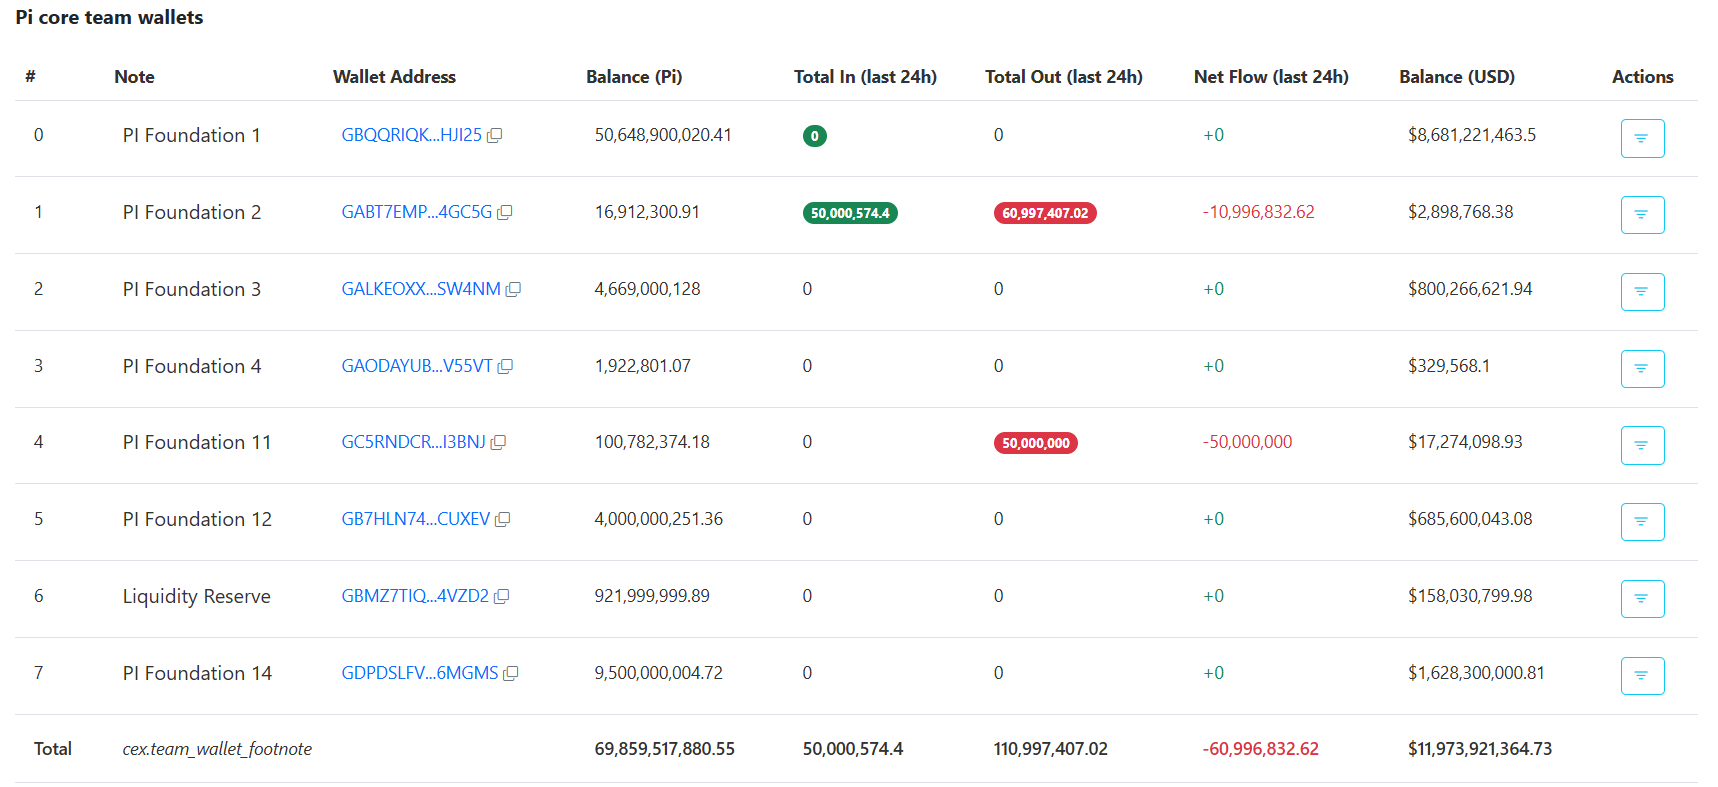
- Traders should be cautious as the Pi core team moved over 60 million PI tokens in the last 24 hours, which could add short-term selling pressure.

Pi Network (PI) price is approaching its descending trendline around $0.173 at the time of writing on Wednesday, set to shape the next directional move. Market sentiment remains mixed as the successful completion of the protocol v19.9 migration underscores ongoing ecosystem development, while the core team’s transfer of 60 million PI tokens has sparked concerns about potential near-term supply pressure.
Network update could boost sentiment
Pi Network’s official X account announced on Wednesday that the protocol v19.9 migration has been completed. This upgrade marks the third step toward the protocol sequentially transition from v19 to v23, as previously announced in August.
The Pi protocol was originally adapted from the Stellar framework. This version is a custom Pi protocol built on a base that pulls upgrades from the Stellar protocol version 23, enabling new layers of functionality and control.
“Next up is v20.2 — Aiming to complete before Pi Day 2026,” Pi Network said in its X post, signaling that development efforts remain on track.
These ongoing ecosystem developments highlight the team’s continued focus on strengthening the protocol and advancing its long-term network capabilities, which could be bullish for the protocol’s native token, PI, in the long term.
Core teams’ token transfers raise concern
PiScan data scheenshot below shows that the Pi Foundation moved another 60.99 million PI tokens in the last 24 hours. This move follows the previous day’s transfer of PI tokens into the open market.
So far, these tokens have not yet been moved to exchanges. Traders should remain cautious, as any of these tokens moving toward exchanges could increase supply and introduce short-term selling pressure.
Pi Network Price Forecast: Breakout or rejection likely to dictate the next move
Pi Network price found cushion around the daily support level at $0.153 on February 23 and rose over 7% in the next four days, retesting the 50-day Exponential Moving Average (EMA) at $0.173. PI has been facing rejection around the EMA since Saturday, and as of Wednesday, it is nearing this resistance level. This 50-day EMA roughly coincides with the descending trendline (drawn by connecting multiple highs since mid-August), making it a key zone to watch.
If PI breaks above the 50-day EMA and the descending trendline on a daily basis, it could extend the rally toward the 100-day EMA at $0.195. A close above this level could extend gains toward the weekly resistance at $0.221.
The Relative Strength Index (RSI) on the daily chart reads 53, above the neutral 50 level, pointing upward and indicating bullish momentum is gaining traction. The Moving Average Convergence Divergence (MACD) shows a bullish crossover on February 13 that remains intact, further supporting a positive outlook.
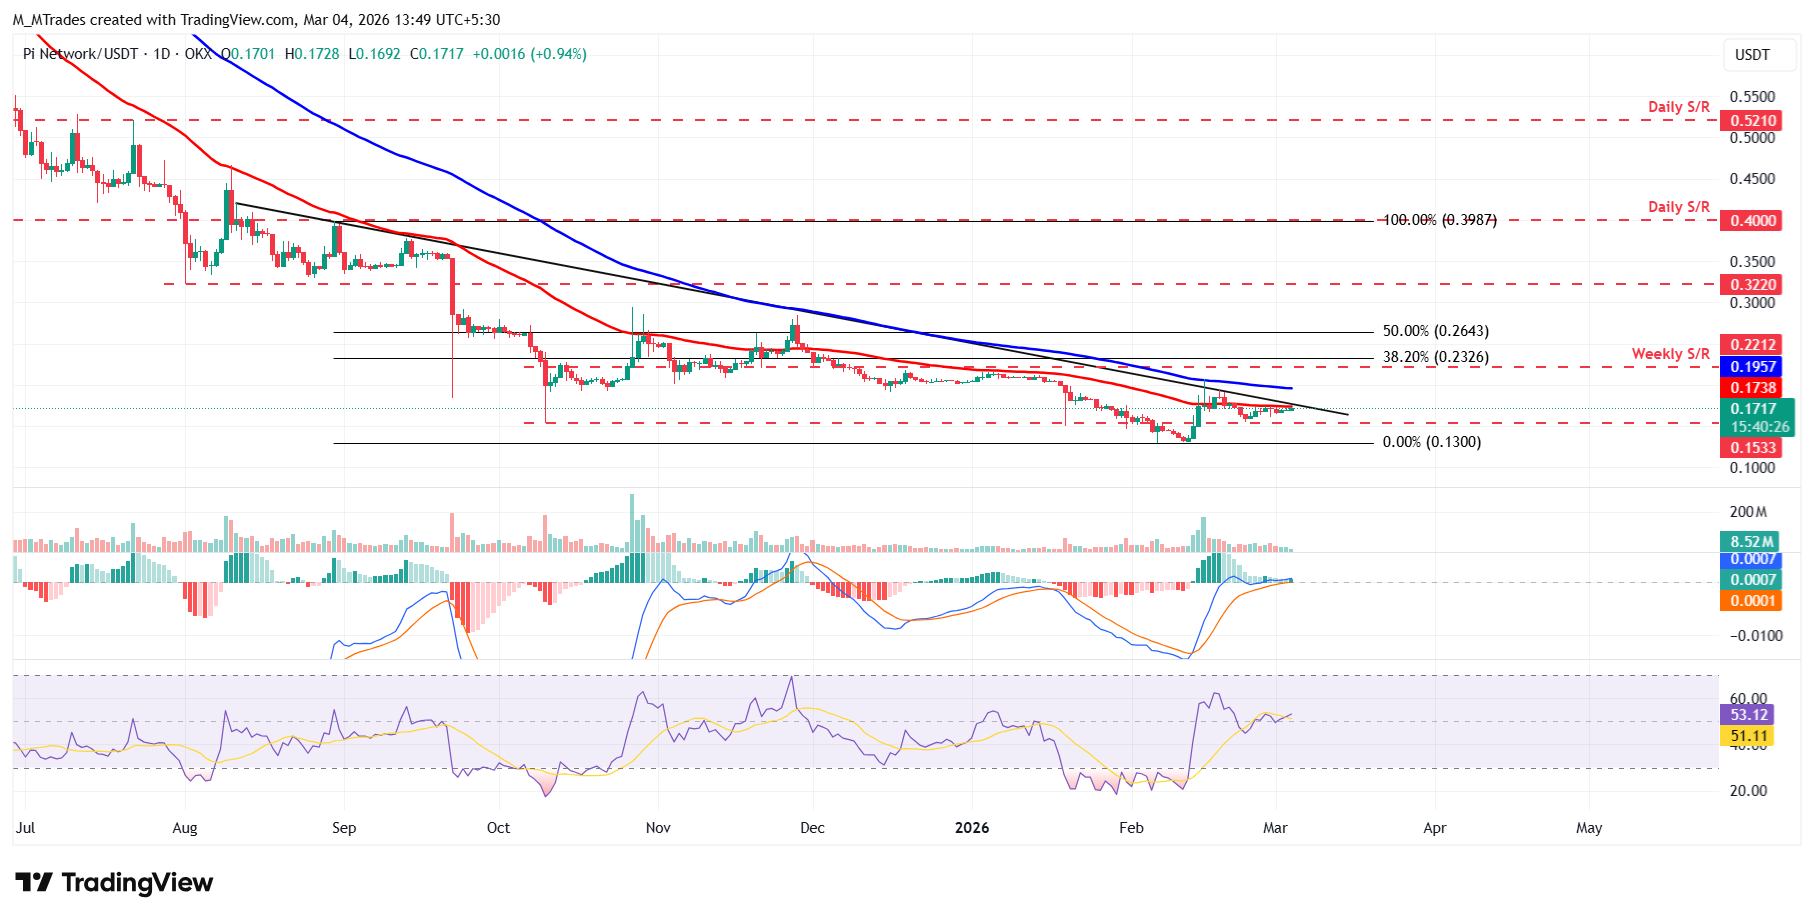
On the other hand, if PI faces rejection from the above-mentioned resistance zone and corrects, it could extend the decline toward the daily support at 0.153.
Author

Manish Chhetri
FXStreet
Manish Chhetri is a crypto specialist with over four years of experience in the cryptocurrency industry.



