Top 3 Price Prediction Bitcoin, Ethereum, XRP: Cryptos rally fizzles, Russian aggression weighs on investors
- Bitcoin price completes the most sought-after bullish entry condition within the Ichimoku Kinko Hyo system.
- Ethereum price action avoided a major bearish breakout on Monday.
- XRP price rallied more than 10% on Monday but failed to break out of the Ichimoku Cloud

Bitcoin price closed out February with a bang on Monday, closing nearly 15% higher. Ethereum price was threatened by a massive bearish continuation setup, barely hanging on to near-term support until it rallied. XRP price teased bulls with a breakout similar to Bitcoin’s but cut short by only $0.0006.
Bitcoin price completes bullish entry that signals a renewed bullish expansion phase
Bitcoin price, on Monday, completed what Ichimoku traders and analysts have been waiting for since the beginning of 2022: an Ideal Bullish Ichimoku Breakout. The rule for this entry are as follows:
- The current close is above the Ichimoku Cloud (Senkou Span A and Senkou Span B).
- The Tenkan-Sen is above the Kijun-Sen.
- If the Tenkan-Sen is below the Kijun-Sen, then the Kijun-Sen must be flat or pointing down while the Tenkan-Sen is pointing up.
- Future Senkou Span A is above Future Senkou Span B.
- The Chikou Span is above the bodies of the candlesticks and in open space.
- Open-space is a condition where price will not intercept the body of a candlestick over the next five to ten periods.
While bulls still need to confirm the breakout by pushing Bitcoin price higher, upon confirmation, the next target for BTC is near the $59,000 value area where a high volume node in the extended 2021 Volume Profile and the 161.8% Fibonacci extension exist.
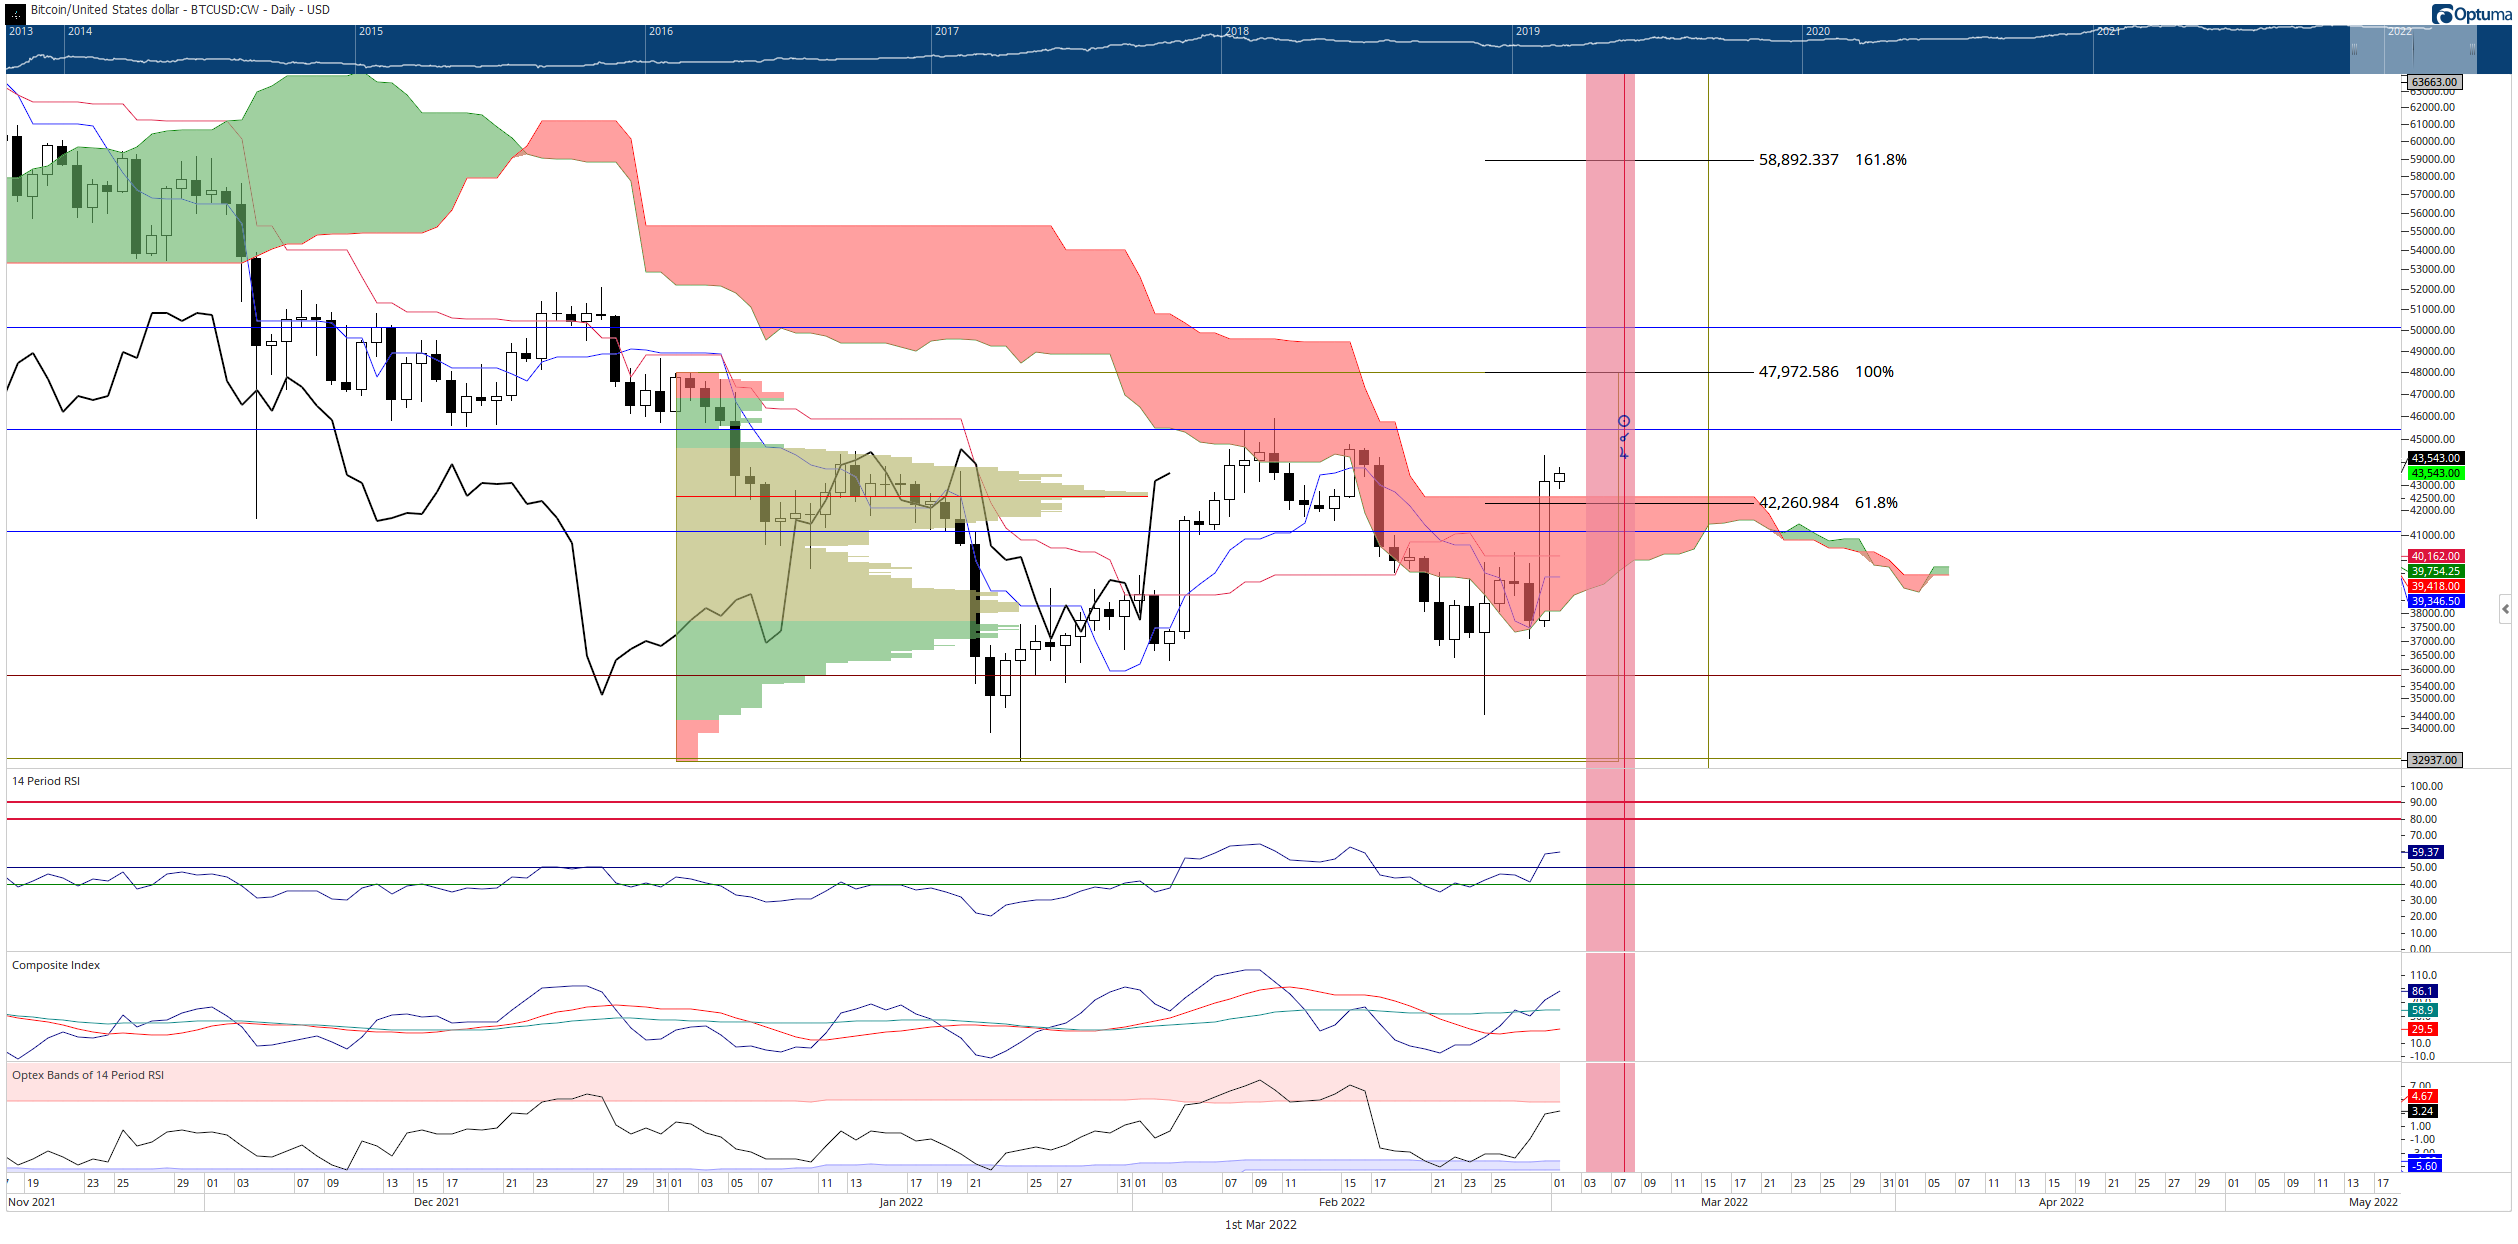
BTC/USD Daily Ichimoku Kinko Hyo Chart
Downside risks have been mitigated but remain a threat. The near-term bullish outlook will be invalidated if Bitcoin price closes at or below $37,000. In that scenario, Bitcoin would confirm a massive bull trap and initiate the inverse of the current Ichimoku entry – the Ideal Bearish Ichimoku Breakout.
Ethereum price triggers bear trap at $2,500
Ethereum price had many short-sellers waiting for a breakout below the final support level of the daily Tenkan-Sen and 61.8% Fibonacci retracement at $2,500. However, their hopes were dashed as Ethereum, and the broader cryptocurrency market experienced a massive rally, pushing Ethereum to a close it needed to prevent further near-term selling.
At a minimum, Ethereum price needs to close above the $2,700 level – or just above the bottom of the daily Ichimoku Cloud (Senkou Span A). Instead, ETH closed Senkou Span A and then squeezed out a close above the 50% Fibonacci retracement at $2,900.
If bulls want to push Ethereum into the same Ideal Bullish Ichimoku Breakout condition that Bitcoin is currently in, then ETH needs to close above the two most potent resistance levels on its daily Ichimoku chart: the 2022 Volume Point Of Control and top of the Ichimoku Cloud (Senkou Span B). That means Ethereum price needs to close at or above $3,160 to confirm a new bullish expansion phase.
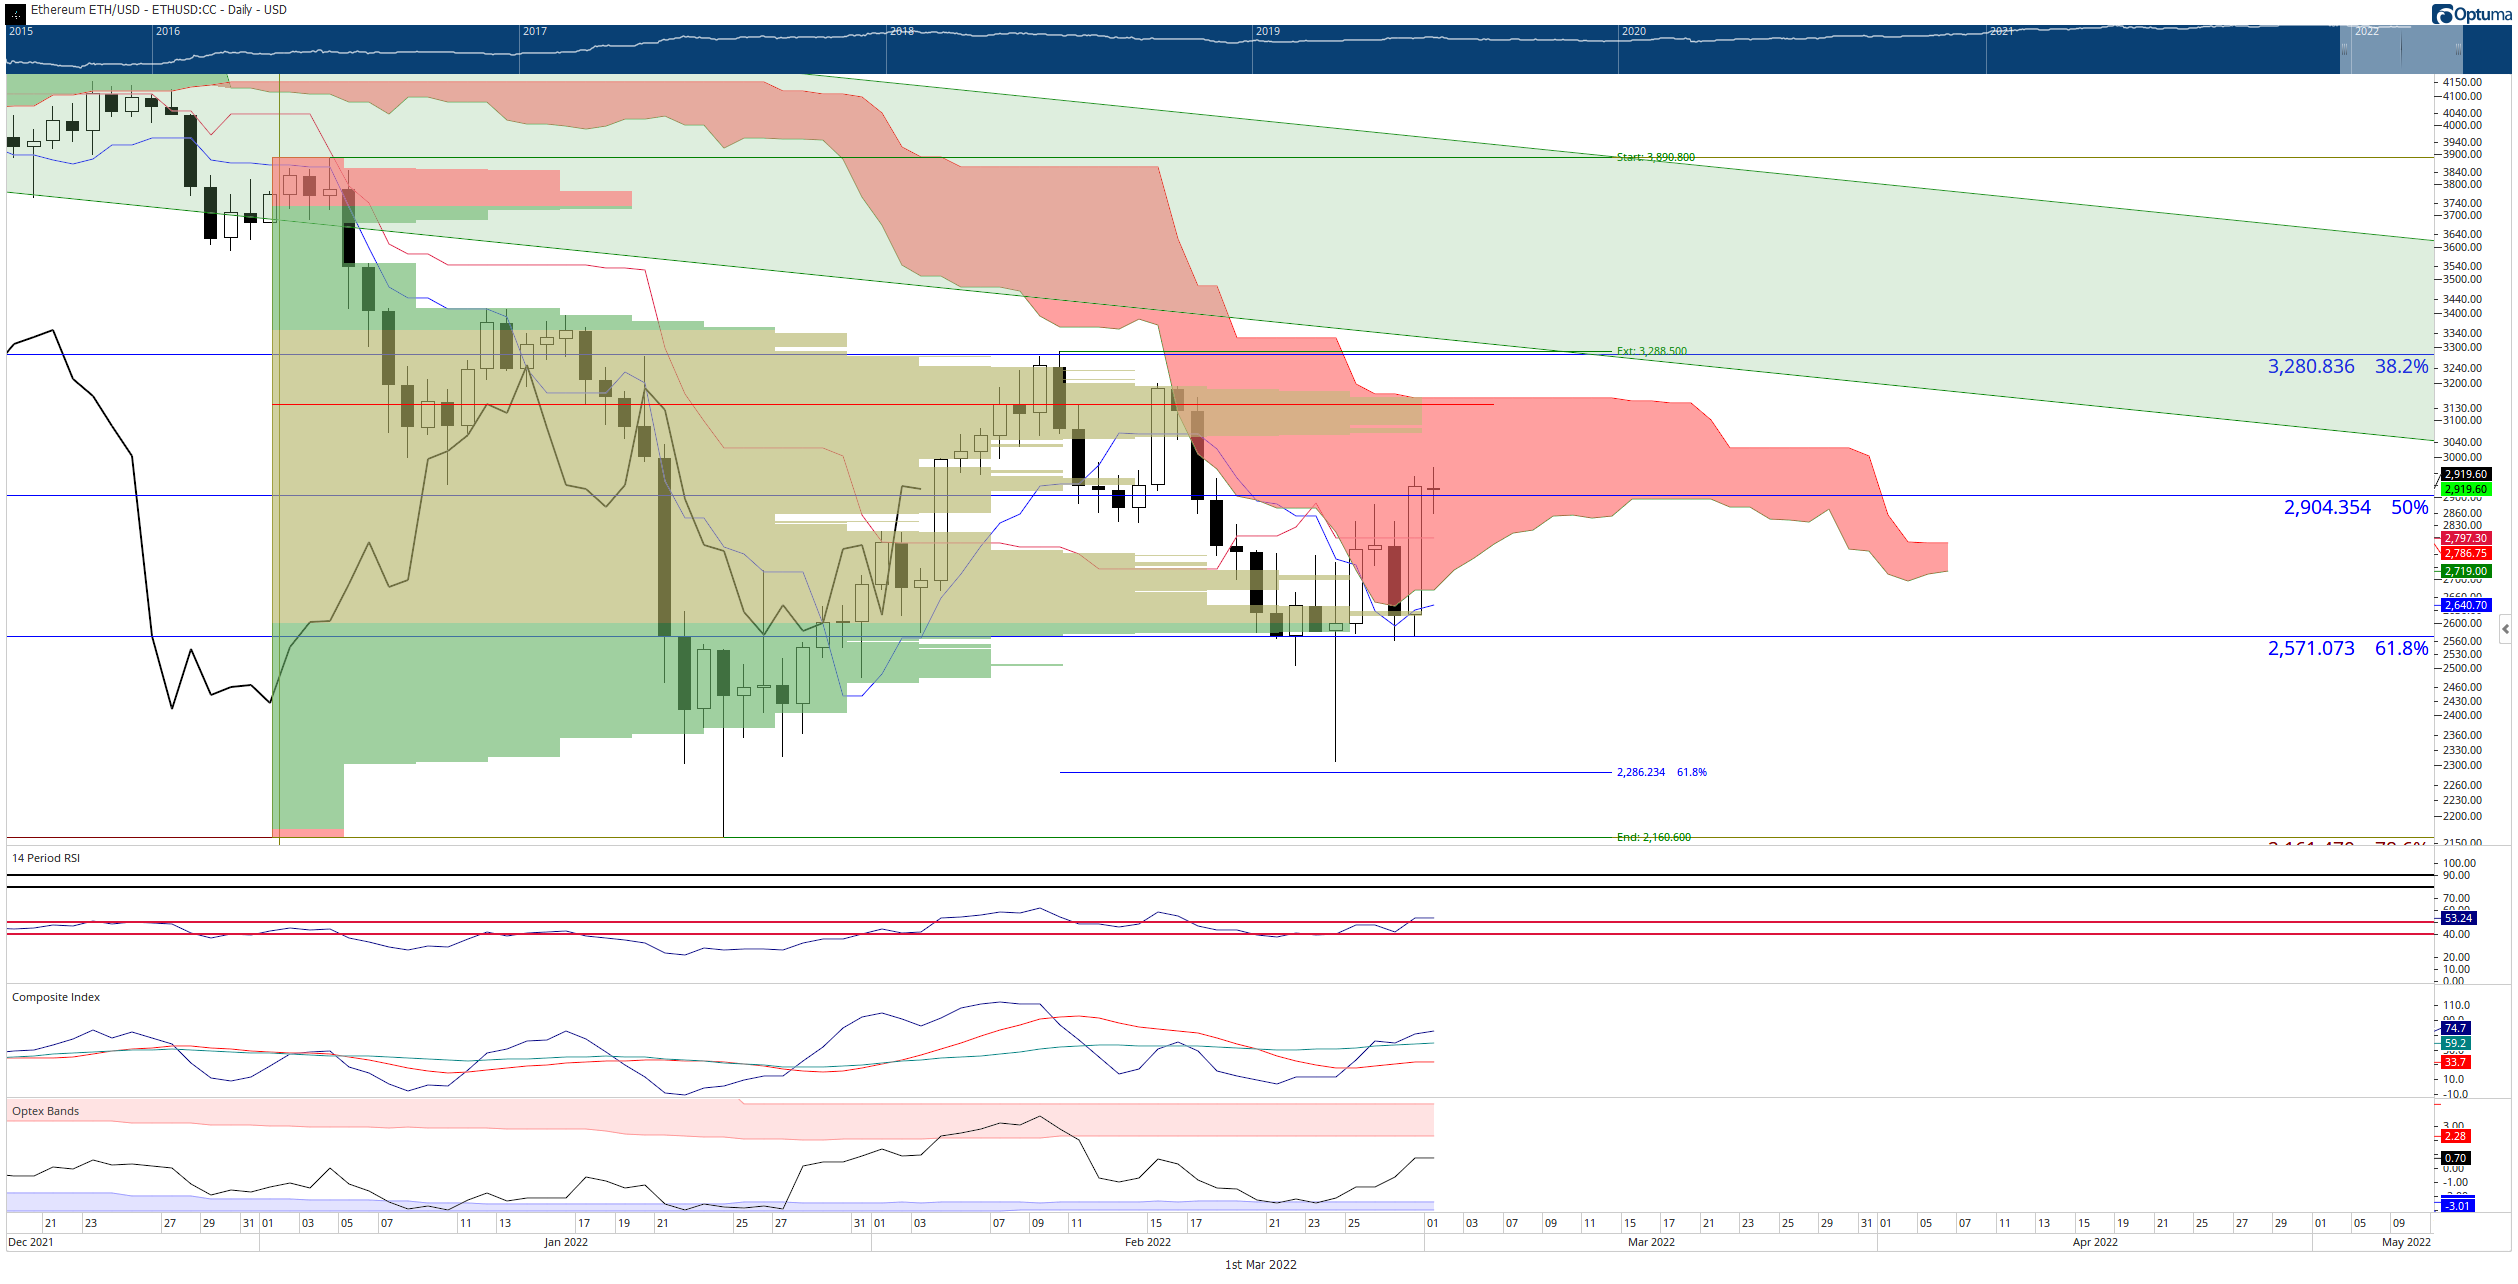
ETH/USD Daily Ichimoku Kinko Hyo Chart
A daily close below $2,570 would invalidate any near-term bullish outlook and return Ethereum to a downtrend.
XRP price rejected from completing an Ideal Bullish Ichimoku Breakout
XRP price held off signs of some renewed selling pressure on Monday by closing above the Tenkan-Sen and Kijun-Sen on an extreme bullish rally. Bulls were anticipating a solid close above the Ichimoku Cloud – but were prevented from doing so by just $0.0006 of a move higher. It is the fifth attempt to close above the top of the Ichimoku Cloud (Senkou Span B) of the past nine sessions.
However, a positive development of XRP’s drive higher yesterday was breaking out and closing above the Tenkan-Sen, Kijun-Sen, and 2022 Volume Point Of Control. The only level preventing an Ideal Bullish Ichimoku Breakout is Senkou Span B. Bulls need to close XRP price at or above $0.7850 to confirm a new uptrend. Upon confirmation, the next target XRP price will test is the $1.00 value area.

XRP/USD Daily Ichimoku Kinko Hyo Chart
Downside risks for XRP price should be limited to the combined support zones of the bottom of the Ichimoku Cloud (Senkou Span A) and the 50% Fibonacci retracement that shares the $0.6450 level. A close below that support zone would invalidate any near-term bearish momentum and likely trigger another sell-off towards the $0.5000 value area.
Author

Jonathan Morgan
Independent Analyst
Jonathan has been working as an Independent future, forex, and cryptocurrency trader and analyst for 8 years. He also has been writing for the past 5 years.