Top 3 price prediction Bitcoin, Ethereum, Ripple: The phantom of fear pierces market foundations
- Negative technical indicators are extremely volatile and are approaching a technical rebound.
- Ethereum has fundamentals in play versus Bitcoin which could be lethal.
- XRP is not immune to downfalls and adds to the dangerous game of critical supports.

Christmas is looming around and, on the crypto board, the slow symphony of fear continues to ring.
The Top 3 of the market are playing with critical support levels and keeping high tension since below current levels the market can go from fear to panic.
This pattern is a traditional system to clean the weak hands of inexperienced traders. The specific paradigm of the crypto universe revolves around the high percentages of holders, convinced that the future value of Bitcoin or Ethereum would be superior.
The case of the XRP, from my point of view, is similar in objective but differs in motivation. Anyone can see that the business potential of Ripple Ltd. is immense. Just look at the business figures of the electronic payment tycoons. Everyone wants to be close to a potential business of this caliber, although no one is clear about how the XRP will capitalize the value. Centralization and unlimited supply generate doubts and skepticism.
ETH/BTC Daily Chart
The ETH/BTC pair is currently trading at the price level of 0.01993, dancing a few hundreds above and below the critical level of 0.020.
The fastest-moving averages move away from the bearish profile, and even the SMA100 shows bullish inclination as it heads towards an encounter with the SMA200 in the 0.021 zones as a welcome to the new era.
The technical meeting of the spot price with the ultra long-term bearish trend line will take place in the coming days, and the result will mark the development of the crypto market as a whole.
If the ETH/BTC pair fails at the bullish cross of the aforementioned bearish trend, the market impact may be critical and would jeopardize the Ethereum project.
Above the current price, the first resistance level is at 0.0205, then the second at 0.0215 and the third one at 0.022.
Below the current price, the first support level is at 0.019, then the second at 0.018 and the third one at 0.017.
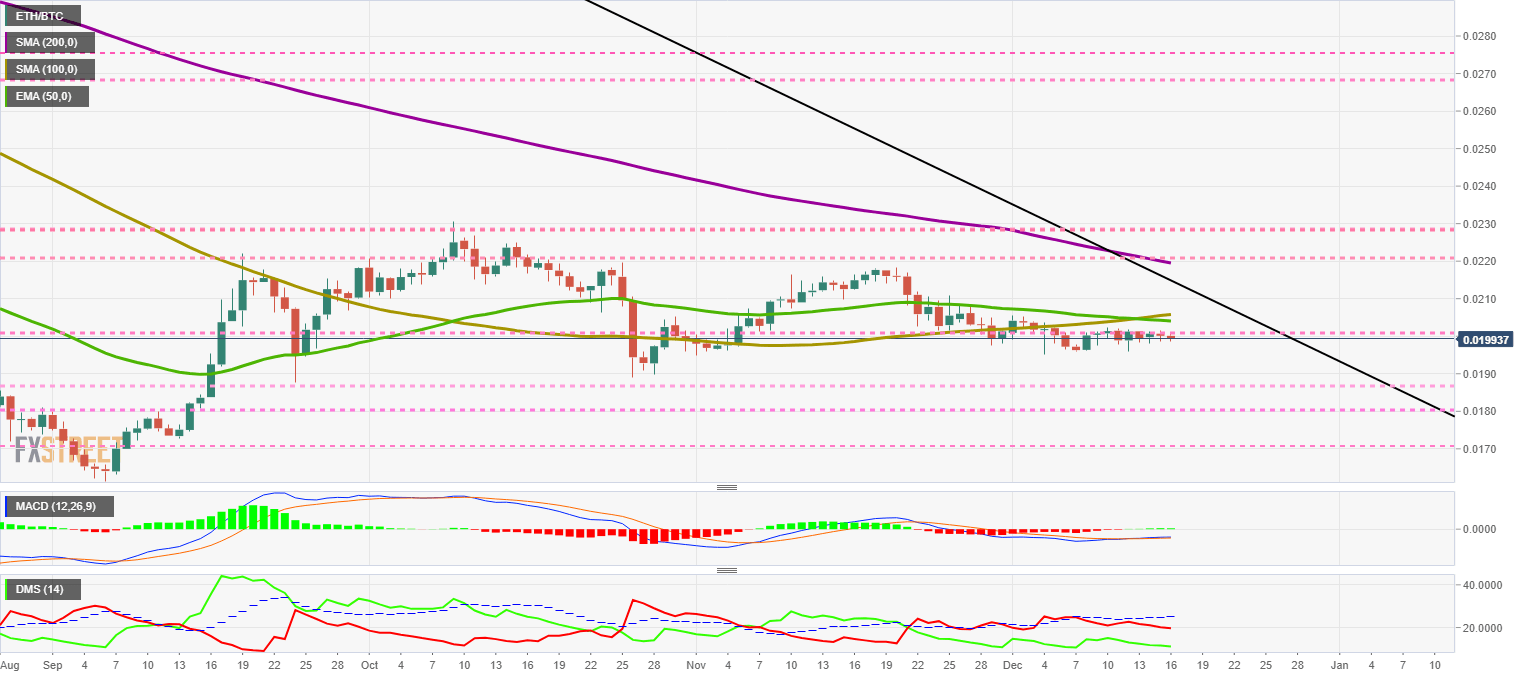
The MACD on the daily chart shows a slight uptrend but hardly any opening between the lines. The indicator conveys very little information due to the lack of volatility.
The DMI on the daily chart shows the bears losing the 20 level and, therefore, giving up on the responsibility of setting the trend for the pair. The bulls are still in a worse situation and are moving around levels that signal a lack of trend strength not seen since 2016.
BTC/USD Daily Chart
The BTC/USD pair is currently trading at the price level of $7057 (-0.79%), warning of a possible trip to relative lows in the $6,500 zone.
The BTC/USD pair had net capital inflows of +$26K, insufficient to compensate for the net outflow of more than -$122 Million seen on Saturday 14. On the weekly count, the net balance reaches -$323 Million.
The number of transactions goes to minimum levels not seen since November.
Above the current price, the first resistance level is at $7,100, then the second at $7,400 and the third one at $7,600.
Below the current price, the first support level is at $6,850, then the second at $6,750 and the third one at $6,570.
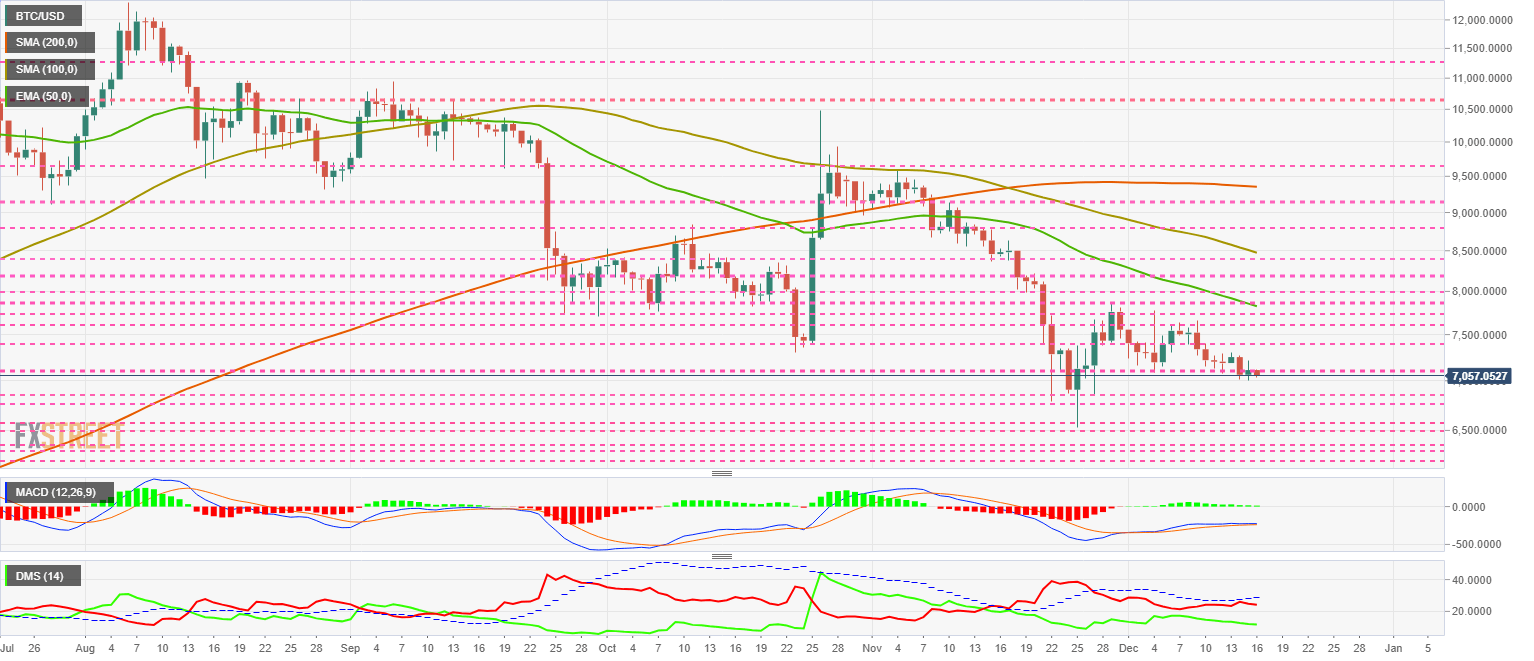
The MACD on the daily chart shows a loss of momentum, evidenced by the null opening between the lines. It should be easy for the bearish momentum to accelerate and look for prices in the third support zone.
The DMI on the daily chart shows how bears are having trouble leading the bearish movement, and as long as they are not able to move higher than the ADX line, the bearish movement has no potential to break supports.
ETH/USD Daily Chart
The ETH/USD pair is currently trading at the price level of $140.99 (-1.10%) and follows the bearish path of Bitcoin. Resistance at $150 now seems distant, and a visit to the $120 zone seems likely.
Moving averages are all downwardly profiled with a long run ahead of them before they can see a bullish turn.
The ETH/USD pair yesterday had net inflows of $4.6K while the net calculation for the last seven days stands at -$90.532.
As for the number of active addresses, it has added more than 158K (+0.19%) in the week and has reached the figure of 82 Million active addresses.
Above the current price, the first resistance level is at $150, then the second at $155 and the third one at $160.
Below the current price, the first support level is at $140, then the second at $130 and the third one at $125.
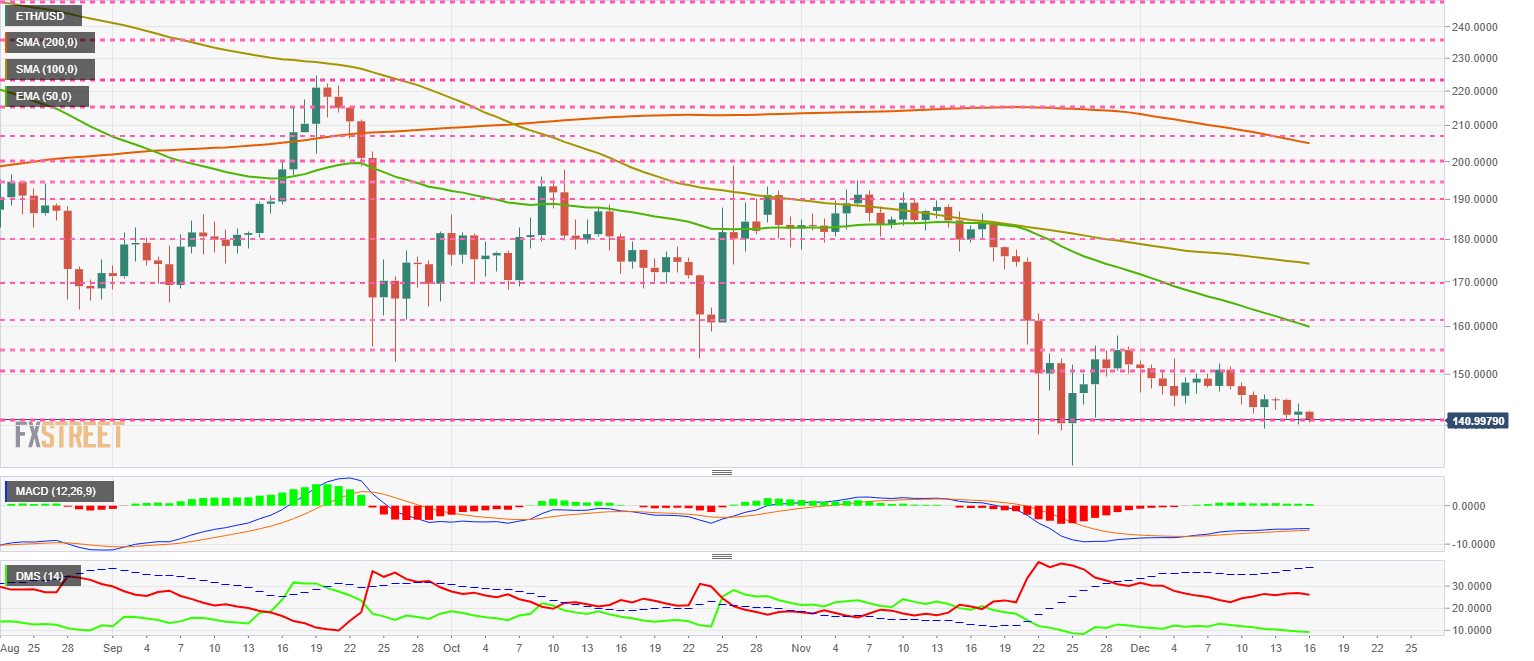
The DMI on the daily chart shows bears following a bearish pattern, while bulls reaching deficient levels could encourage an unexpected rebound in the next few days.
XRP/USD Daily Chart
The XRP/USD pair is currently trading at the $0.2123 (-2.39%) price level and follows the game of its podium mates. The weakness of the XRP is even more devastating than in the case of Bitcoin or Ethereum. During the upward movements, the XRP has been decoupled and has not given many joys to its holders.
The XRP/USD pair yesterday saw net capital outflows of more than $40.5K, with an accumulated weekly net sales of $127 Million.
Above the current price, the first resistance level is at $0.22, then the second at $0.24 and the third one at $0.255.
Below the current price, the first support level is at $0.21, then the second at $0.20 and the third one at $0.19.
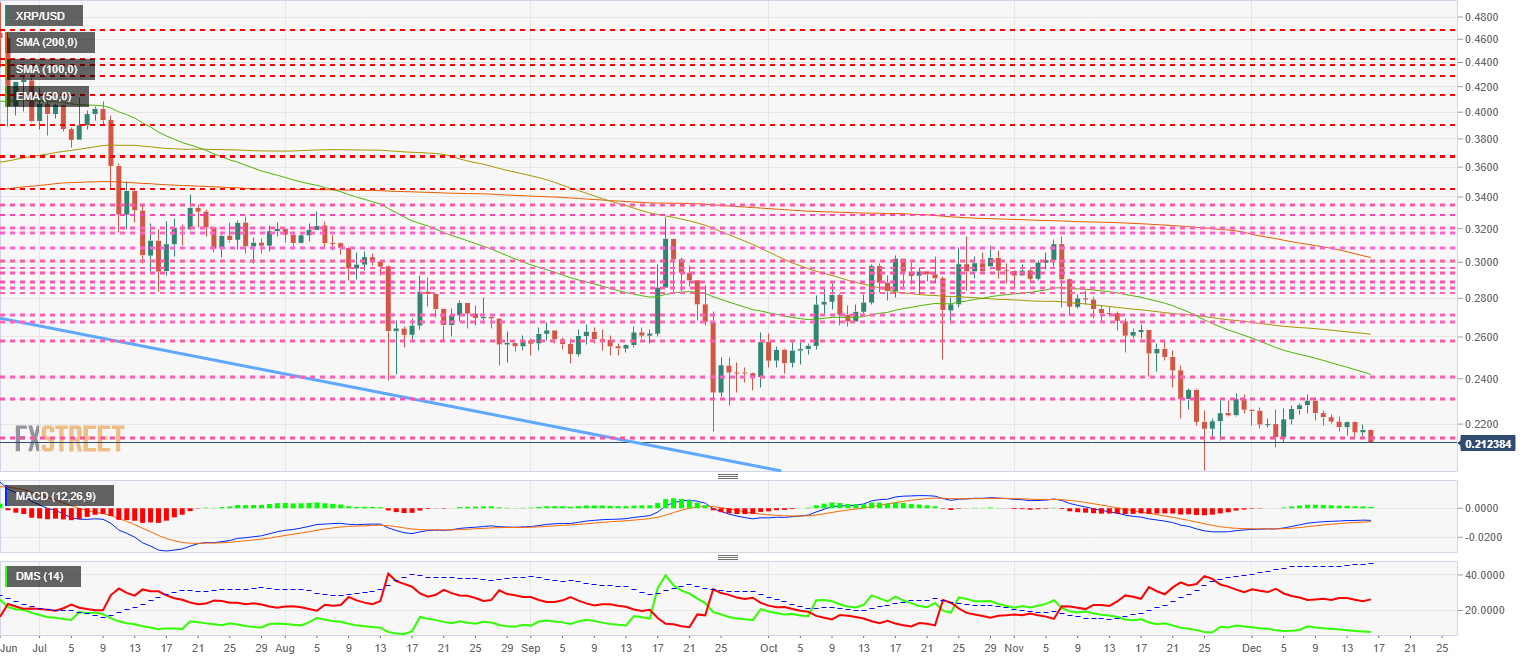
The DMI on the daily chart shows bears away from the dominance level but enjoying a healthy and active bearish trend as a result of the falls in early November. The bulls go back to minimum levels and open the door to a possible technical rebound.
Get 24/7 Crypto updates in our social media channels: Give us a follow at @FXSCrypto and our FXStreet Crypto Trading Telegram channel
Author

Tomas Salles
FXStreet
Tomàs Sallés was born in Barcelona in 1972, he is a certified technical analyst after having completing specialized courses in Spain and Switzerland. He expanded his technical training following the guidance of great experts on the financial markets.


