Top 3 Price Prediction Bitcoin, Ethereum, Ripple: Stand aside $50K, Bitcoin is on the way to $57K
- Bitcoin price beats the psychologically important $50,000, but a momentum divergence on the daily chart persists.
- Ethereum price prints new rally highs with the 61.8% Fibonacci retracement at $3,358 now in play.
- XRP quietly emerges from a symmetrical triangle continuation pattern on the intra-day charts, targets a 20% gain.

Bitcoin price closes with five consecutive positive weeks for the first time since November 2020 and is now up 20% for the month. Ethereum price was unable to log a fifth straight up week, but it is still up 31% for the month and 45% for Q3. XRP price closed last week down -4.52%. Since mid-July, it was the first negative weekly performance, but Ripple is still up 65% for August and 75% for 3Q.
Bitcoin price reaches milestone
Bitcoin price ended the brief pullback on August 19 with a bullish outside day and a close above the 200-day simple moving average (SMA) and the 2020 ascending trend line. BTC has continued the momentum with a surge into a new rally high and a test of $50,000, showing a 70% gain from the July 20 low.
During the July 20 low rally, a bullish theme has been the number of bullish outside days on the daily chart. There have been four, July 30, August 5, August 9 and August 19. Three of the four have emerged when Bitcoin price nears a short-term support level. It confirms the strength of the underlying bid when there is weakness.
Today’s jump above $50,000 increases the probability that Bitcoin price can rally to the 78.6% retracement at $57,173 before engaging fierce resistance shaped by the February, April and May highs. At that level, BTC investors can anticipate a deeper pullback and consolidation.
A bearish BTC factor that could interrupt the Bitcoin price journey higher is the persistence of the bearish momentum divergence on the daily Relative Strength (RSI), despite the new highs. A bearish momentum divergence occurs when the RSI does not confirm new price highs with a new high.
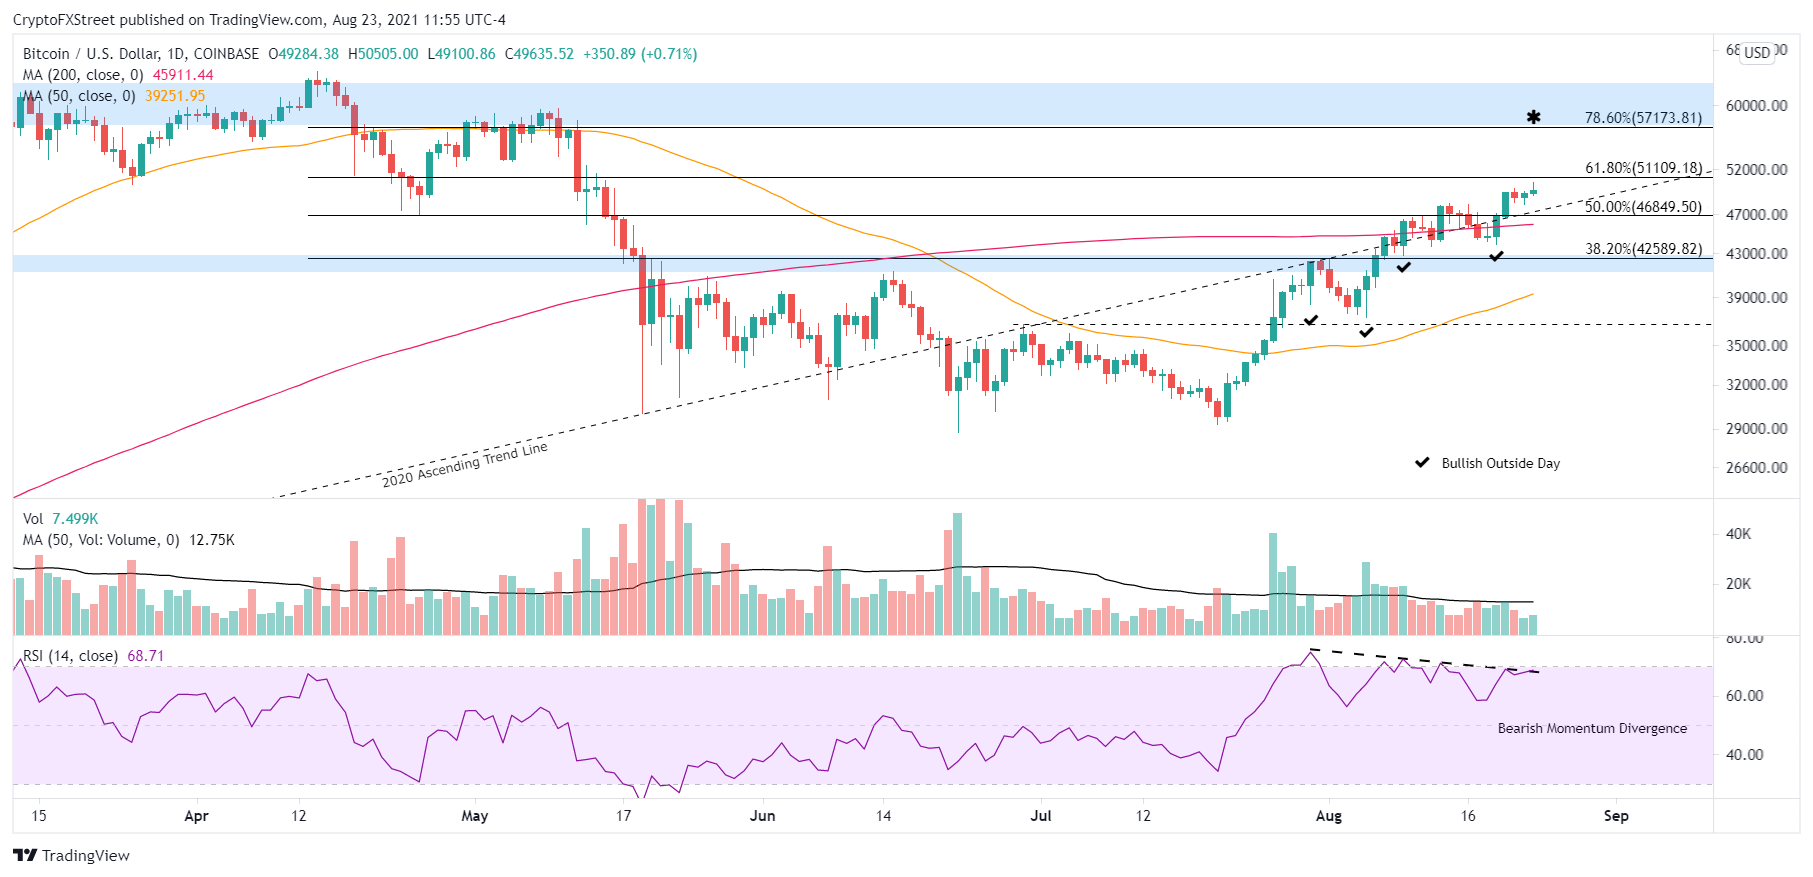
BTC/USD daily chart
Suppose the bearish momentum divergence becomes a headwind for Bitcoin price. In that case, it is well supported by the earlier trifecta of support between $41,500 and $43,000, which includes the January high, the February low, the June high, and the 38.2% retracement level at $42,589. Only a daily close below $41,500 would alter the bullish BTC narrative.
An interesting but favorable development for Bitcoin price is the amount of negative commentary toward BTC. The Santiment Weighted Sentiment for BTC is the most negative since July, despite the rise to $50,000.
Often when the sentiment is bearish while Bitcoin price is rallying, it projects higher prices for the bellwether cryptocurrency.
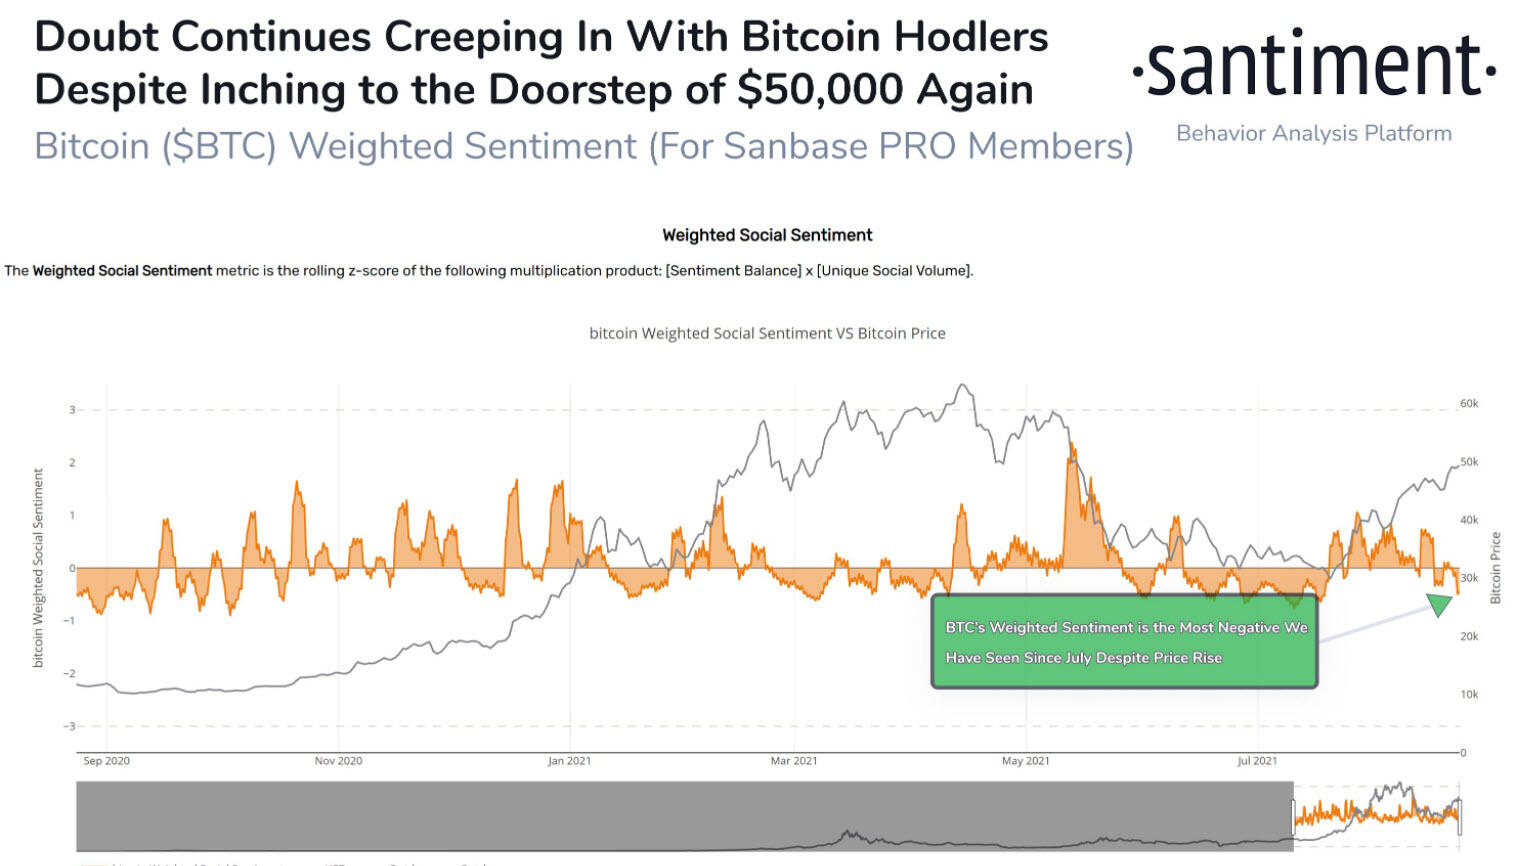
BTC weighted sentiment - Santiment
Here, FXStreet's analysts evaluate where the BTC trend will resolve.
Ethereum price trying to unlock key level
The Ethereum price consolidation has been in time versus price. Keeping the downside limited to -10% and confirming the previous resistance between $2,900 and $3,050 has become a new layer of support for the smart contracts giant.
Today, Ethereum price is attempting to resolve the consolidation to the upside, but it is finding strict resistance at the 61.8% retracement of the May-July correction at $3,358. The level is quickly followed by the important 261.8% Fibonacci extension of the 2018 secular correction at $3,587. If ETH beats those two resistance points, it is free to explore a new all-time high, including a jump to the 361.8% extension of the 2018 secular correction at $4,926.
A barrier to better Ethereum prices is the bearish momentum divergence on the daily RSI, indicating a weakening of the demand for the smart contracts giant. The daily RSI is trying to break the divergence today, but the ETH gains need to hold into the session close.
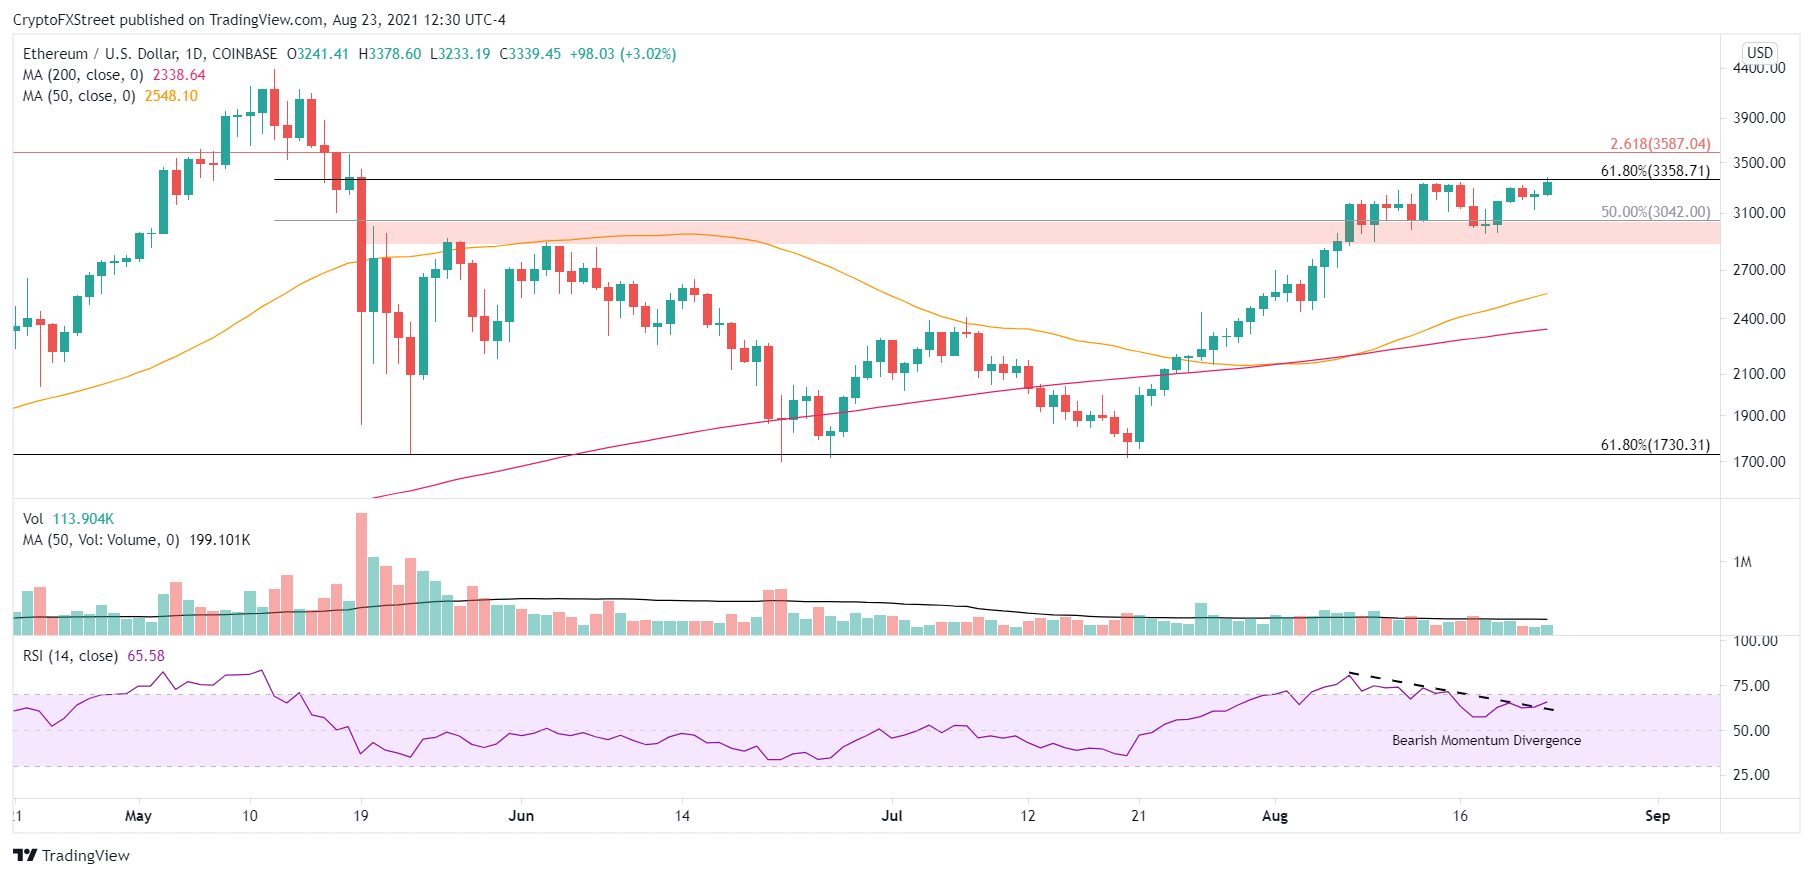
ETH/USD daily chart
The $2,900-$3,050 range must be durable support for the bullish narrative to be sustained. An Ethereum price close below on a daily basis exposes ETH to a test of the rising 50-day SMA at $2,548 or the 200-day SMA at $2,322, signaling a more complex and lengthy bottoming process for ETH.
The Ethereum price rally has disposed of many bearish forecasts for a retest of the July lows. Instead, ETH has opted to correct in time versus price, demonstrating a faithful interest in the digital token. If the commitment and emotion behind Ethereum price are sustained, ETH could reach the 361.8% extension of the 2018 secular correction at $4,926 before the end of the year. It would be an 80% move from the current price.
It is a reasonable projection in light of the 100% rise off the July lows and the 100% rally over twenty sessions on the way to the May high.
Here, FXStreet's analysts evaluate what ETH must do to advance to $5,000.
XRP price finds a bullish rhythm
XRP price climbed 160% from the July 20 low to the August 15 high, busting the formidable resistance attributed to the inverse head-and-shoulders neckline and the 200-day SMA, driving Ripple to the 50% retracement of the April-July cyclical correction at $1.23.
The resulting consolidation shaped a symmetrical triangle continuation pattern between the 38.2% retracement and 50% retracement levels that XRP price is now trying to resolve to the upside.
The measured move of the symmetrical triangle is 22% from the descending trend line, projecting a price target of $1.54. A test of the measured move target of $1.54 would break the resistance defined by the 61.8% retracement at $1.40 and position Ripple close to the 78.6% retracement at $1.65.
The upcoming Golden Cross pattern on the daily chart will work to the advantage of the new breakout from the symmetrical triangle.
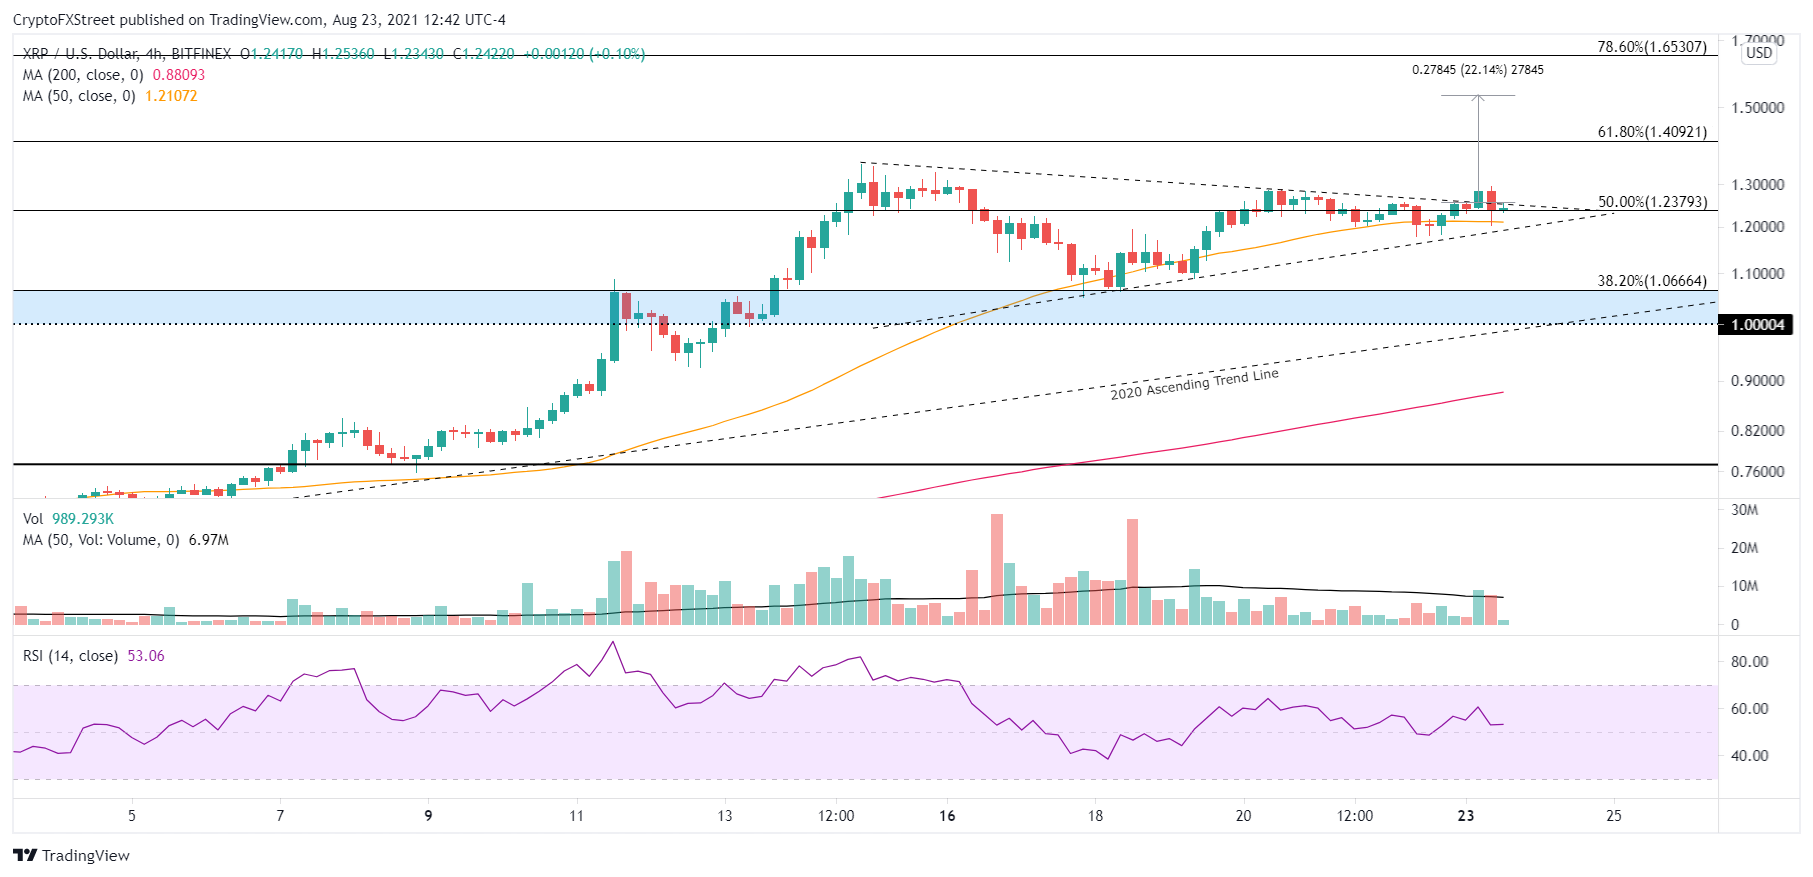
XRP/USD 4-hour chart
The benefit of the consolidation is that Ripple has released some of the price compression generated by the 160% advance. The daily RSI has fallen out of the overbought territory, creating the space for a new buying surge to carry XRP price higher.
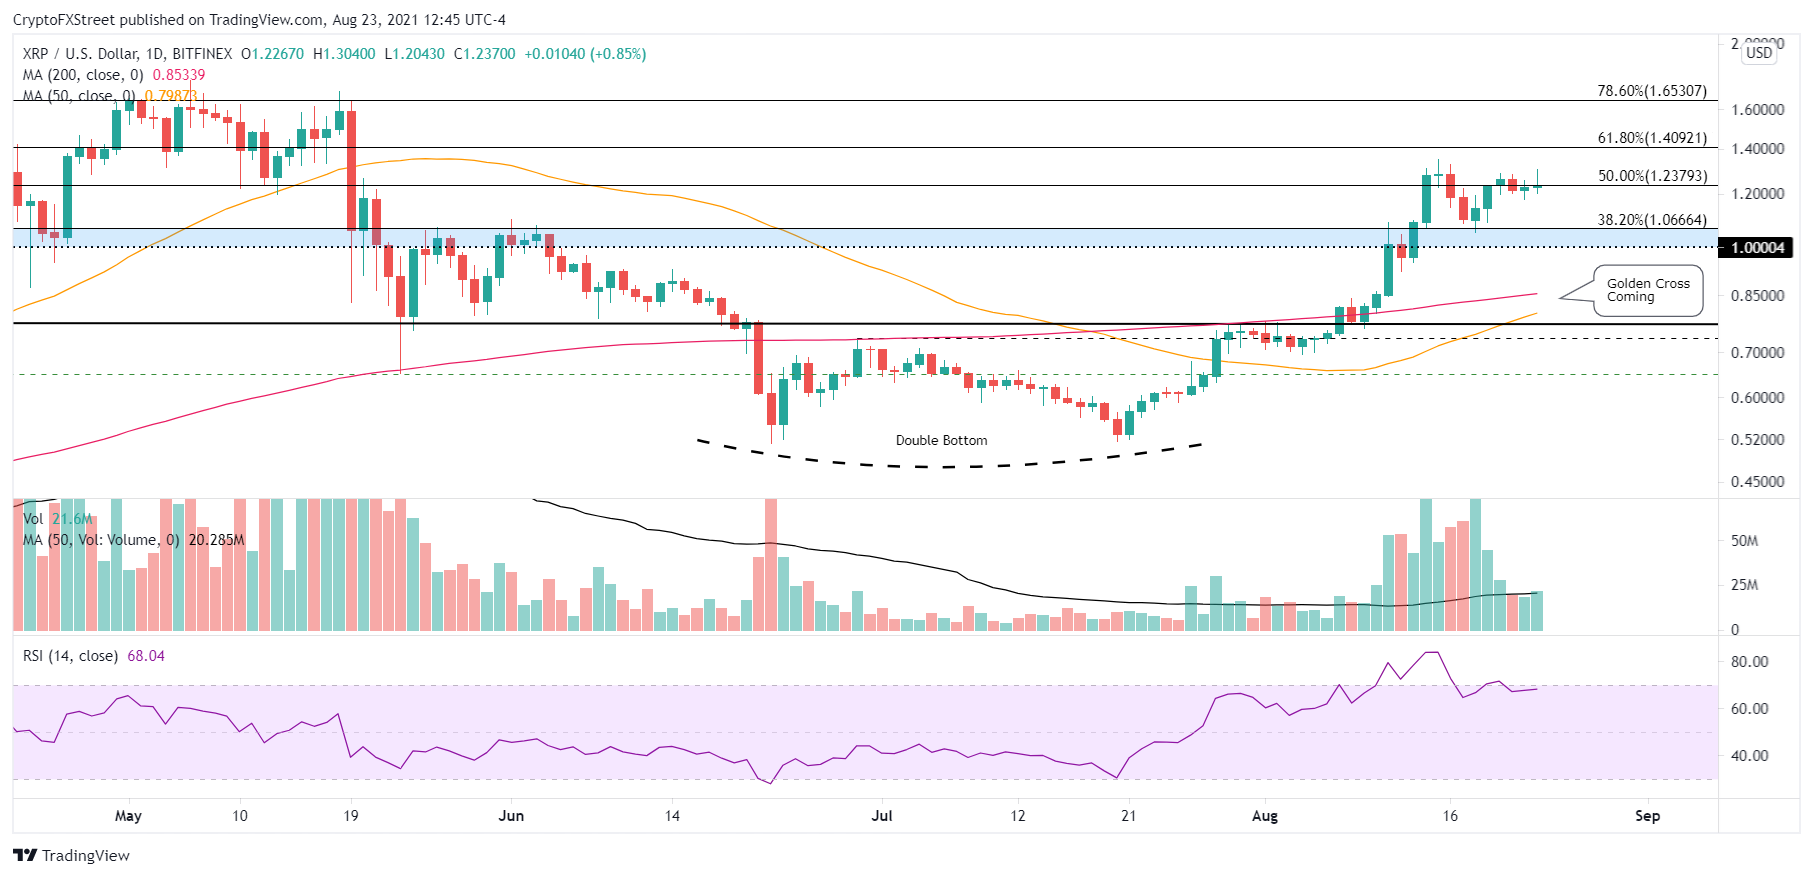
XRP/USD daily chart
Essential to the positive outlook for XRP is the strength of the $1.00-$1.06 support. A daily close below would introduce a relevant bearish twist that may jeopardize the rally’s sustainability. Downside Ripple targets include the 200-day SMA at $0.84 and the 50-day SMA at $0.78.
The developing breakout for Ripple reflects the bullish posture exhibited by XRP price, including the discovery of support at a crucial support range, releasing the price compression and plotting a constructive continuation pattern with the symmetrical triangle.
Here, FXStreet's analysts evaluate where Ripple could be heading next as it seems primed to breakout.
Author

Sheldon McIntyre, CMT
Independent Analyst
Sheldon has 24 years of investment experience holding various positions in companies based in the United States and Chile. His core competencies include BRIC and G-10 equity markets, swing and position trading and technical analysis.


