Ethereum price trend is your friend, ETH targets $4,900 by year’s end
- Ethereum price maintains support near the 50% retracement at $3,042.
- ETH flashes a bearish momentum divergence on the daily Relative Strength Index (RSI) for the first time since February.
- Ethereum price currently shows a 41.08% gain for 3Q, marking the seven consecutive positive quarter.

Ethereum price climbed almost 100% from July 20 low to the August 16 high before stalling at the 61.8% Fibonacci retracement of the May-July decline at $3,358. The rally’s strength led to four consecutive positive weeks, putting the run in the top range of four-week returns since 2018. The resulting correction has been in time versus price, with the drawdown only reaching 11.69% to date and positioning ETH for higher prices in the weeks ahead if the cryptocurrency complex cooperates.
Ethereum price resilience frustrates plans for a big correction
Ethereum price is on pace to close with seven consecutive positive quarters, despite correcting 60% from the May high. The resilience of the secular uptrend continues to frustrate the bearish forecasts of at least a deep correction and possibly a retest of the correction low at $1,700.
The recent, successful test of the $2,900-$3,050 Ethereum price range, framed by the late May and early June highs and the 50% retracement of the May-July correction at $3,042, cements it as a critical point for the sustainability of the developing rally.
The immediate potential for Ethereum price to reach the all-time high of $4,384 is threatened by the outstanding resistance of the 61.8% retracement at $3,358 and then the 261.8% Fibonacci extension of the 2018 secular correction at $3,587, a level that did influence the rally into the May high. Beyond those two levels, ETH is free to explore a new all-time high, including a move to the 361.8% extension of the 2018 secular correction at $4,926.
A headwind for Ethereum price is the bearish momentum divergence on the daily RSI as the index did not confirm the August price high with a new index high. It indicates that the underlying momentum has waned, questioning if the bounce from support has the requisite strength to break the momentum divergence when a new ETH high is printed.
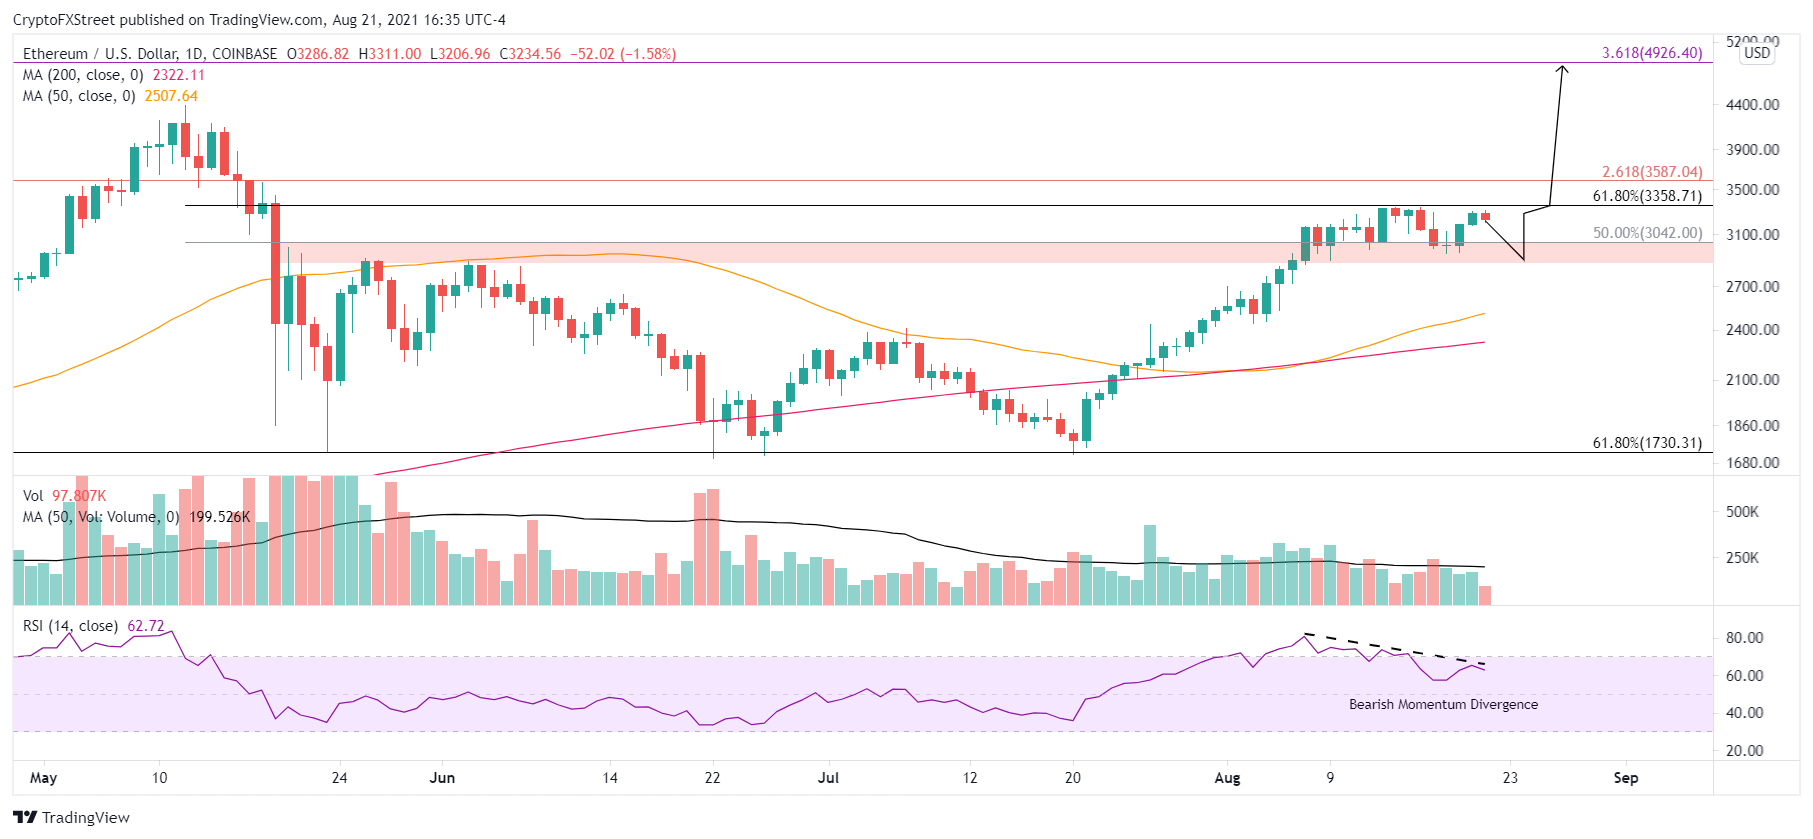
ETH/USD daily chart
It is critical for the bullish narrative that the $2,900-$3,050 range is durable support. An Ethereum price close below on a daily basis leaves ETH vulnerable to a test of the rising 50-day SMA at $2,507 or the 200-day SMA at $2,322, provoking a more complex bottoming process for the smart contracts giant.
Ethereum price thrust higher has disposed of many forecasts of a retest of the July lows. Instead, ETH has opted to correct in time versus price, demonstrating the underlying demand for the digital coin. If the interest is sustained, Ethereum price can reach the 361.8% extension of the 2018 secular correction at $4,926 over the next few months. It would be an 80% move from the current price. A reasonable projection considering ETH just jumped almost 100% and registered a 100% gain over twenty sessions on the way to the May high.
Here, FXStreet's analysts evaluate where ETH could be heading next as it tests crucial resistance level.
Author

Sheldon McIntyre, CMT
Independent Analyst
Sheldon has 24 years of investment experience holding various positions in companies based in the United States and Chile. His core competencies include BRIC and G-10 equity markets, swing and position trading and technical analysis.




