Top 3 Price Prediction Bitcoin, Ethereum, Ripple: S&P 500 vs Bitcoin, is it love or pure interest?
- Bitcoin and S&P 500 correlation is facing a shift that would affect the whole crypto market.
- The ETH/BTC pair, another market benchmark, could also move towards a new positive scenario for the crypto market.
- Bitcoin could reach $288K if the S&P 500 reached 4300, according to an analyst.

The crypto market continues to stress the relationship between Bitcoin and Ethereum, the latter now subject to much criticism because of the high transaction costs charged.
The emergence of multiple DeFi (Decentralized Finance) projects running on the ETH 1.0 network has congested the network and raised the cost for all users.
Bitcoin meanwhile is trying to break the ties with Wall Street, a relationship that became very intense since late 2017.
The spread indicator between the BTC/USD and the S&P 500 faces the superior resistance of the triangular-shaped compression figure that began after the bullish market ended in 2017.
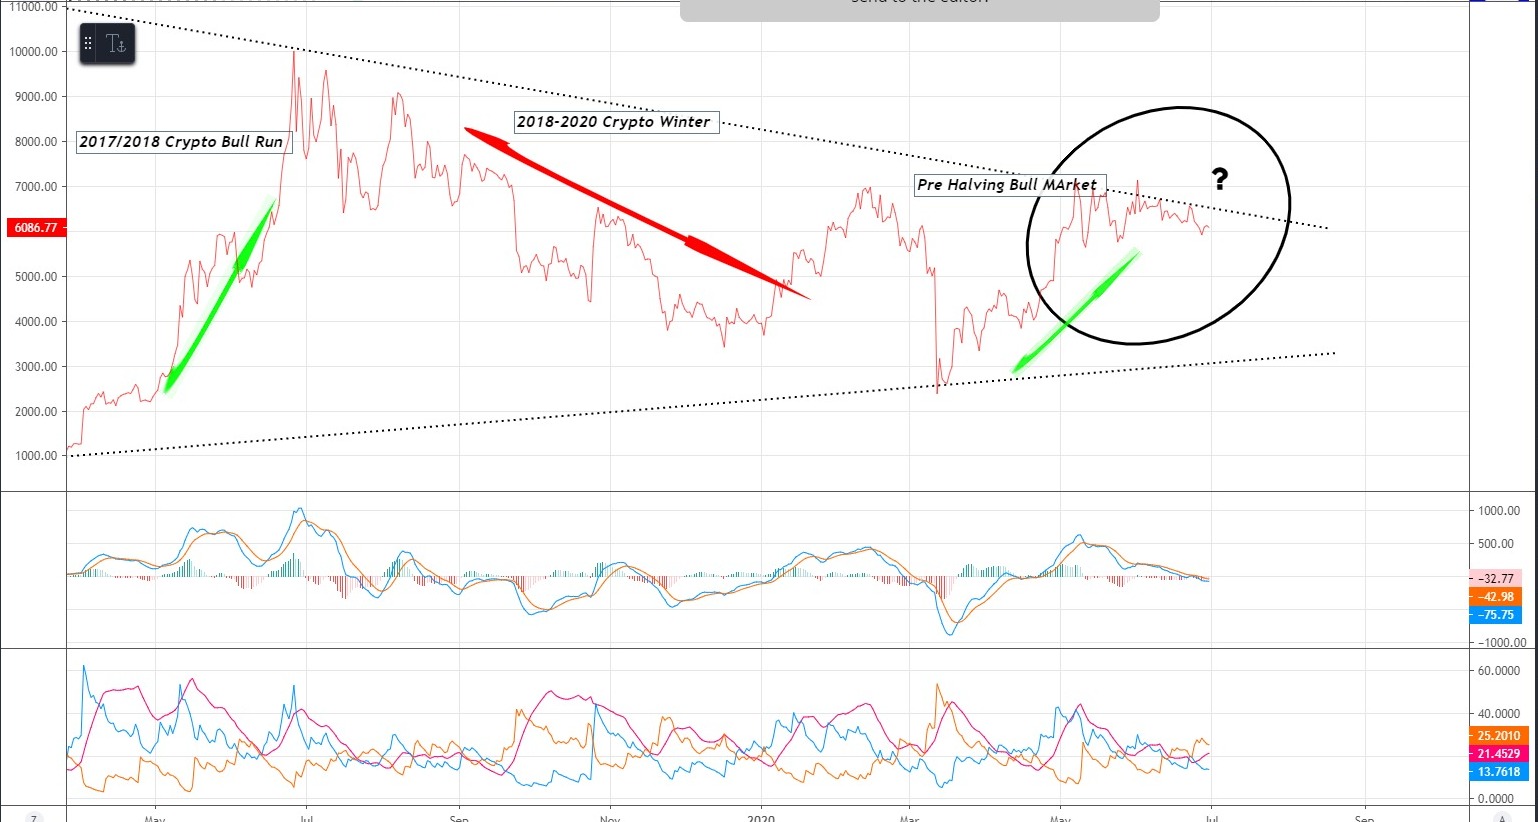
A technical upside break at the top of the triangle would open the possibility of a sharp increase in the value of Bitcoin.
On the opposite side, a downward movement of the spread line would imply falls in the equity markets and Bitcoin. When fear spreads among investors, and they get rid of the riskiest positions, cryptocurrencies are in the "high risk" category.
In March, we already saw the effect that the crash in the world's stock markets had on the value of the BTC/USD pair.
At the moment, the technical indicators applied to the simple spread would tend to be in a lateral downward movement. Still, there are options to move in the opposite direction.
The well-known twitter Plan B predicted this complicated relationship between Bitcoin and S&P 500.
#Bitcoin is scarce (measured by S2F) and people value it in line with gold & silver (in $)
— PlanB (@100trillionUSD) June 27, 2020
BTC is also correlated & cointegrated with S&P500. S&P 2x =BTC 416x (in $)
This can both be true! QE pumps stocks (cash flow) and BTC (scarcity): asset inflation in $. BTC$288K ~ S&P$4300 pic.twitter.com/Sgs0MBpCT2
According to Plan B, the effects of QE on asset valuations would push the S&P 500 index to 4300 points while Bitcoin, with a 208X correlation to the US index, would reach 288K.
ETH/BTC Daily Chart
The ETH/BTC pair is currently trading at the price level of 0.0247 and is in a similar technical situation to the BTC vs S&P Spread. This scenario is no coincidence since the relationship between Ethereum and Bitcoin also has an essential structural component in the Crypto market.
A combined upward break in the ETH/BTC pair along with a break in the BTC/USD vs S&P spread would be explosive for the market.
Above the current price, the first resistance level is at 0.025, then the second at 0.026 and the third one at 0.0276.
Below the current price, the first support level is at 0.0248, then the second at 0.0235 and the third one at 0.0225.
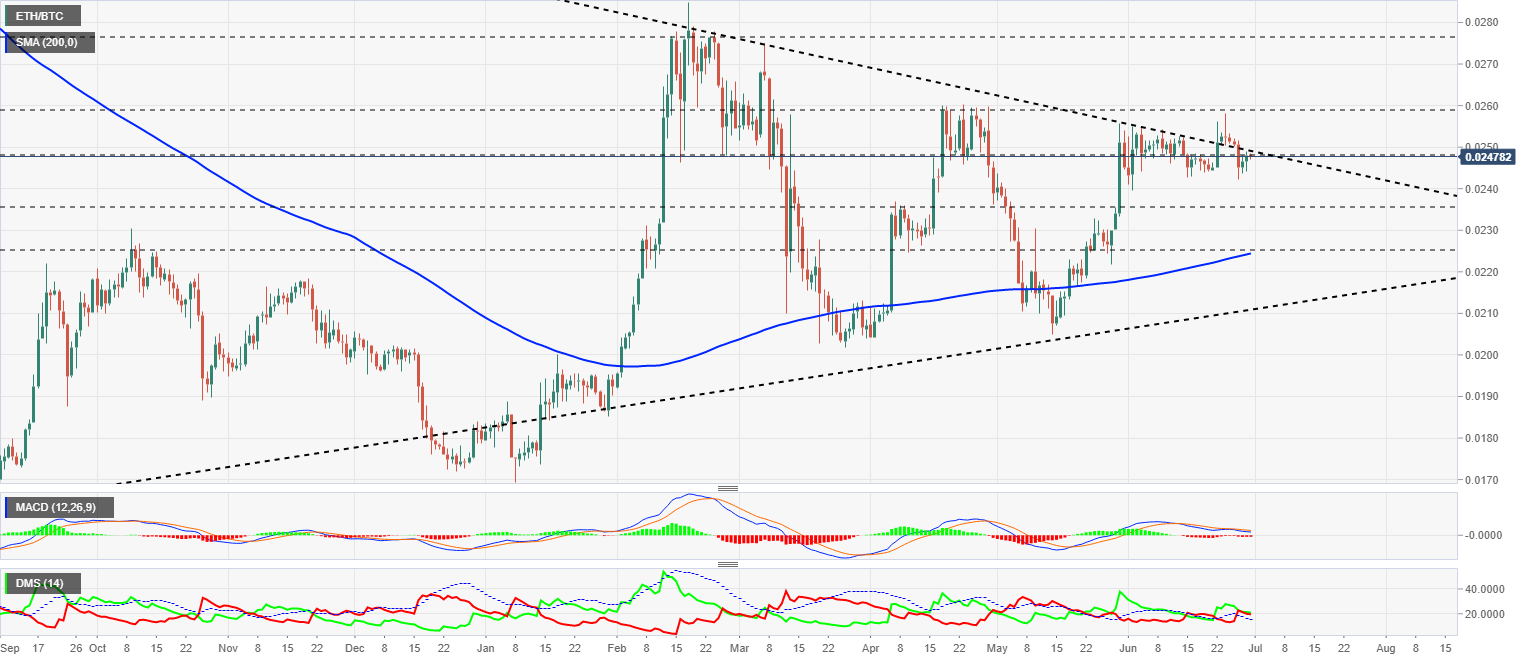
The MACD on the daily chart is improving the profile and is just a few points away from resuming the previous bullish cross.
The DMI on the daily chart shows a slight advantage for the bulls, but not enough to secure the position. The leadership in the ETH/BTC pair may change sides quickly.
BTC/USD Daily Chart
The BTC/USD pair is currently trading at the $9131 price level as it slides down another day following the previous bearish channel ceiling. It is vital for the BTC/USD not to breach this support level to avoid a major downward movement.
Above the current price, the first resistance level is at $9500, then the second at $10480 and the third one at $11350.
Below the current price, the first support level is at $8990, then the second at $8750 and the third one at $8350.
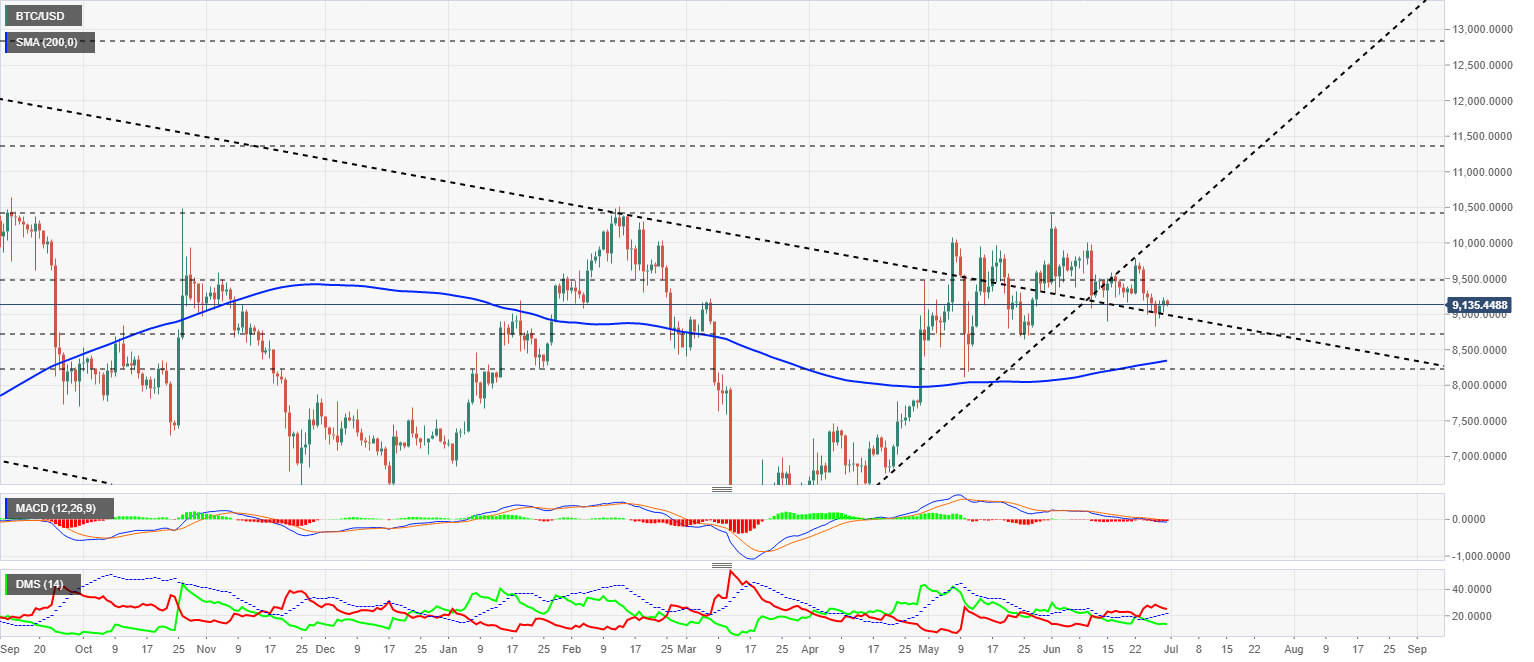
The MACD on the daily chart is entering the bearish zone at the bottom of the indicator, which could trigger some selling that could jeopardize the current situation.
The DMI on the daily chart shows the bears losing strength to the bulls, which are now moving upwards and reversing the trend of the past few days.
ETH/USD Daily Chart
The ETH/USD pair is currently trading at the $226.2 price level and is moving in the middle of the current scenario. The upper limit is at $260, while below the current price, the red line is around $140.
Above the current price, the first resistance level is at $235, then the second at $245 and the third one at $262.
Below the current price, the first support level is at $220, then the second at $200 and the third one at $190.
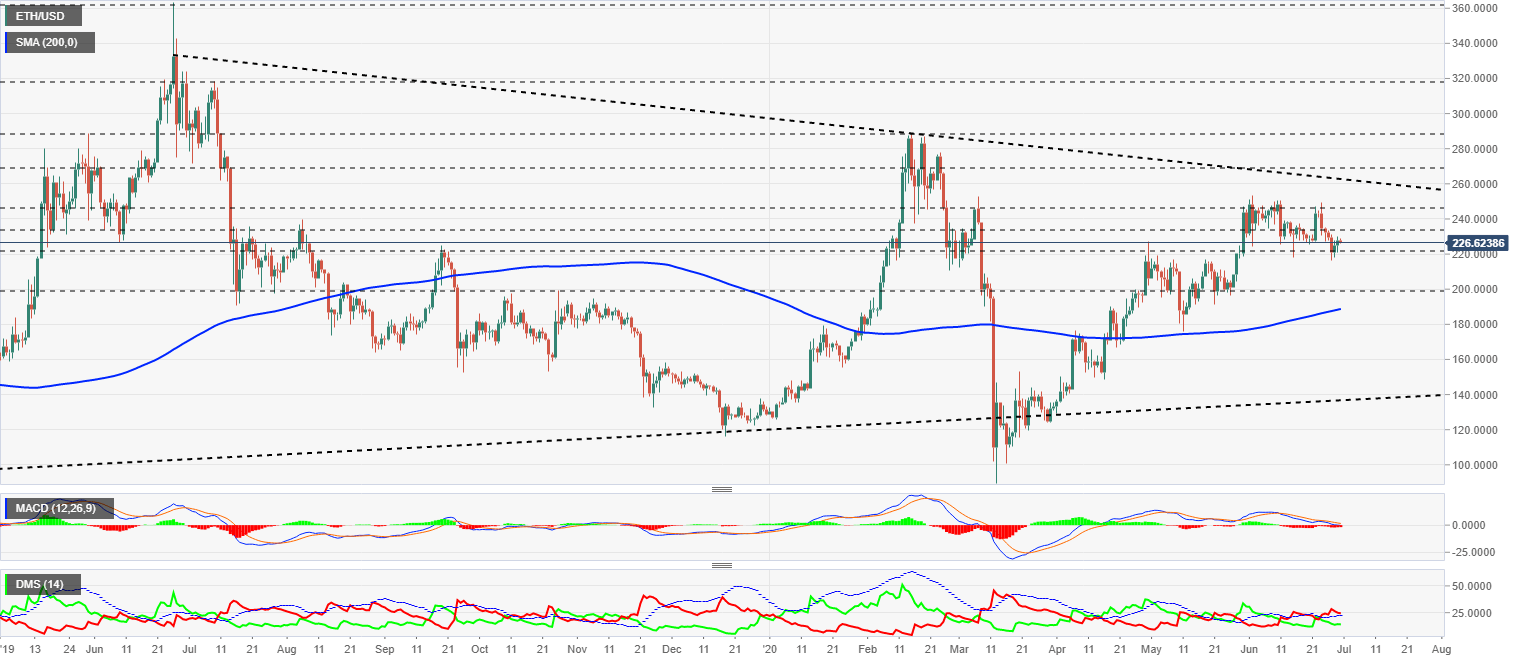
The MACD on the daily chart has grounded on the neutral level of the indicator, where you can find support to go back up.
The DMI on the daily chart shows bears looking for support on the ADX line. The bulls are moving slightly upwards but will need a few more days to have more visibility at the front.
XRP/USD Daily Chart
The XRP/USD pair is currently trading at the price level of $0.1764, floating almost magically between the last reliable support level and the gorge of the $0.10 level per Ripple. The technical situation is scary, and it seems like no one sees the elephant in the room.
Above the current price, the first resistance level is at $0.185, then the second at $0.192 and the third one at $0.20.
Below the current price, the first support level is at $0.164, then the second at $0.14 and the third one at $0.10.
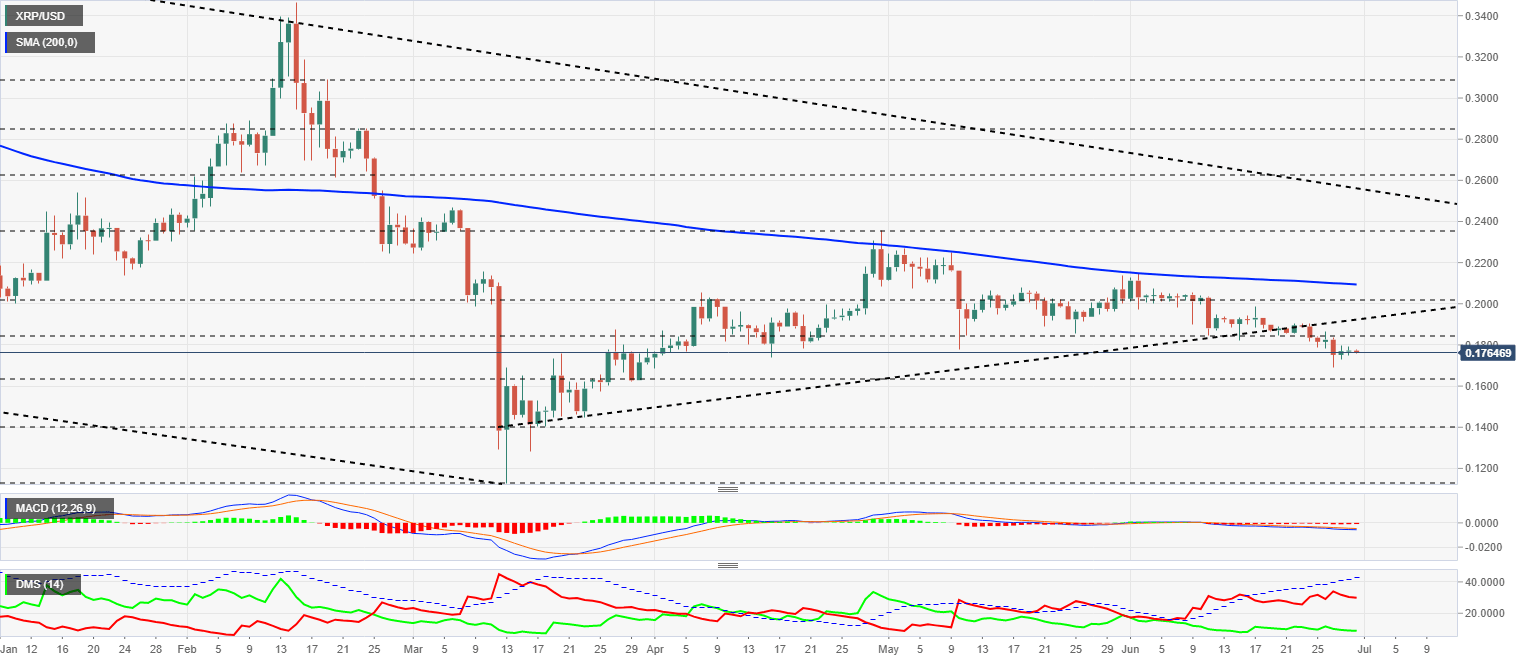
The MACD on the daily chart is flattening out again, just a few points below the neutral zone.
The DMI on the daily chart shows bears leading the pair, while bulls are showing no interest in taking the lead on XRP/USD.
Author

Tomas Salles
FXStreet
Tomàs Sallés was born in Barcelona in 1972, he is a certified technical analyst after having completing specialized courses in Spain and Switzerland. He expanded his technical training following the guidance of great experts on the financial markets.


