Top 3 Price Prediction Bitcoin, Ethereum, Ripple: Ready for a bull run in the cryptomarket?
- Ethereum shows a pattern comparable to the one seen in 2017 prior to the bullish outburst.
- Bitcoin is lagging behind but could catch up in the next sessions.
- Ripple follows the market and leaves behind the passivity of previous months.

Ethereum offers an impressive demonstration of strength. Unassisted by any other component of the Top 3, Ether is sustaining an upward trend that seemed to have entered a temporary pause.
Today, early in the Asian session, the relative high of the ETH/USD pair has been pulverized, and this move has also had a significant impact on its valuation against King Bitcoin. The ETH/BTC pair is currently trading at 0.0391, the same level seen in February 2019 before the bull run.
It's vital to keep in mind that all the bullish explosions in the crypto market have been led by Ethereum in its early stages and crowned by Bitcoin in the later stages. If the pattern seen in 2017 repeats itself, we could be on the verge of a vast bullish stampede.
The technical projection indicates that Bitcoin may move higher in the next few hours, perhaps after Ethereum reaches key resistance levels. Bitcoin needs to make up some ground and could take advantage of the gap opened by Ether to attempt an assault on the $12350 price level and from there to $14000.
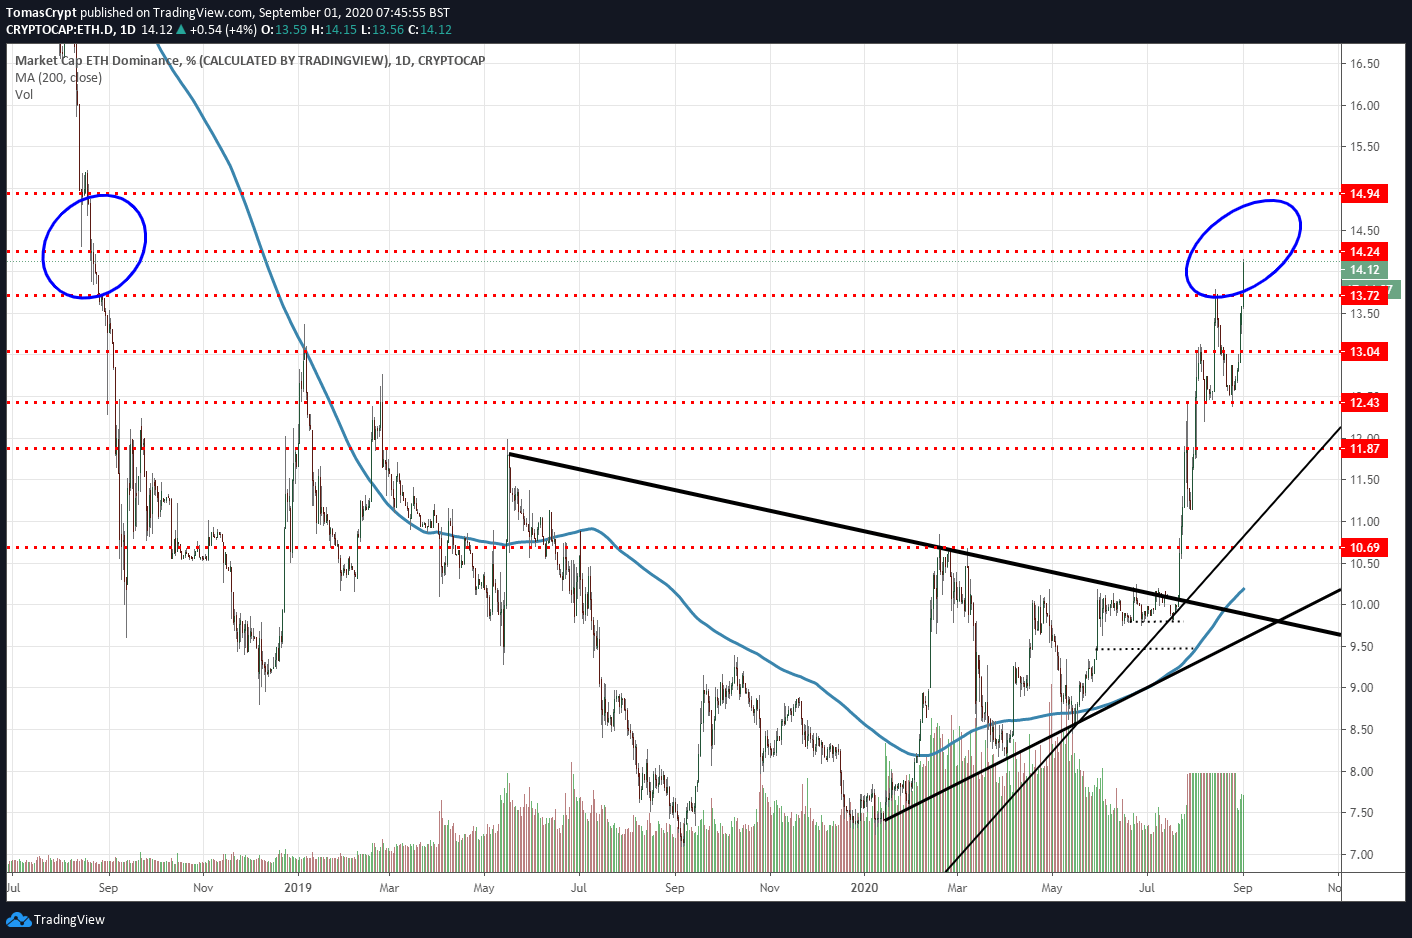
The dominance charts clearly show the substantial increase in market share of Ethereum, which is currently at levels not seen since August 2018.
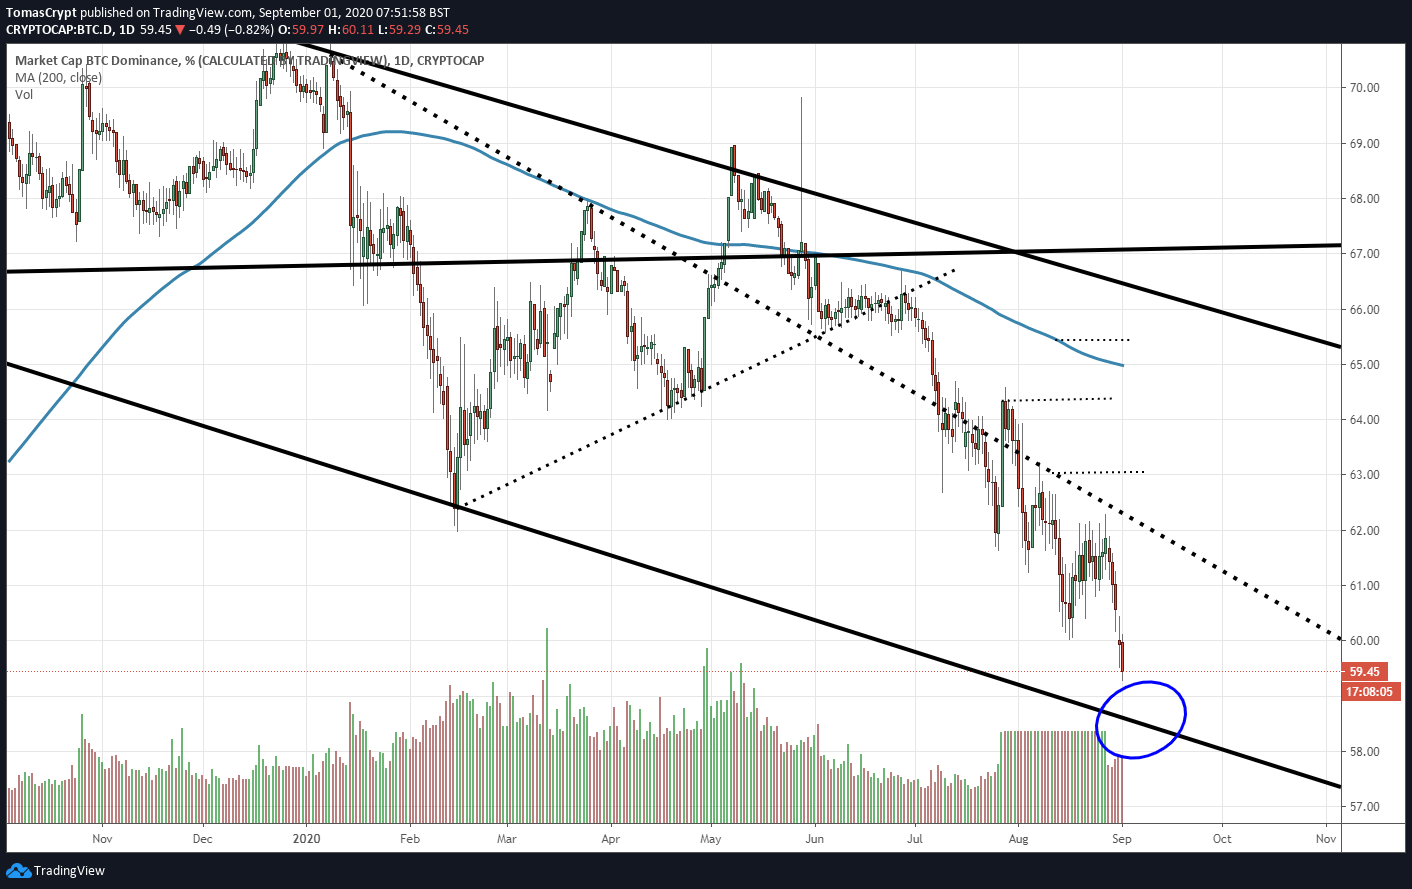
As far as Bitcoin is concerned, it continues to lose market share, although the end of the fall in the base of the current bearish channel is already in sight. The lower limit of this figure is at the 58.5 level of Bitcoin dominance, from the 69 dominance level it was at the beginning of May.
ETH/BTC Daily Chart
The ETH/BTC pair is currently trading at the price level of 0.03867 and is on the verge of the territory reserved for the stellar moments of the past. Above the current level, the gaps between resistances are increasing and the ease of moving upwards quickly as well.
Above the current price, the first resistance level is at 0.0394, then the second at 0.0425 and the third one at 0.0473.
Below the current price, the first support level is at 0.0381, then the second at 0.0367 and the third one at 0.0351.
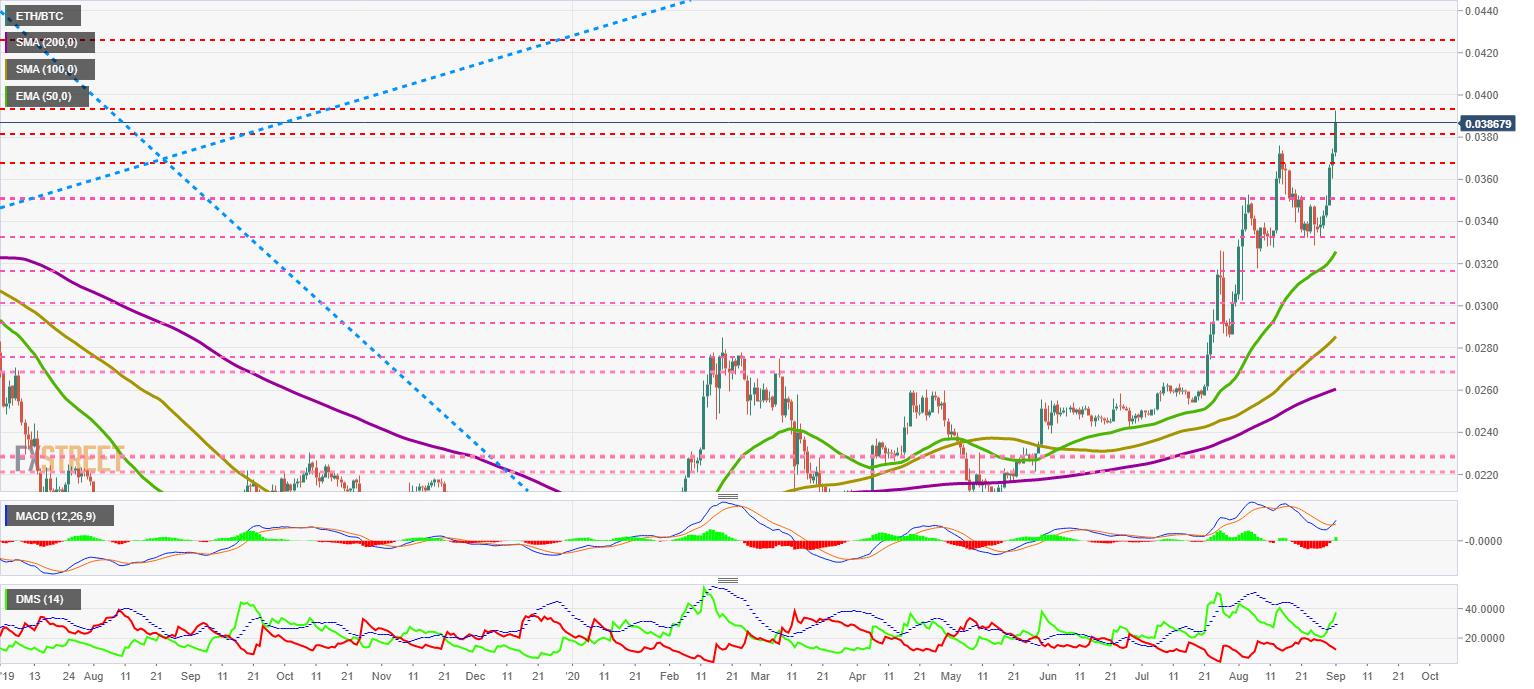
The MACD on the daily chart is crossing up again, and although the structure is not technically optimal, the upward force of Ethereum is huge, and the movement may consolidate over time.
The DMI on the daily chart shows the bulls in a ballistic trajectory towards the moon. The violence of the upward break of the ADX line carries the risk of violent pullbacks.
BTC/USD Daily Chart
The BTC/USD pair is currently trading at the price level of $11881. BTC/USD must react bullishly in the short term to counteract the strength shown by Ether.
Above the current price, the first resistance level is at $11250, then the second at $14000 and the third one at $17250.
Below the current price, the first support level is at $8750, then the second at $10690 and the third one at $10200.
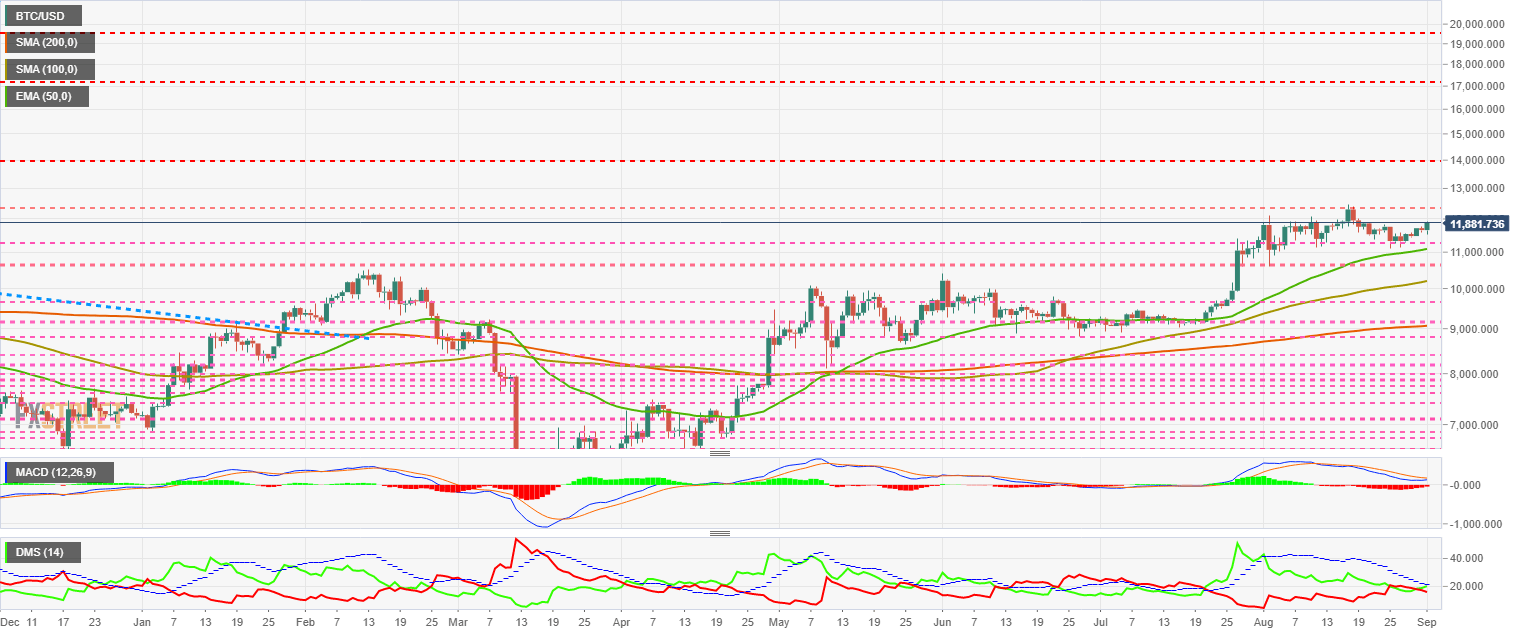
The MACD on the daily chart is in the process of crossing over to the upside again.
The DMI on the daily chart shows the bulls in a position to cross the ADX line upwards and activate the bullish phase again. Bears are still in a place close to the sell-side and even have options to take control of the pair.
ETH/USD Daily Chart
The ETH/USD pair is currently trading at the price level of $462.4 and marks a new relative high. The chances of breaking out of this price congestion resistance level are low.
Above the current price, the first resistance level is at $460, then the second at $480 and the third one at $520.
Below the current price, the first support level is at $385, then the second at $355 and the third one at $320.
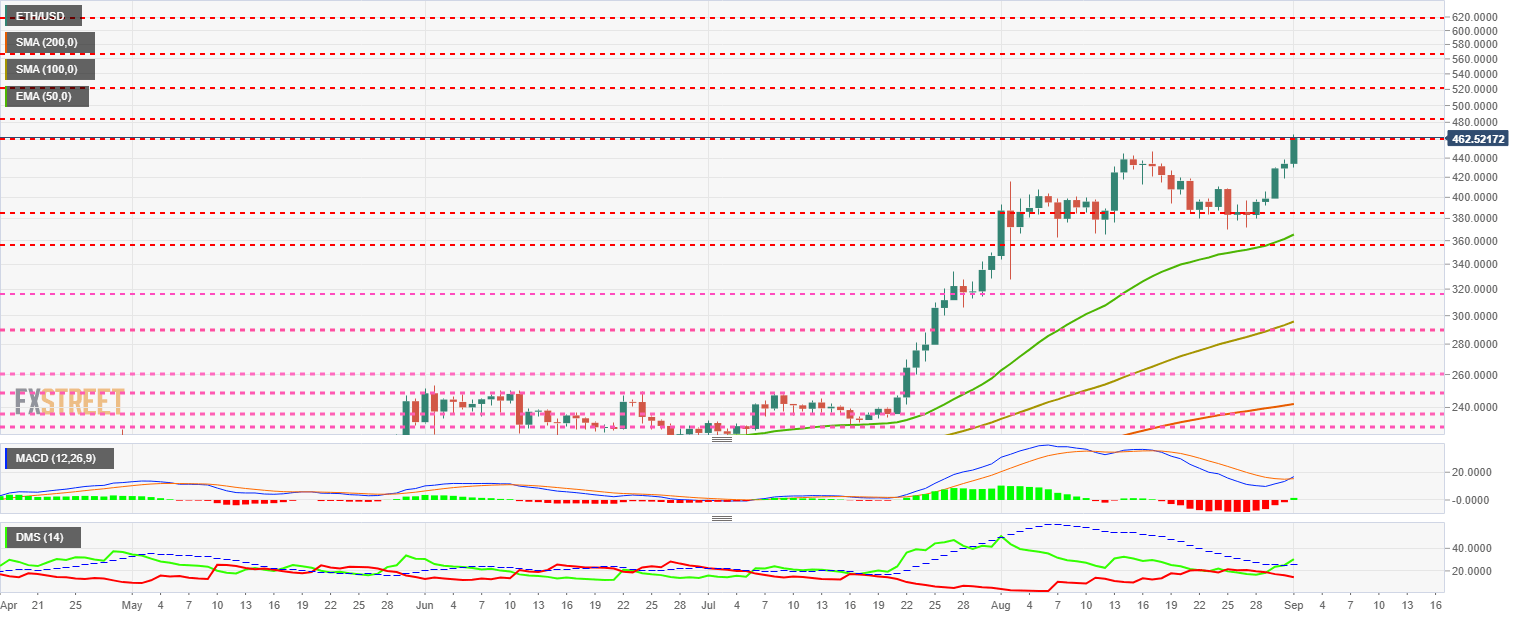
The MACD on the daily chart completes the bullish cross by the minimum and is in a weak position that is easy to reverse. It is necessary to consolidate the bullish cross.
The DMI on the daily chart shows the bulls crossing the ADX line upwards but does not yet enjoy a good advantage to take the achievement for granted. The bears are moving down and giving up the leadership of the ETH/USD pair.
XRP/USD Daily Chart
The XRP/USD pair is currently trading at a price level of $0.2950 and is adding to the bullish trend in the sector.
Above the current price, the first resistance level is at $0.30, then the second at $0.318 and the third one at $0.331.
Below the current price, the first support level is at $0.288, then the second at $0.283 and the third one at $0.267.
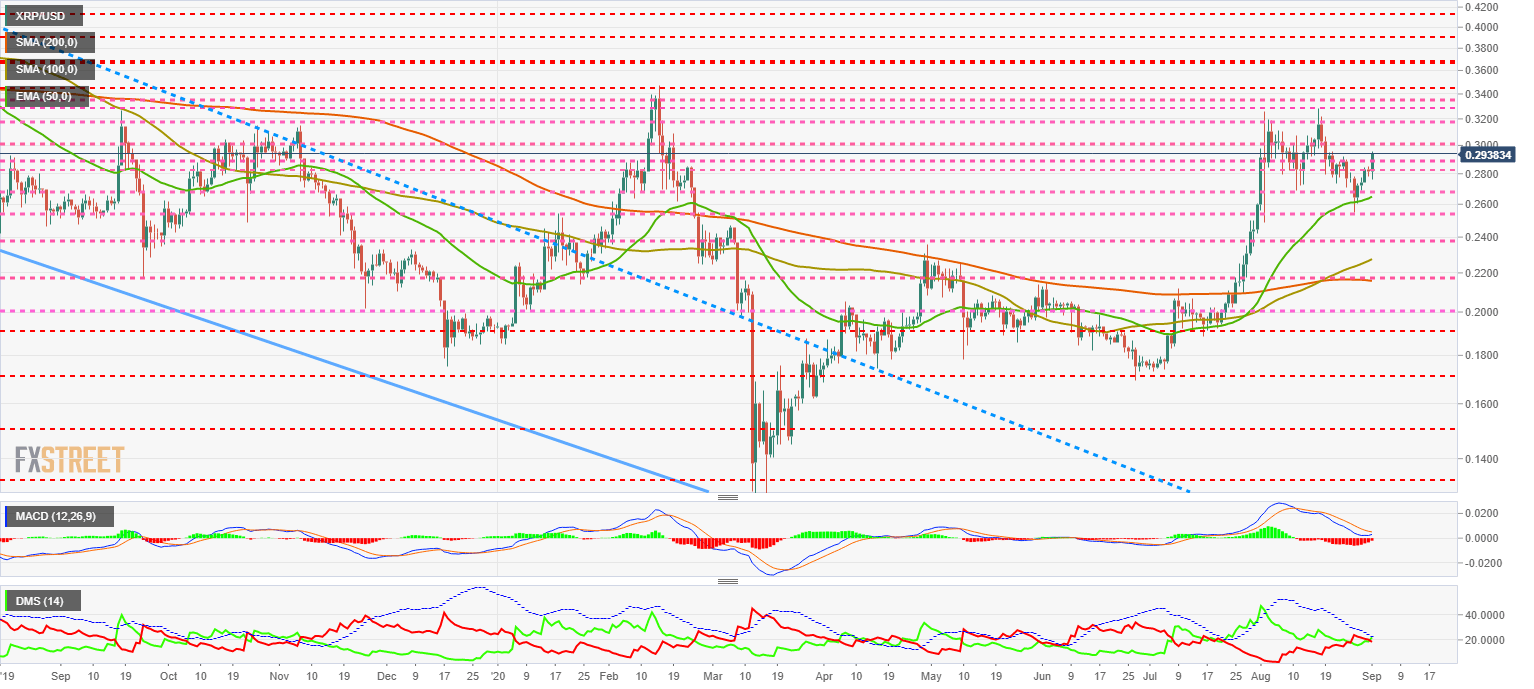
The MACD on the daily chart shows a bullish cross and may try to cross it again in the next few hours.
The DMI on the daily chart shows the bulls with a small advantage over the bears as they face a possible upward crossing of the ADX line. The difficulty that the buying side is facing is an excellent opportunity to show that Ripple has returned strongly to the board after months of hesitation.
Author

Tomas Salles
FXStreet
Tomàs Sallés was born in Barcelona in 1972, he is a certified technical analyst after having completing specialized courses in Spain and Switzerland. He expanded his technical training following the guidance of great experts on the financial markets.


