Top 3 Price Prediction Bitcoin, Ethereum, Ripple: Official start to recovery rally
- Bitcoin price prepares for its ascent to $42,100 after bouncing off a stable support level.
- Ethereum price needs to overcome the $3,000 barrier to have any chance at revisiting $3,500 or $4,000.
- Ripple price begins its journey to $0.70 after a recovery above the $0.60 support level.

Bitcoin price has kick-started its attempt to move higher, picking up Ethereum and Ripple along with it. Investors can expect BTC to revisit Monday’s high and reevaluate directional bias from there.
Bitcoin price begins its journey higher
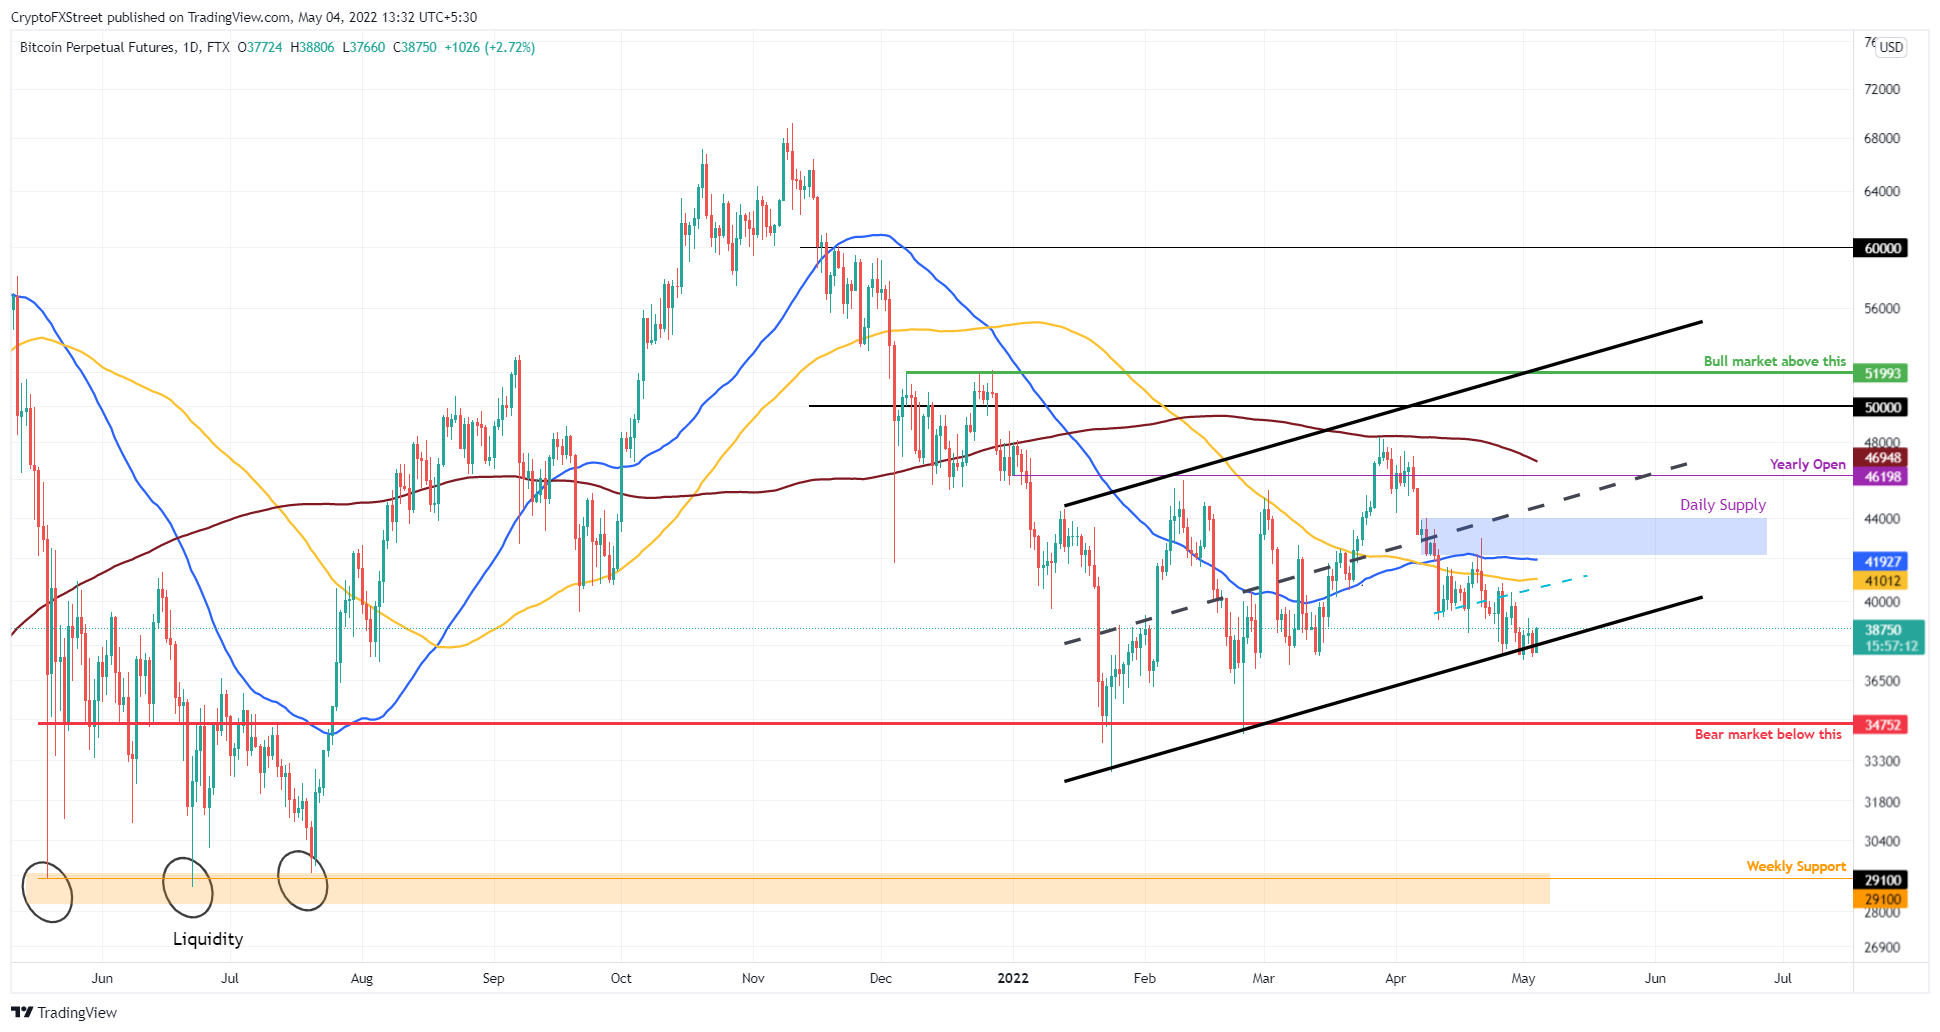
Bitcoin price bounces off the lower trend line of the ascending parallel channel, which is formed after drawing trendlines above and below three sets of higher highs and higher lows. Investors can expect BTC to slice through the 100-day Simple Moving Average (SMA) at $41,009, which is the first major hurdle.
Doing so, will allow it to retest the 50-day SMA at $41,921, which coincides with the daily supply zone, extending from $43,981 to $41,921. This area of confluence is where the upside will be capped for the big crypto and would represent a 10% gain.
BTC/USDT 3-day chart
Regardless of the bullish outlook, a daily candlestick close below the $34,752 support level will invalidate the bullish thesis and trigger a crash to $30,000 or lower.
Ethereum price to reverse the trend
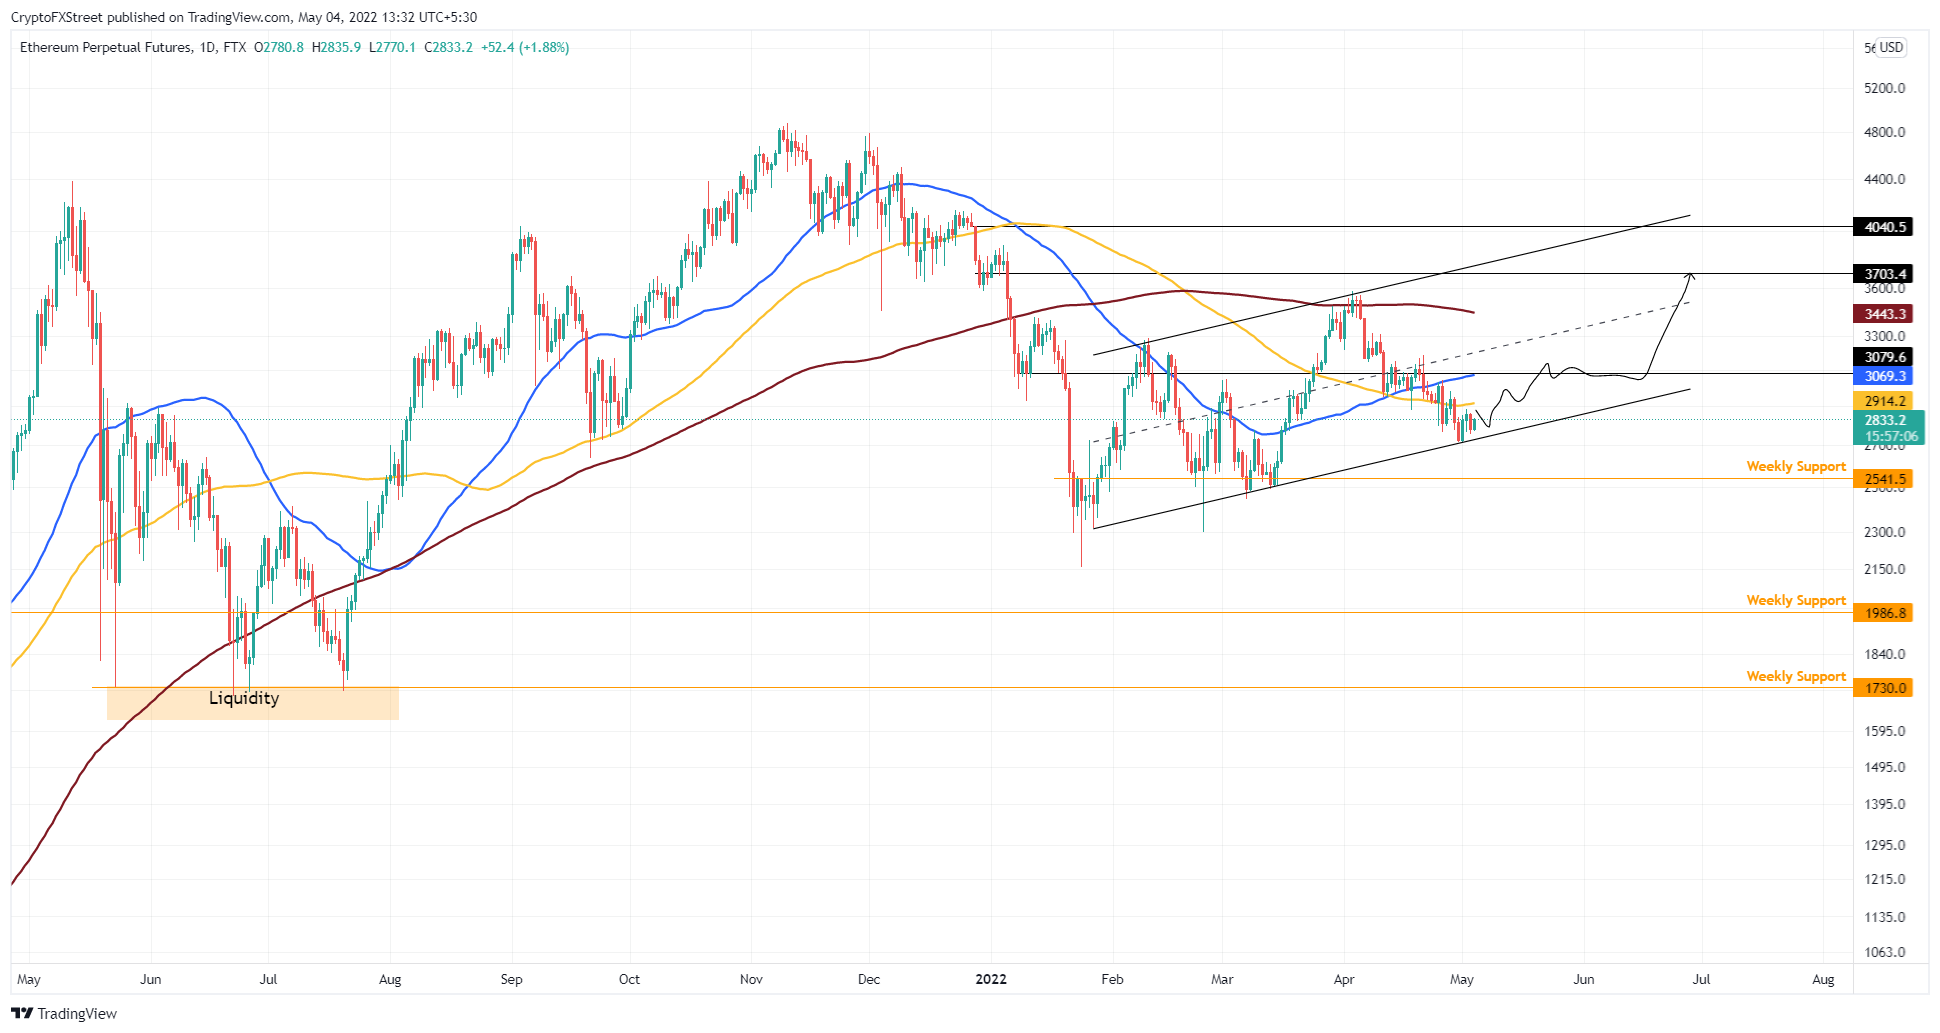
Ethereum price is in a medium-term ascending channel created by connecting its two higher highs and three higher lows since January 28.
The third retest of the lower trend line has shown a bullish reaction – lead cryptocurrency BTC is recovering and influencing the rest of the market. Regardless of the bullishness, ETH needs to flip the 100-day SMA at $2,914 followed by the 50-day SMA at $3,069 to continue rising. This development is key to triggering a move that tags the 200-day SMA at $3,443.
While a move to $3,500 is likely, a surge in buying pressure could extend the run-up to the $4,000 psychological level.
ETH/USD 1-day chart
On the other hand, a daily candlestick close below the weekly support level at $2,541 will indicate a resurgence of selling pressure and invalidate the bullish thesis. This could trigger a further crash to the $2,000 psychological level.
Ripple price purges sell-side pressure
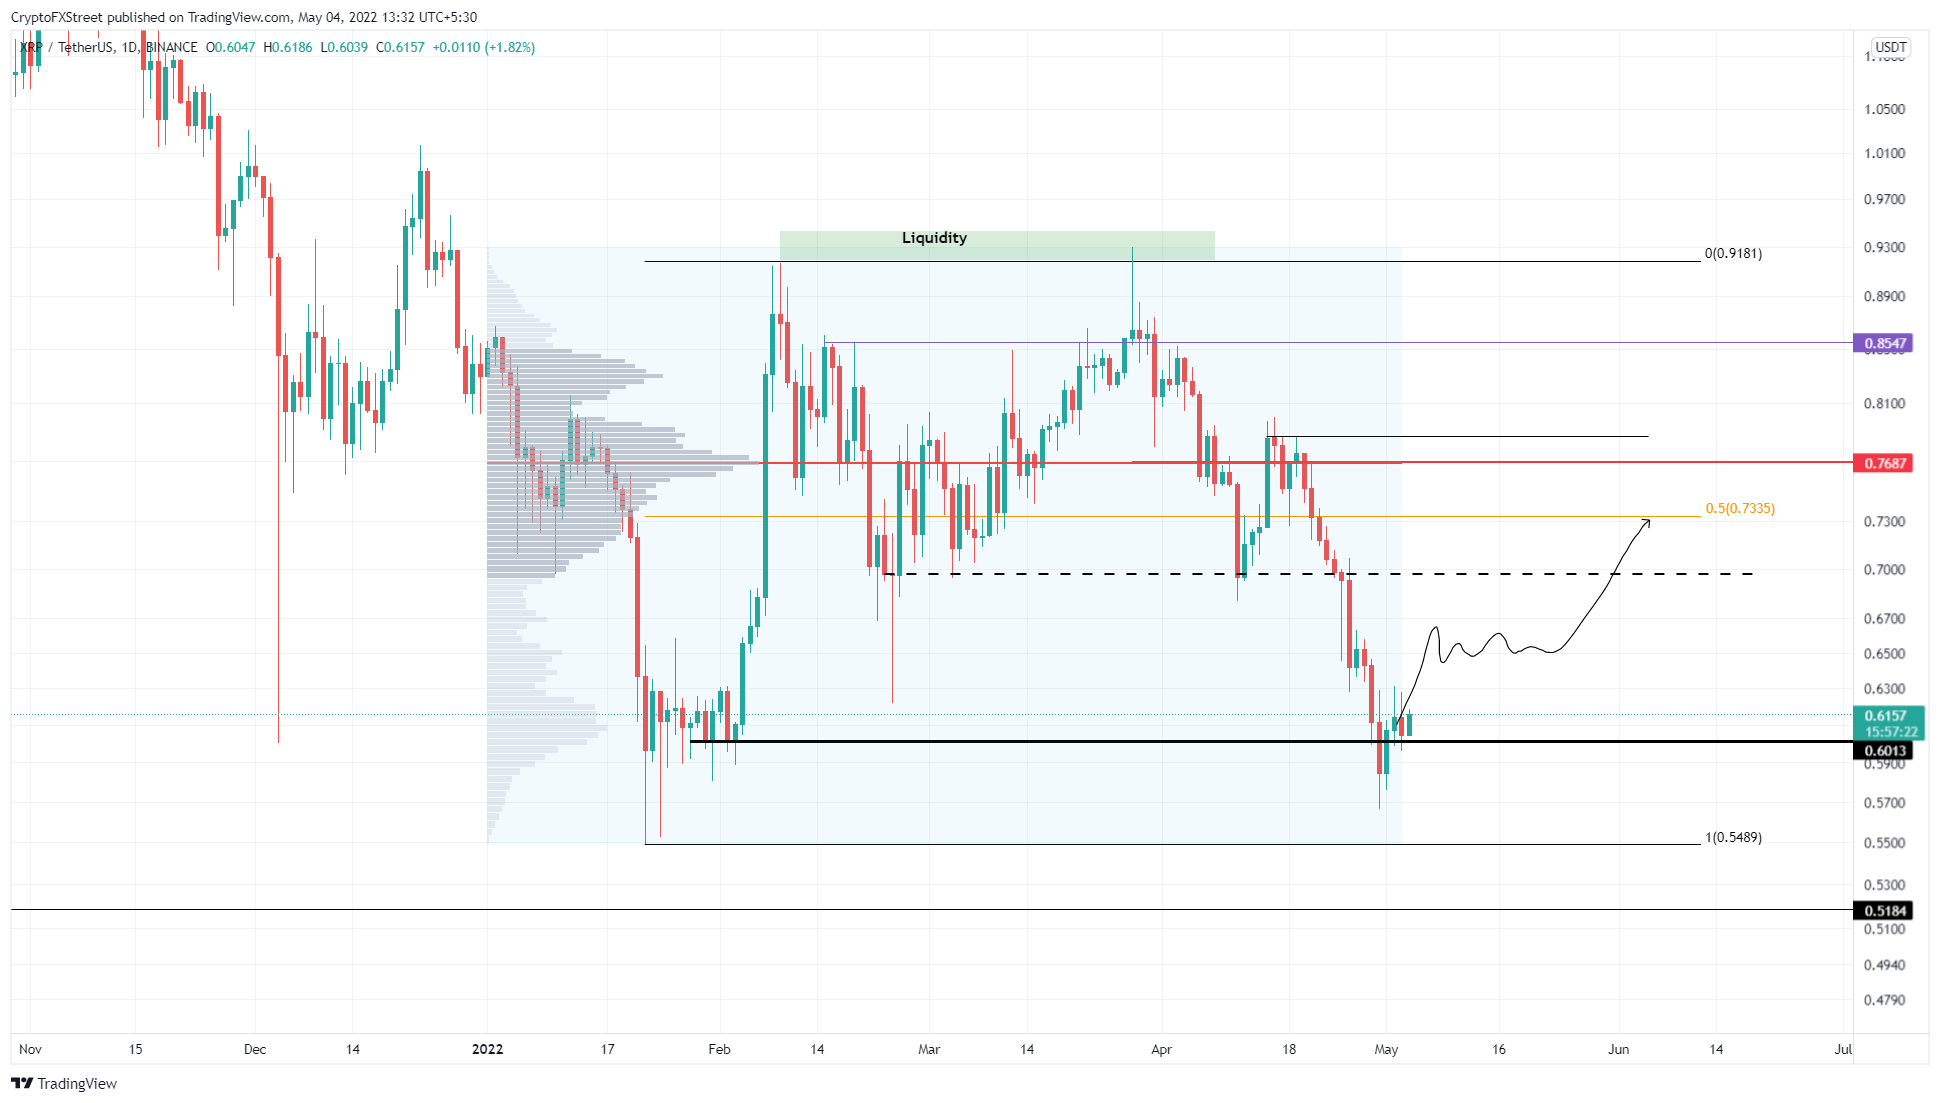
Ripple price purged the downside pressure by collecting the liquidity resting below the $0.60 support after a 30% crash. XRP price has since moved back above the said foothold, indicating that buyers are in control.
A resurgence of buying pressure is likely to propel XRP price up to the immediate hurdle at $0.696. Clearing this barrier will present two further resistance levels for Ripple bulls to overcome - the 50% retracement level at $0.735 and the 2022 volume point of control at $0.768.
For now, the market structure looks uncertain due to the choppiness of Bitcoin. Therefore, investors can expect a local top to form around $0.768, representing a 25% ascent from the current position at $0.615.
XRP/USD 1-day chart
A daily candlestick close below the $0.601 support level will produce a lower low and invalidate the bullish thesis. In such a case, XRP price is likely to crash to the $0.548 support level.
Author

Akash Girimath
FXStreet
Akash Girimath is a Mechanical Engineer interested in the chaos of the financial markets. Trying to make sense of this convoluted yet fascinating space, he switched his engineering job to become a crypto reporter and analyst.



