Top 3 Price Prediction Bitcoin, Ethereum, Ripple: No hint of who is going to break first
- Market sentiment improves by 40% but remains in a fear zone.
- Ether and Bitcoin continue the fight for dominance in the cryptocurrency segment.
- Bitcoin halving and the migration of the Ethereum network to version 2.0 will set off a revolution in the crypto mining industry.

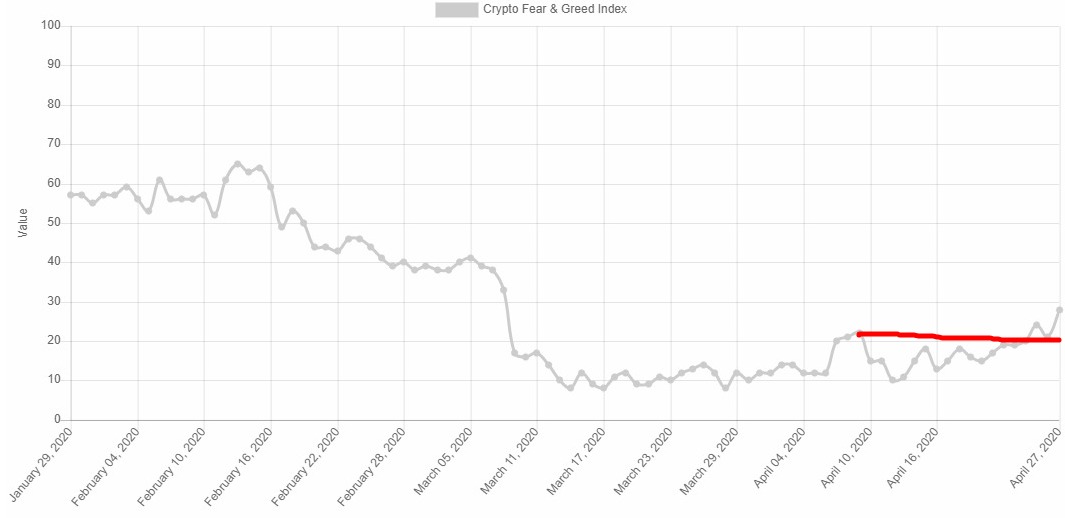
The crypto board continues to be in full swing, and market sentiment is improving by almost 40% but remains at fear levels.
More important than the level reached today is the exciting fact that the sentiment chart produced by alternative.me has breached the extreme fear range it was in since last March.
The crypto market dominance charts show weakness on the Ethereum side, which continues to consolidate the level reached in recent days. The current dominance level for the Altcoins leader is 9.53 points while the highest resistance line is currently at 10.4 points.
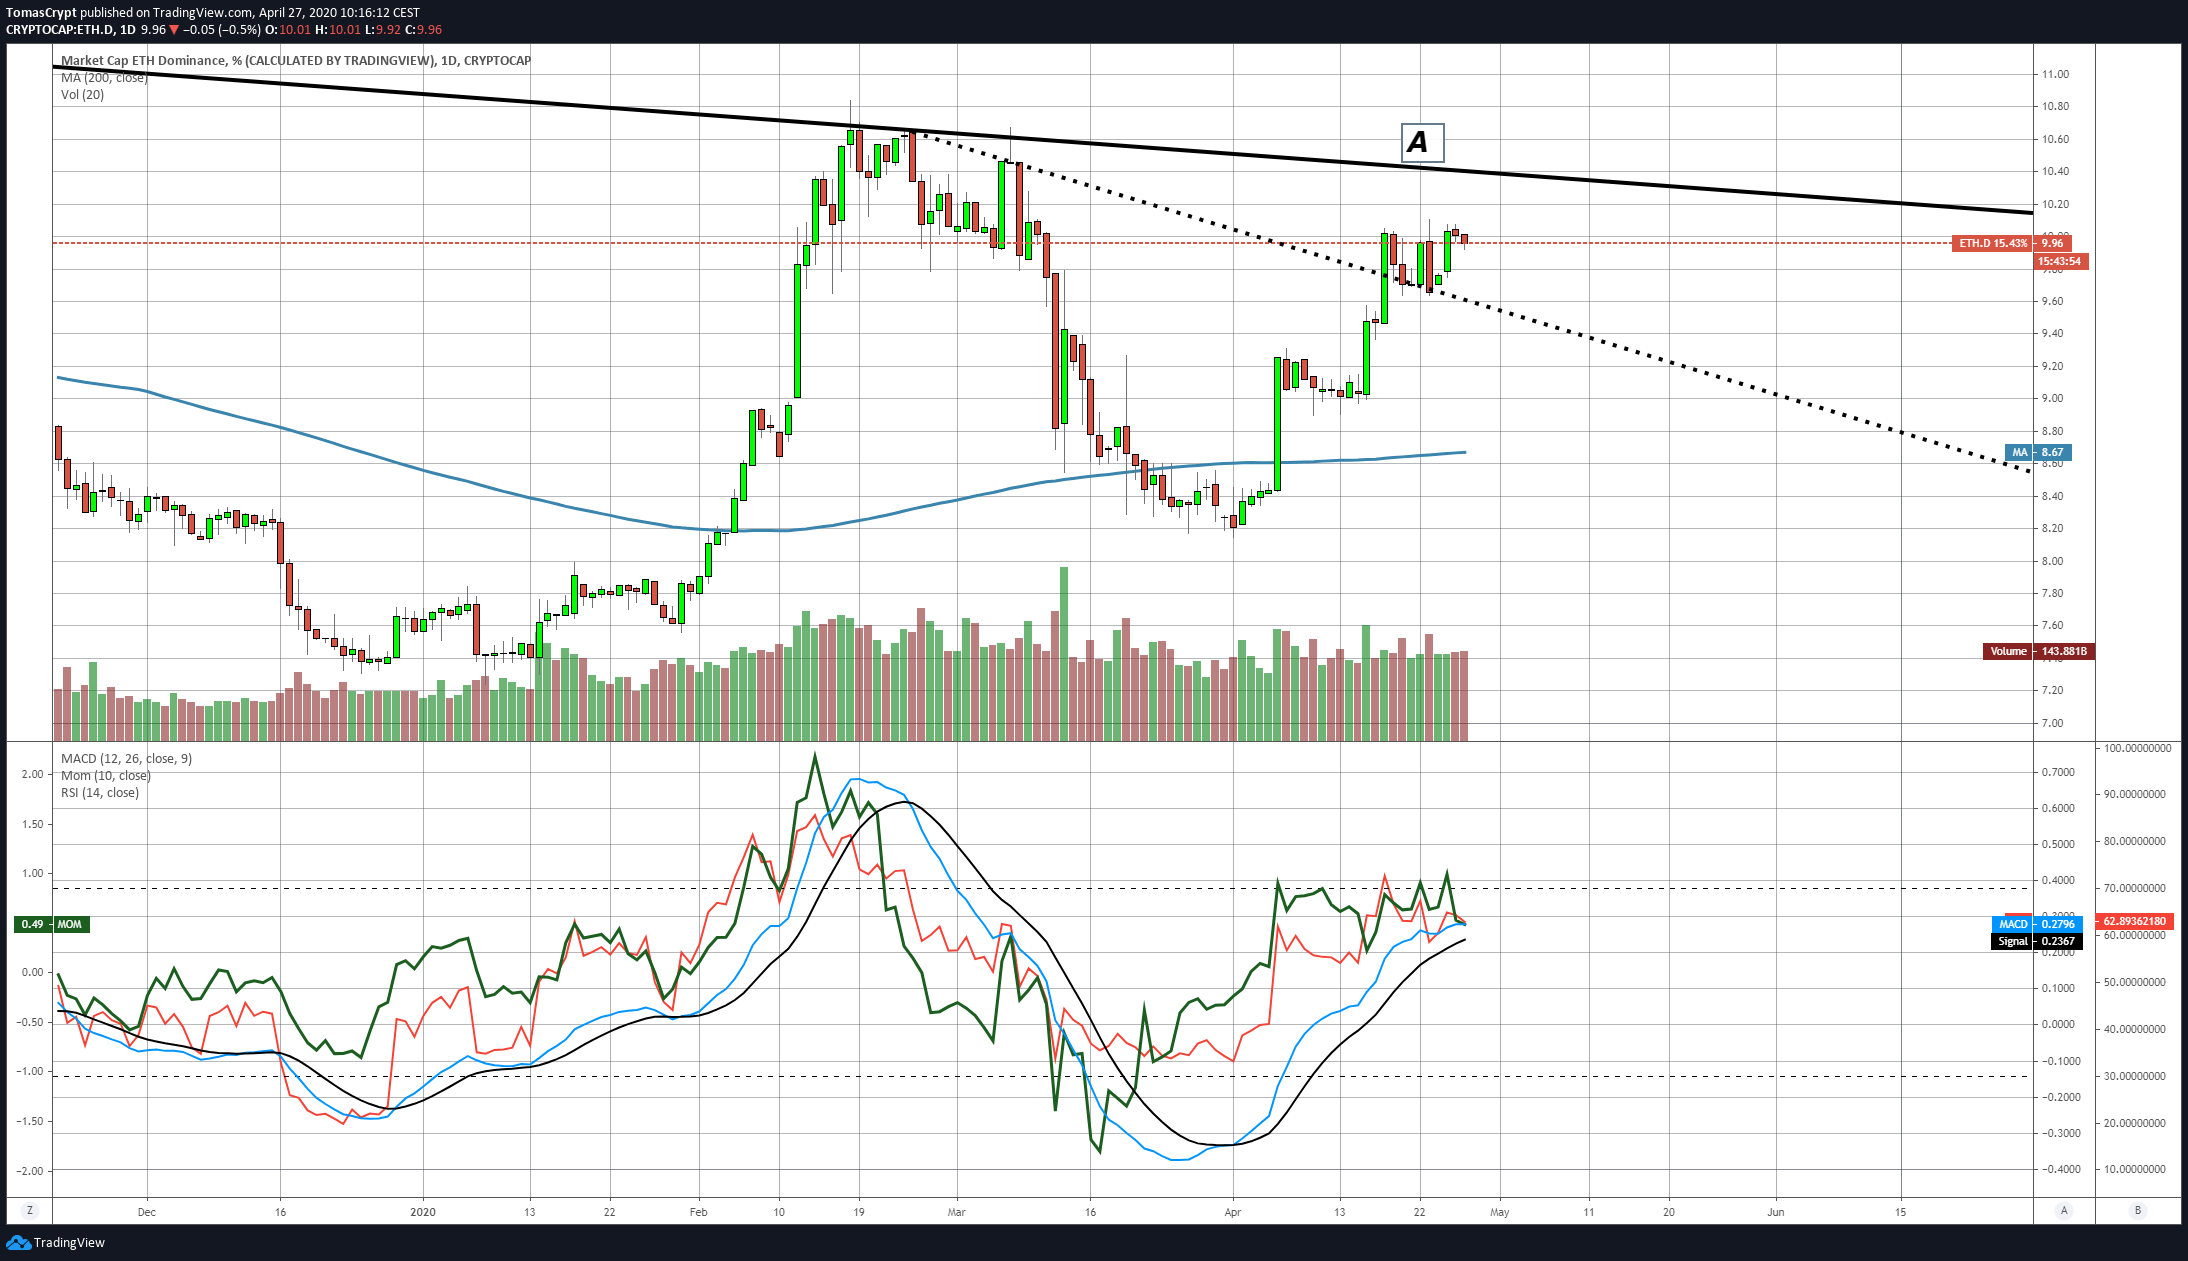 Source: TradingView
The RSI and Momentum indicators are pointing south, but do not confirm the apparent weakness of Ethereum over Bitcoin.
With just over 15 days left before Bitcoin halving, this could lead to a series of price movements before the need for Bitcoin miners to finance new material purchases with which to remain competitive.
On the other hand, the Ethereum network continues working on the implementation of version 2.0 and the migration from the PoW (Proof of Work) protocol to a PoS (Proof of Stake) model. With this change, the Ethereum network will leave behind computing power and energy consumption as a mining method.
ETH/BTC Daily Chart
The ETH/BTC pair is currently trading at the price level of 0.0254, after another attempt to break out of the 0.26 resistance level.
Above the current price, the first resistance level is at 0.0255, then the second at 0.026 and the third one at 0.0235.
Below the current price, the first support level is at 0.0235, then the second at 0.0231 and the third one at 0.0228.
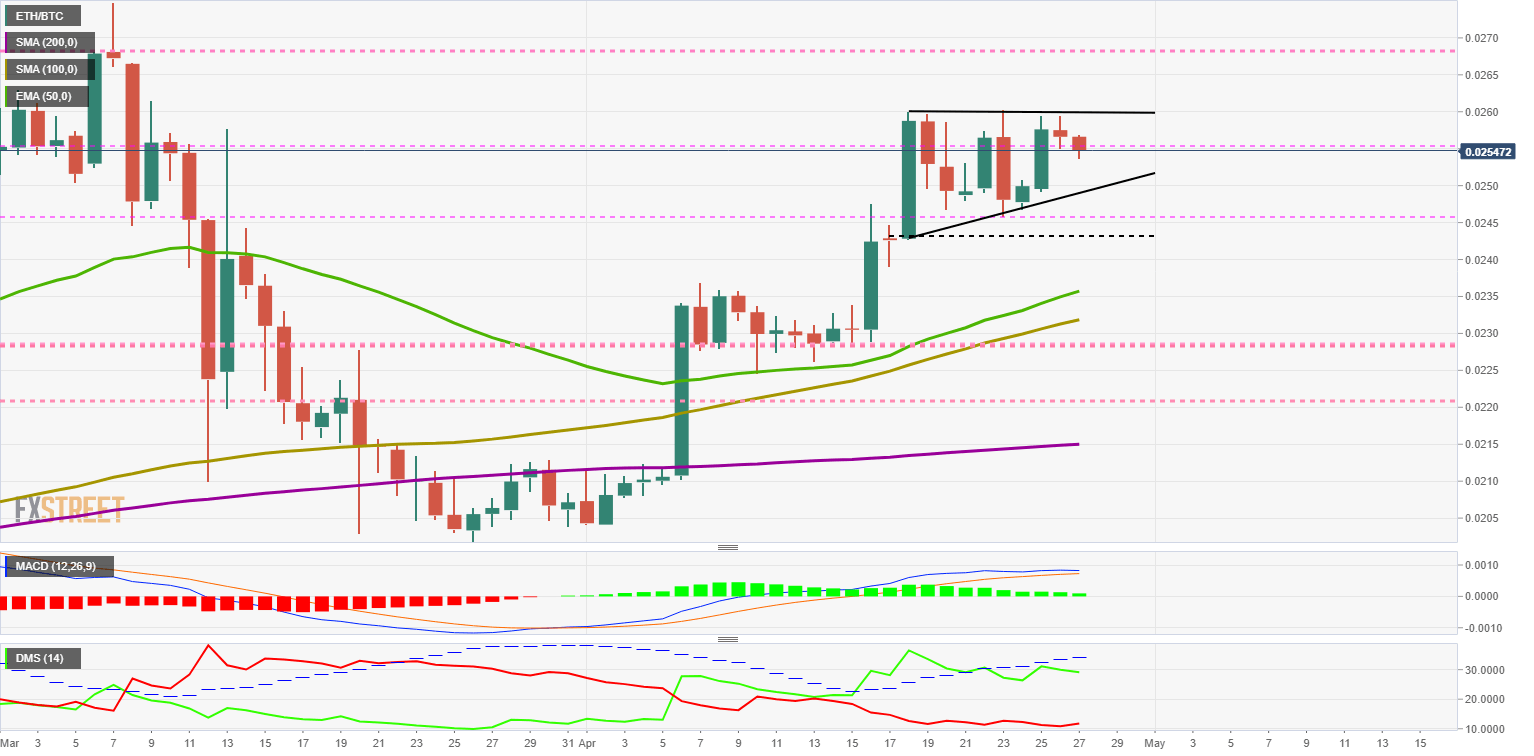
The MACD on the daily chart confirms the weakness already seen in the Ether's dominance chart. The moving averages lose the bullish profile and move towards negative slopes. The line spacing is also decreasing due to the loss of upward momentum.
The DMI on the daily chart shows bulls losing support from the ADX line as bears react a bit upwards after many days of weakness. The current profile is replicating the structure that formed in late January and preceded the previous bullish momentum.
BTC/USD Daily Chart
The BTC/USD pair is currently trading at the price level of $7741 after leaving a new short-term high of $7805 at the start of the session. The key target is above the $8000 price level, although to achieve this, it must overcome two strong resistances such as the 100-day and 200-day Simple Moving Averages.
Above the current price, the first resistance level is at $7750, then the second at $7850 and the third one at $8000.
Below the current price, the first support level is at $7600, then the second at $7400 and the third one at $7230.
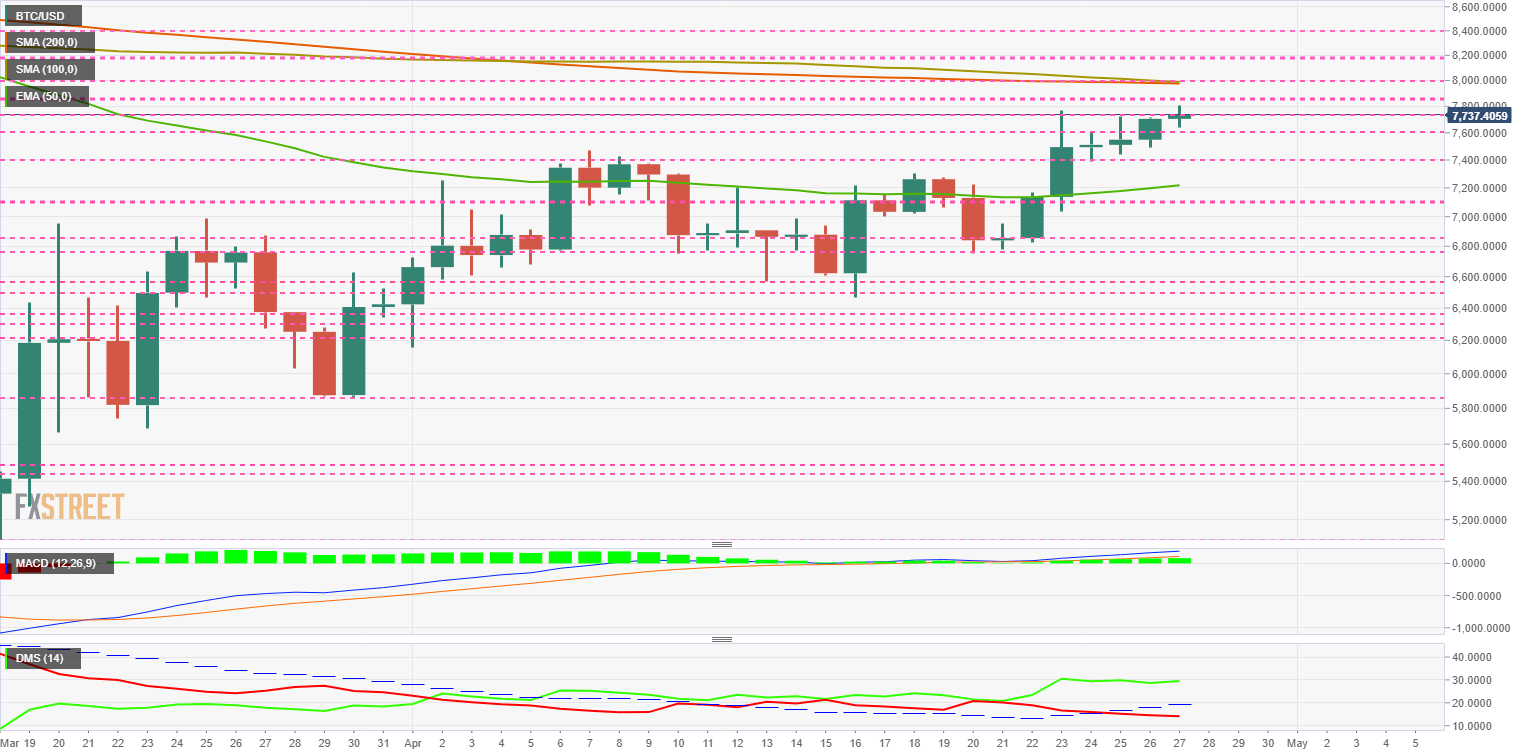
The DMI on the daily chart shows a strong bullish structure. The retreat of the bears likely drives this movement.
ETH/USD Daily Chart
The ETH/USD pair is currently trading at the price level of $197.1 and is not yet trading above the psychological level of $200 per Ether. The 50-day Exponential Moving Average points to cross the 200-period Simple Average upwards, an event that, as a rule, exerts a strong pull on the spot price.
Above the current price, the first resistance level is at $195, then the second at $200 and the third one at $208.
Below the current price, the first support level is at $190, then the second at $186 and the third one at $180.
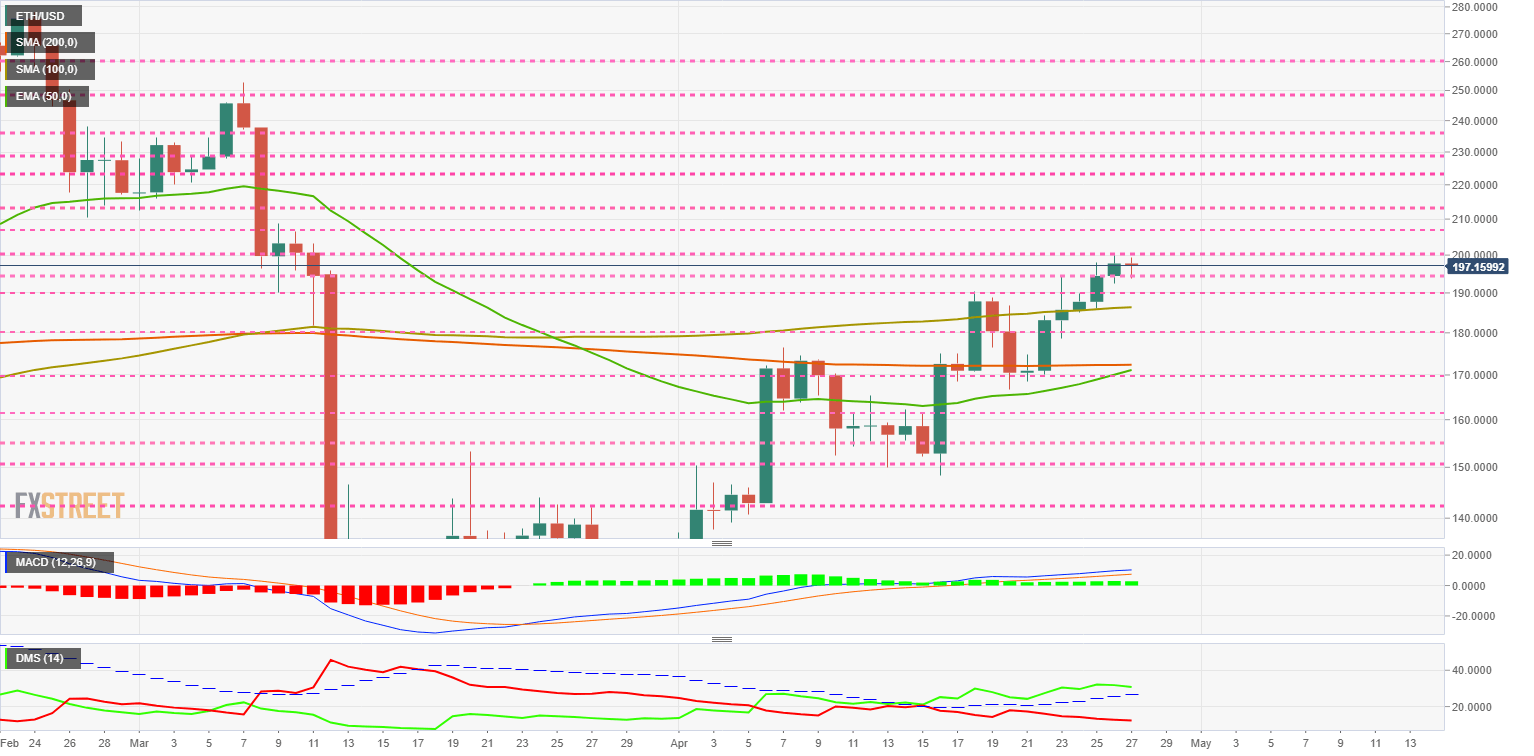
The MACD on the chart shows a loss of upward slope by the moving averages, although they remain open between the lines. Considering the structure of the Ether Dominance chart, the most likely development will be lateral consolidating for the price.
The DMI on the daily chart shows a loss of momentum from the bulls, although the bears are not confident of the situation and do not improve their strength level.
XRP/USD Daily Chart
The XRP/USD pair is currently trading at the price level of $0.1974 and remains trapped below the $0.20 level, ignoring the good results of the segment in recent days.
The inclination of the 100-day and 200-day Simple Moving Average is still bearish and is already trading at $0.22. The current technical situation is similar to the one at the end of January when the XRP/USD pair moved sharply upwards to break minima later and consolidate at $0.14.
Above the current price, the first resistance level is at $0.20, then the second at $0.218 and the third one at $0.23.
Below the current price, the first support level is at $0.19, then the second at $0.18 and the third one at $0.172.
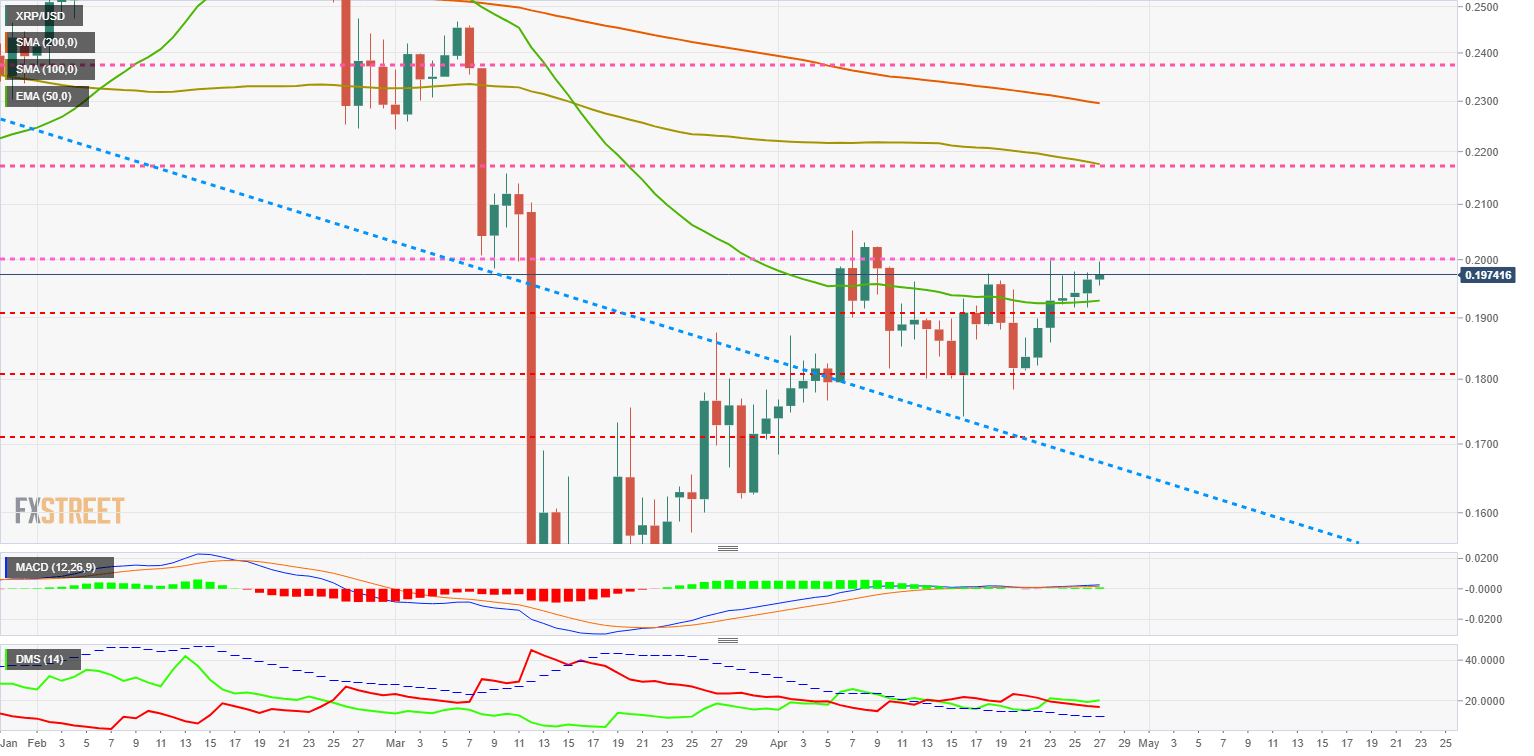
The DMI on the daily chart shows bulls gaining a slight advantage over the bears. The selling side continues to lose strength but is still within striking distance of the buying side's position.
Author

Tomas Salles
FXStreet
Tomàs Sallés was born in Barcelona in 1972, he is a certified technical analyst after having completing specialized courses in Spain and Switzerland. He expanded his technical training following the guidance of great experts on the financial markets.


