Top 3 Price Prediction Bitcoin, Ethereum, Ripple: Main street's buying interest at twelve-month highs
- Newcomers' interest in buying Bitcoins reaches the highest level in a year, according to Google Trends.
- Market is rising today but maintains bearish structures in the short term.
- Altcoin segment rises sharply but leaves Ethereum out of the game.

This week is getting to the end with the crypto market refusing to take on the bearish sensation even though indicators point to a depletion in the trend that began in late winter.
Although the recent rise has not reached the mass media, interest in specific segments of the population, especially among the millennials, remains strong.
The following graph shows the evolution of Internet searches on how to buy Bitcoins:
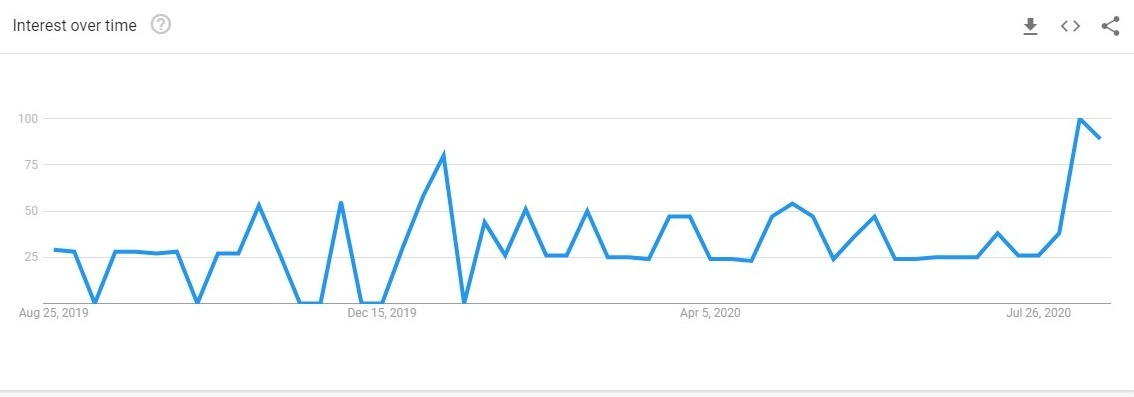
As you can see, at the end of July it reached the highest level of the last 12 months. The graph is exciting because this type of search is typical of someone who does not yet have experience investing in the Crypto Segment. New investors and fresh money without the vital support of the big media.
According to a recent report by JP Morgan, the Millenials consider Bitcoin a safe investment, in the same way, that the Boomers had Gold as a reference. The severe economic crisis caused by the COVID-19 pandemic has sparked interest in finding new reservoirs of value away from the assets where the world's central banks are injecting vast amounts of debt-backed money.
ETH/BTC Daily Chart
The ETH/BTC pair is currently trading at the price level of 0.0349 and is once again attempting to break out of the price congestion resistance at 0.035.
Above the current price, the first resistance level is at 0.035, then the second at 0.0373 and the third one at 0.0382.
Below the current price, the first support level is at 0.0332, then the second at 0.0316 and the third one at 0.0311.
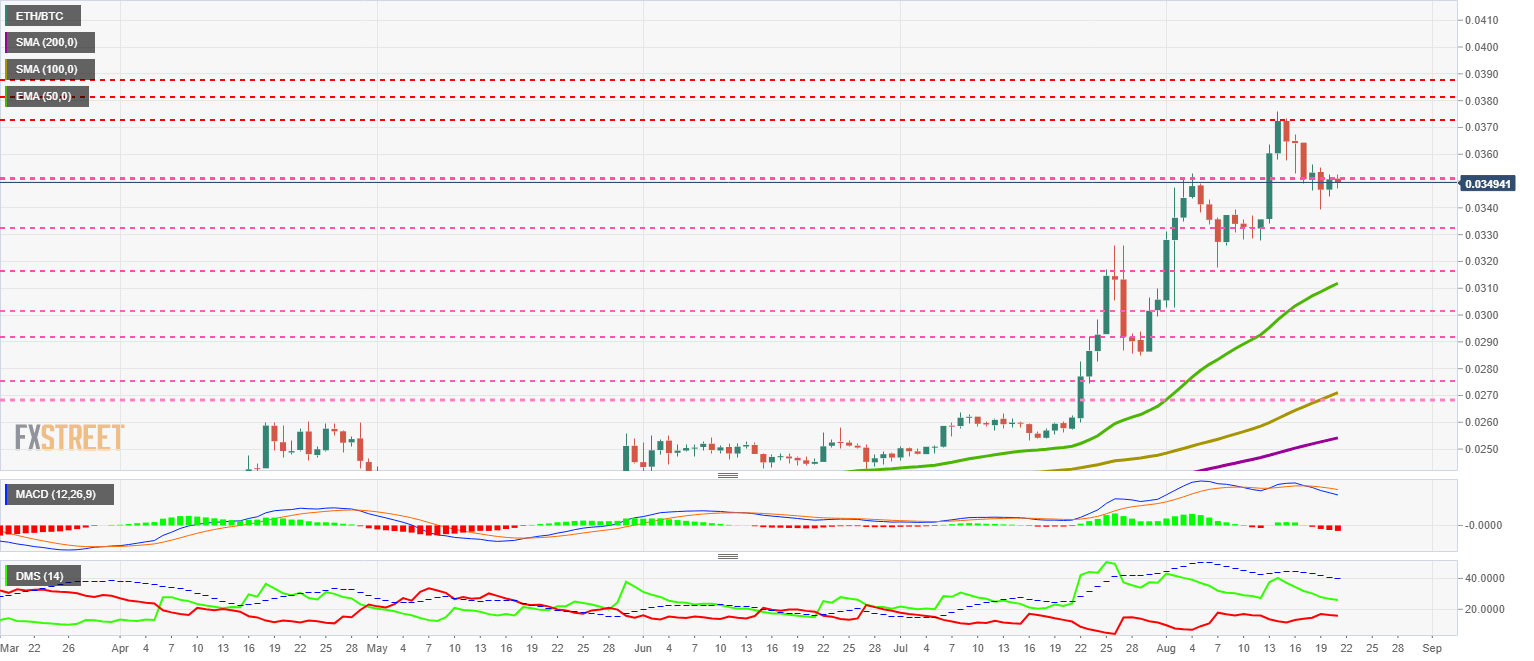
The MACD on the daily chart continues to move lower despite the upward movement of the last few hours. A change in the direction of the indicator would be a robust upward signal and could catch many traders off guard.
The DMI on the daily chart shows both sides of the market losing momentum. This movement may reflect doubts about price development in the short term.
BTC/USD Daily Chart
The BTC/USD pair is currently trading at the price level of $11840 and is attempting to approach the psychological level of $12000 again.
Above the current price, the first resistance level is at $12275, then the second at $14000 and the third one at $17200.
Below the current price, the first support level is at $11275, then the second at $10800 and the third one at $10660.
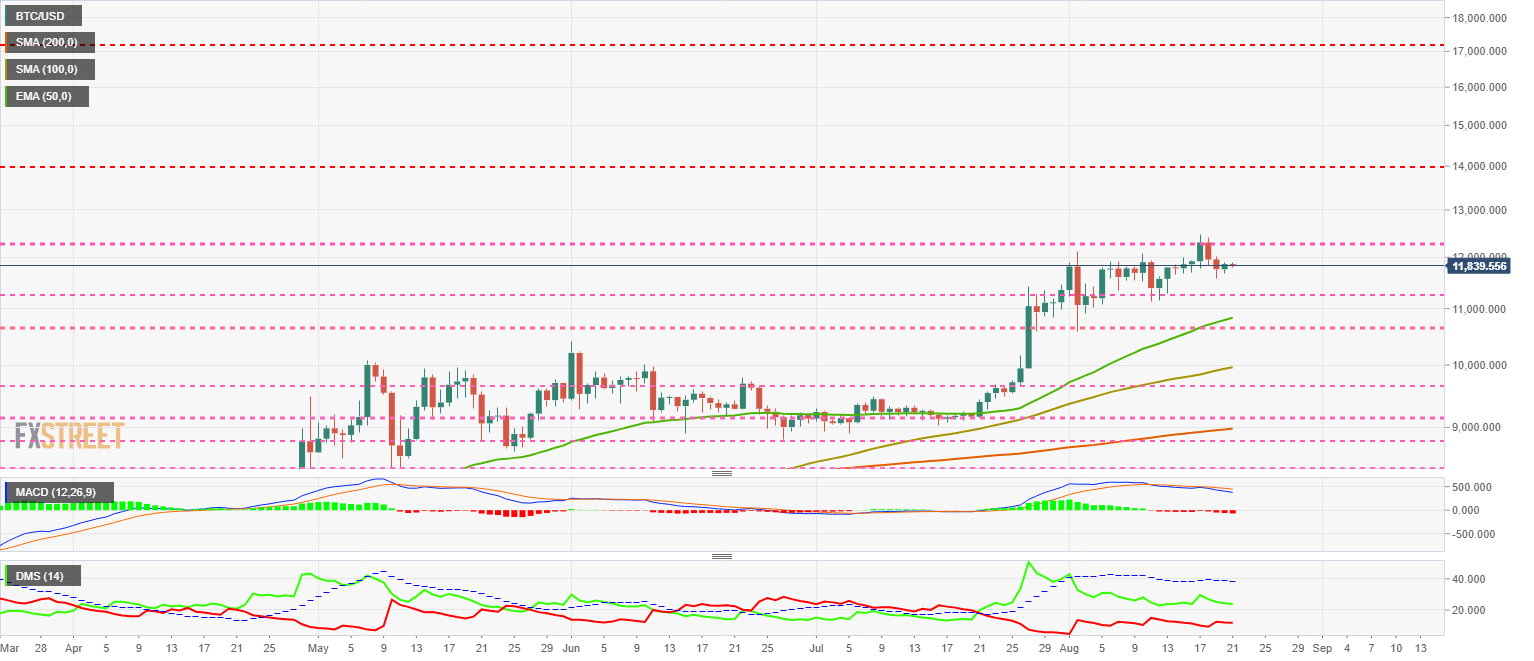
The MACD on the daily chart barely changes its profile from yesterday's, but it doesn't improve the bearish pattern or decrease the line spacing. The current profile could turn upwards, given the short distance between the lines.
The DMI on the daily chart shows how both sides of the market are at similar levels as the last few days. It seems that no one on both sides of the market believes in its possibilities.
ETH/USD Daily Chart
The ETH/USD pair is currently trading at $414.1 as it attempts to keep up with its Altcoin counterparts.
Above the current price, the first resistance level is at $440, then the second at $460 and the third one at $485.
Below the current price, the first support level is at $385, then the second at $345 and the third one at $315.

The MACD on the daily chart continues to increase the bearish profile, both in terms of slope and line spacing. The projection is for continued downward movement in the coming days.
The DMI on the daily chart shows both sides of the market almost unchanged from the previous days. Bulls and bears are very close, and they will inevitably face each other in the short term.
XRP/USD Daily Chart
The XRP/USD pair is currently trading at the price level of $0.291 and is trying not to lose price support due to price congestion at $0.29, although Ripple has margin up to the $0.285 level without risking the current price range.
Above the current price, the first resistance level is at $0.30, then the second at $0.318 and the third one at $0.328.
Below the current price, the first support level is at $0.29, then the second at $0.285 and the third one at $0.267.
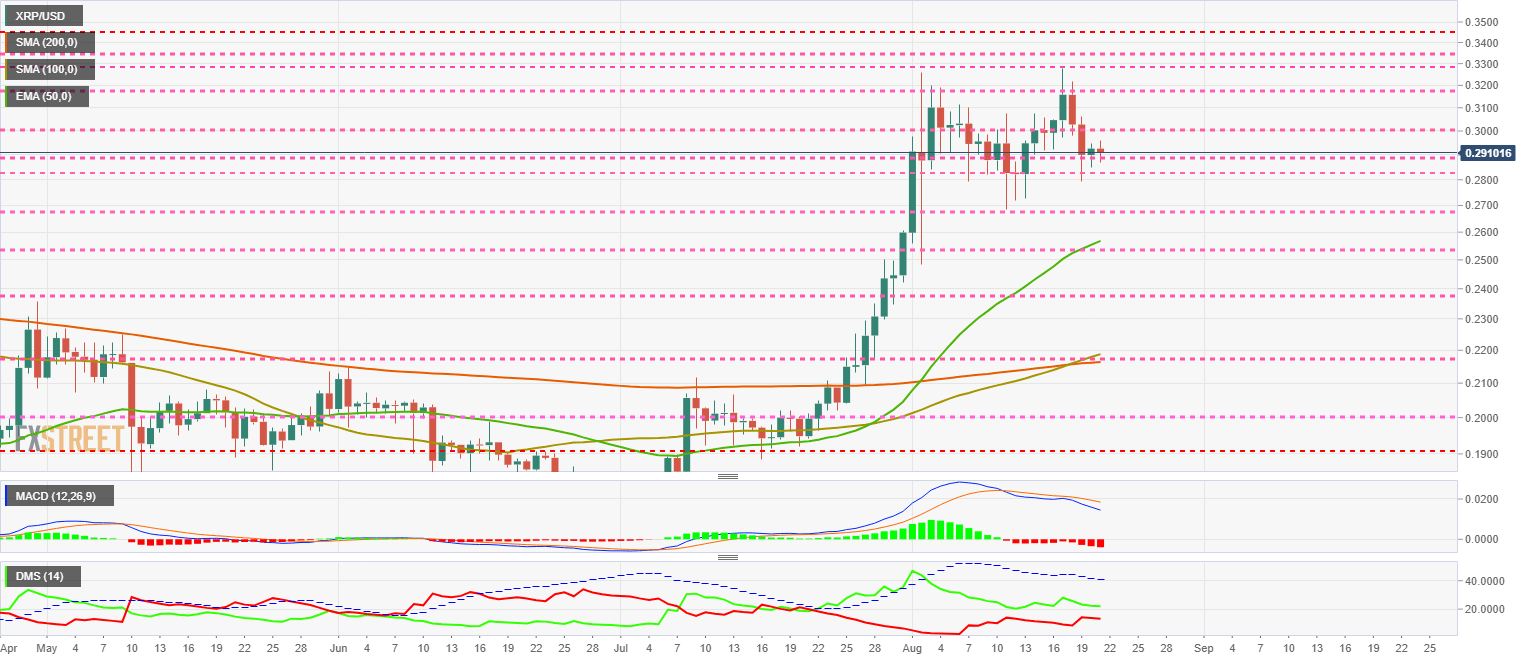
The MACD on the daily chart increases both the slope and the line spacing. The MACD on the daily chart increases both the curve down and the line spacing.
The DMI on the daily chart shows a slight decline on both sides of the market, as they move so close together that a clash between the two forces driving the price is inevitable.
Author

Tomas Salles
FXStreet
Tomàs Sallés was born in Barcelona in 1972, he is a certified technical analyst after having completing specialized courses in Spain and Switzerland. He expanded his technical training following the guidance of great experts on the financial markets.


