Top 3 Price Prediction Bitcoin, Ethereum, Ripple: Looking for the best path to the Moon
- Emerging bullish signals from a variety of sources open up options for a major upward movement.
- ETH/BTC, in the midst of a battle for market momentum leadership, while Bitcoin faces strong resistance.
- Ripple still in a risk zone, although upside options appear in late summer.

The fight for dominance in the crypto market is at a new turning point. Yesterday at mid-morning, Ethereum showed intentions to move higher. A significant breakout of the long-term downtrend in the ETH/BTC pair can confirm the plans of Ethereum.
The daily closing reached the target and closed above the mark, being today a critical day to certify the triumph or to declare a new defeat against King Bitcoin.
Another encouraging fact, at least for the bulls, was the signal that appeared in the S2F (Stock to Flow) model prepared by Plan B, a well-known member of the Crypto community in the social network Tweeter.
In this model, the system paints color points according to the different market phases, being red the color chosen for the bullish phase. Yesterday, the system changed the color, and a red dot appeared, awakening the optimistic feeling among the followers of this type of valuation system.
#Bitcoin S2F chart update .. RED DOT #2 pic.twitter.com/L8Fl89yNYx
— PlanB (@100trillionUSD) July 1, 2020
The market reaction has been noticeable in the top tier Altcoins, with significant increases in Cardano (ADA/USD +12.99%), Stellar Lumens (XLM/USD +4.51%), Tron (TRX/USD +3.98%) or VeChain (VET/USD +7.91%).
ETH/BTC Daily Chart
The ETH/BTC pair is currently trading at the price level of 0.0248 and is losing yesterday's resistance level by breaking the long-term downward trend line. Today's close will allow us to see more clearly whether the move that began yesterday is consistent or not.
Above the current price, the first resistance level is at 0.0268, then the second at 0.0276 and the third one at 0.0295.
Below the current price, the first support level is at 0.0248, then the second at 0.0235 and the third one at 0.0225.
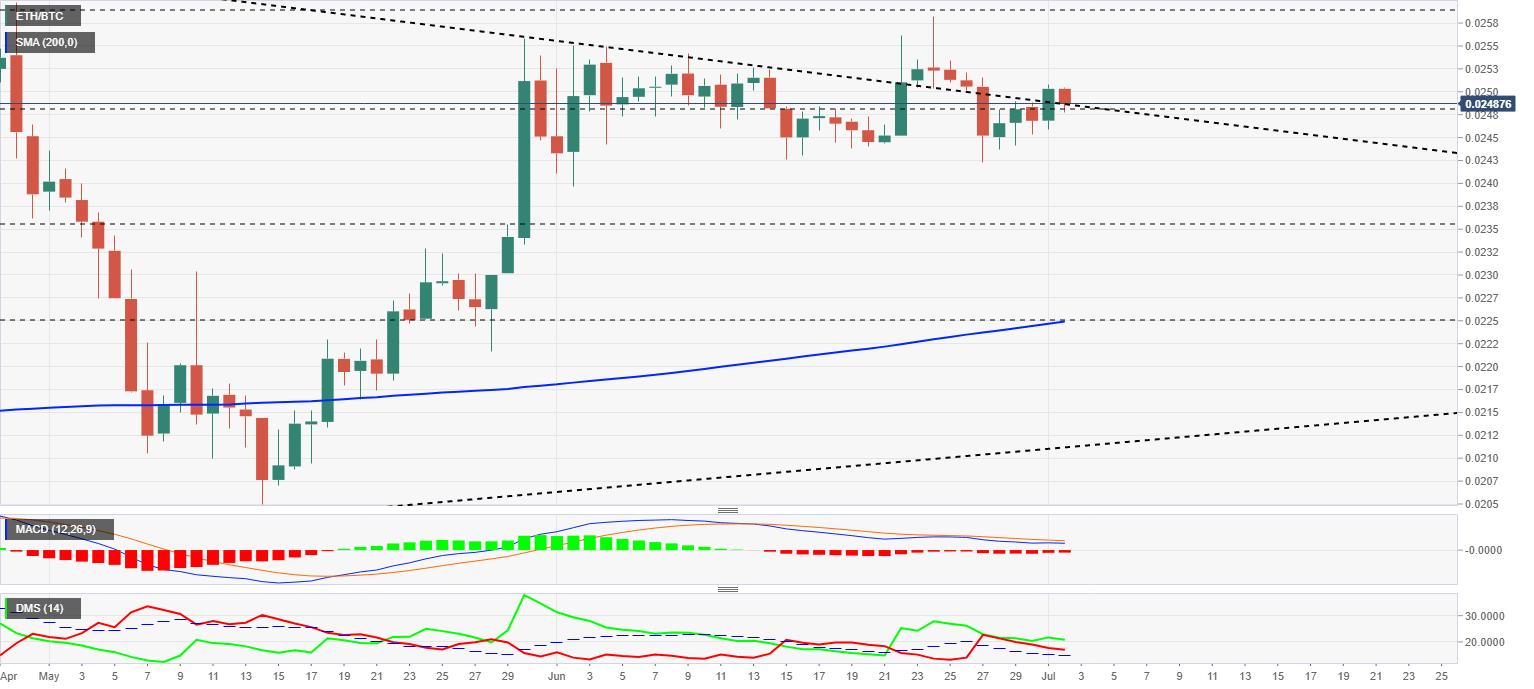
The MACD on the daily chart does not follow the price and remains in a horizontal, crossover position. The current profile suggests a lateral upward movement with a tendency to sharp upward turns.
The DMI on the daily chart shows the bulls dominating the ETH/BTC pair although the buy-side is losing momentum today. Bears are not buying into the potential weakness of the bulls and are following the previous downward trend.
BTC/USD Daily Chart
The BTC/USD pair is currently trading at the price level of $9188 and is still in the midst of this moment of congestion which will sooner or later break out in an unknown direction.
Above the current price, the first resistance level is at $9500, then the second at $10450 and the third one at $11360.
Below the current price, the first support level is at $8950, then the second at $8725 and the third one at $8350.
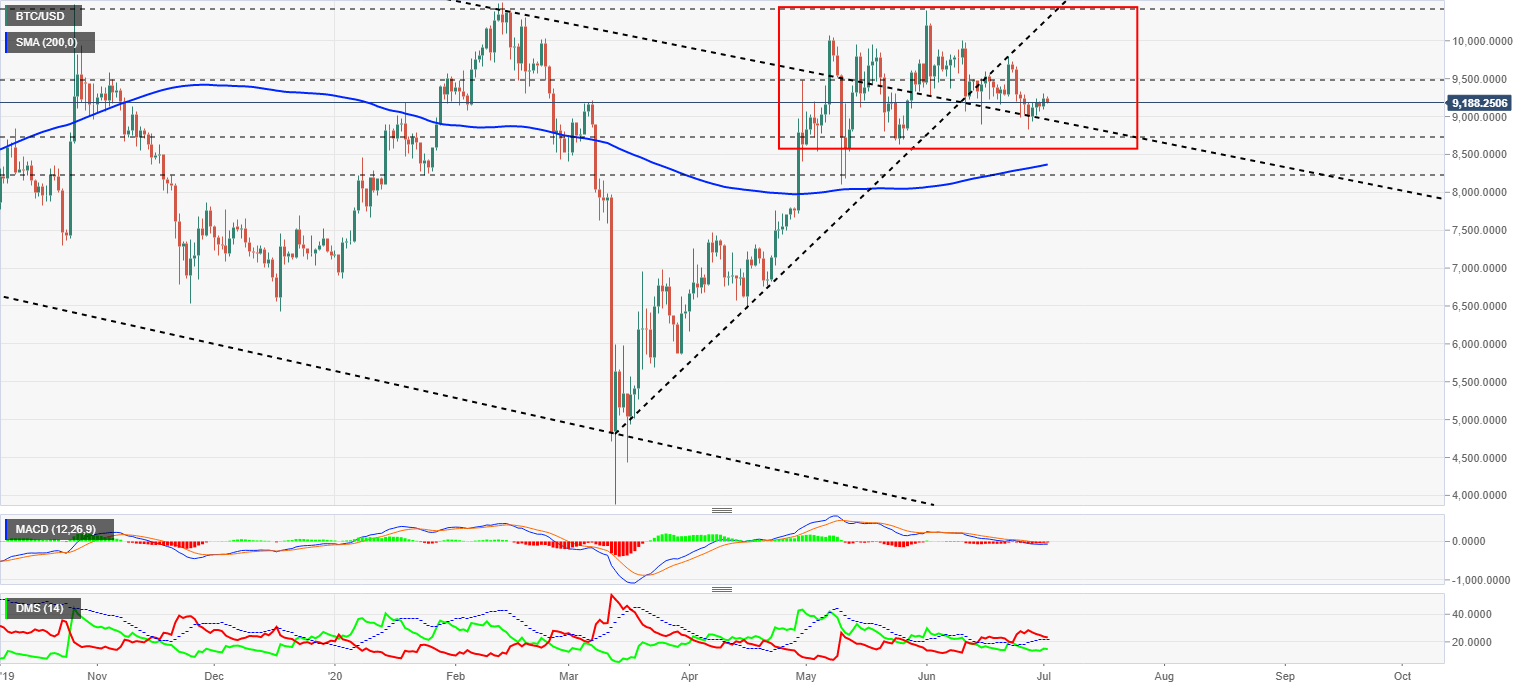
The MACD on the daily chart continues crossed lower, although the profile of the moving averages suggests a possible upward shift. If this upward movement occurs, the BTC/USD pair may rise above the zero levels of the indicator.
The DMI on the daily chart shows the bears looking for support on the ADX line, while the bulls are moving a little higher and may support the bullish move proposed by the MACD indicator.
ETH/USD Daily Chart
The ETH/USD pair is currently trading at the price level of $229.3 and like Bitcoin, remains within the current trading/congestion zone. The bullish breakout target is at $264, the level where the long-term downward trend line passes.
Above the current price, the first resistance level is at $233.6, then the second at $246.2 and the third one at $262.2.
Below the current price, the first support level is at $221, then the second at $200 and the third one at $190.
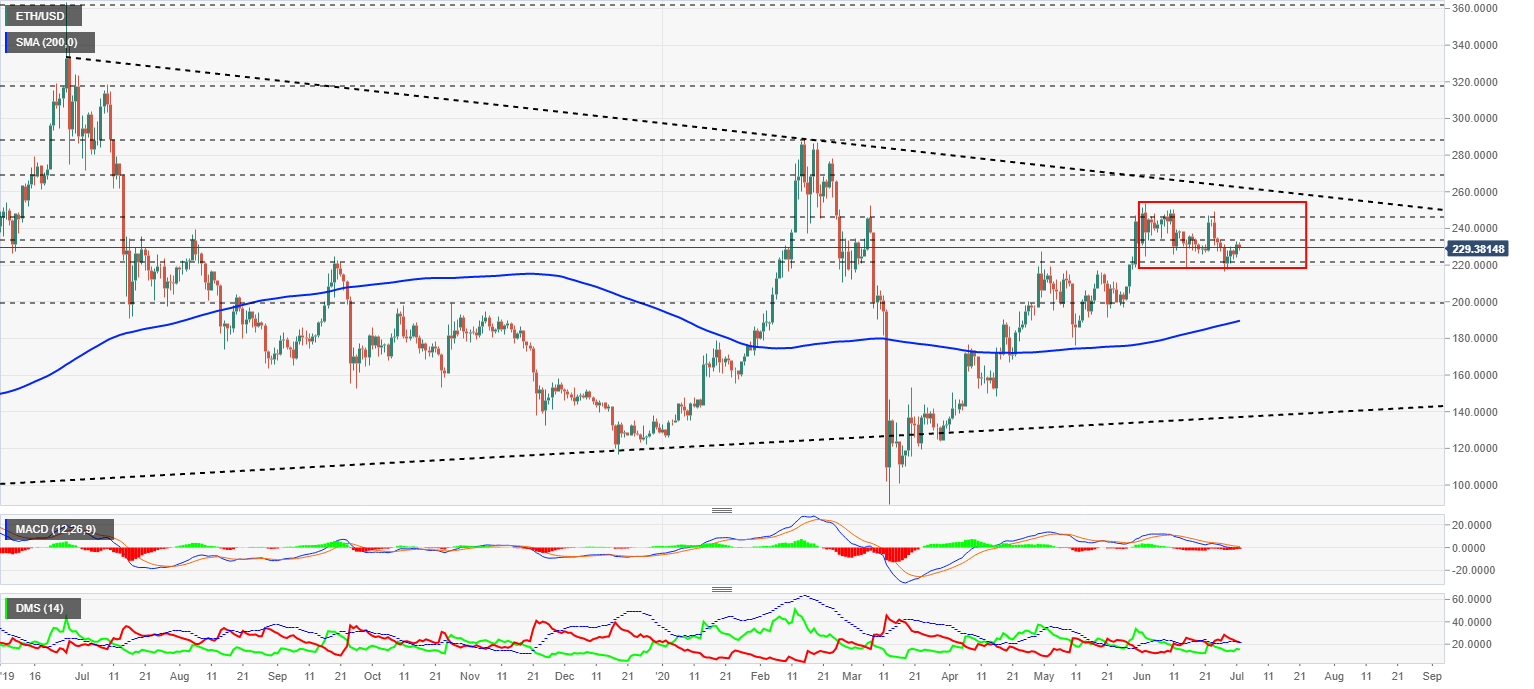
The MACD on the daily chart finds support in the neutral level of the indicator, from where it could quickly turn upward. A failure to develop the current structure could trigger a strong downward signal on ETH/USD, which could move towards the $160 level.
The DMI on the daily chart shows bears at risk of losing support from the ADX line, as bulls move up. The current structure is conducive to a possible change in the leader of the ETH/USD pair.
XRP/USD Daily Chart
The XRP/USD pair is currently trading at the price level of $0.176 and remains in the danger zone for another day after losing last week's bullish support that has guided the price since the beginning of March. The price attractor (red circle) of September represents the best option for the Ripple to retake the bullish path.
Above the current price, the first resistance level is at $0.184, then the second at $0.193 and the third one at $0.20.
Below the current price, the first support level is at $0.163, then the second at $0.14 and the third one at $0.114.
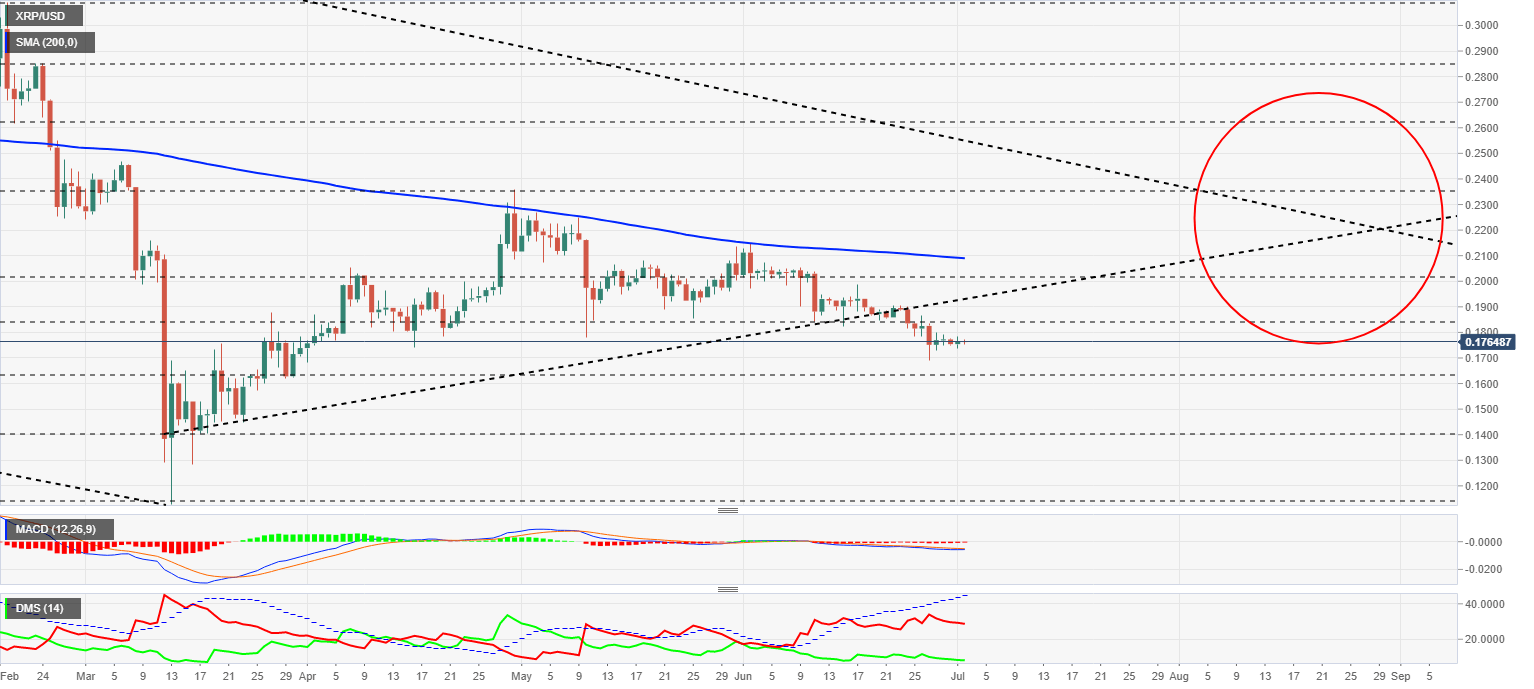
The MACD on the daily chart shows a very flat profile with no distance between the moving averages. The current structure gives some probability of a bullish move in the next few days.
The DMI on the daily chart shows the bulls in a slight decline, but the bulls do not see this as an opportunity as they continue to move lower.
Author

Tomas Salles
FXStreet
Tomàs Sallés was born in Barcelona in 1972, he is a certified technical analyst after having completing specialized courses in Spain and Switzerland. He expanded his technical training following the guidance of great experts on the financial markets.


