Top 3 Price Prediction Bitcoin, Ethereum, Ripple: Last selling cycle before heading to the moon
- The market crash can be read as a last stand before the bull run.
- Market sentiment collapses and shifts in a day from greed to fear.
- The downward movement could continue until the end of this month.

Yesterday's day left us with significant drops along with the crypto board and a radical change in the traders' perception of the situation.
The market sentiment level prepared by the website alternative.me has collapsed and fell more than 40% to level 40.
The current level indicates that there is fear among the participants, a step before doubt, and that will eventually develop into capitulation.
The strong hands that dominate the crypto market have decided – in fact, they had already made their mind for days – that it is time to buy again and of course they are not going to do it with the rising prices.
The congestion we see in the long-term chart of the sentiment indicator already announced a collapse, according to their typical behavior pattern. In previous situations, this type of collapse in the sentiment level has reached extreme levels of fear (0-20). However, there are no records before February 2018, and we have no references of how it can behave during a bullish market.
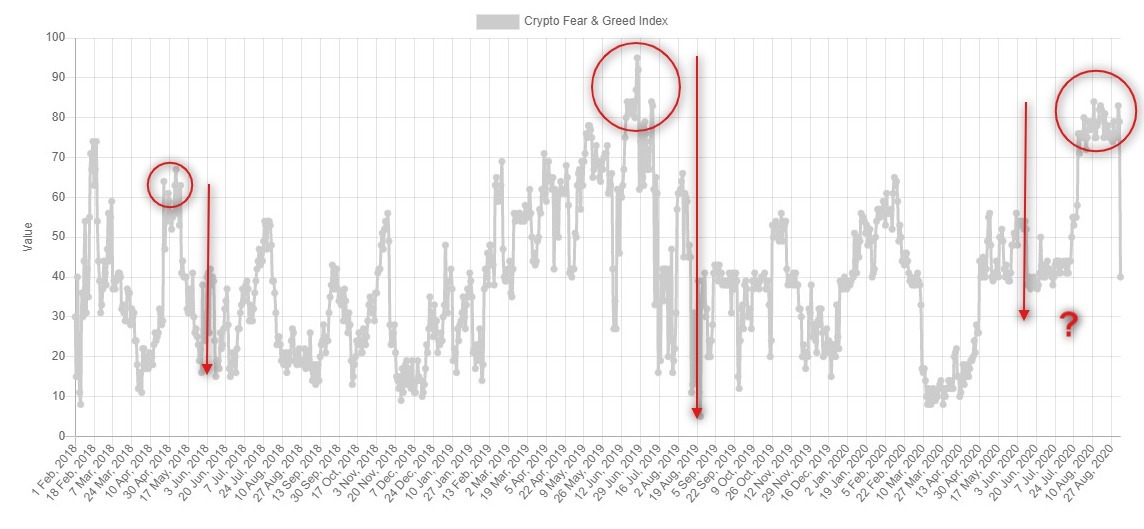
Source: alternative.me
The objective for the next sessions is to know where the weak hands will sell, and the strong hands will satisfy their needs, maybe the last opportunity to buy at "reasonable" prices in the next few years, so be on the lookout for opportunities.
ETH/BTC Daily Chart
ETH/BTC is currently trading at 0.03752 and has not lost primary support at 0.03748. The closest area of congestion is around 0.034, and if the drop extends, it is where the ETH/BTC pair should move.
Above the current price, the first resistance level is at 0.040, then the second at 0.042 and the third one at 0.045.
Below the current price, the first support level is at 0.0226, then the second at 0.022 and the third one at 0.0217.
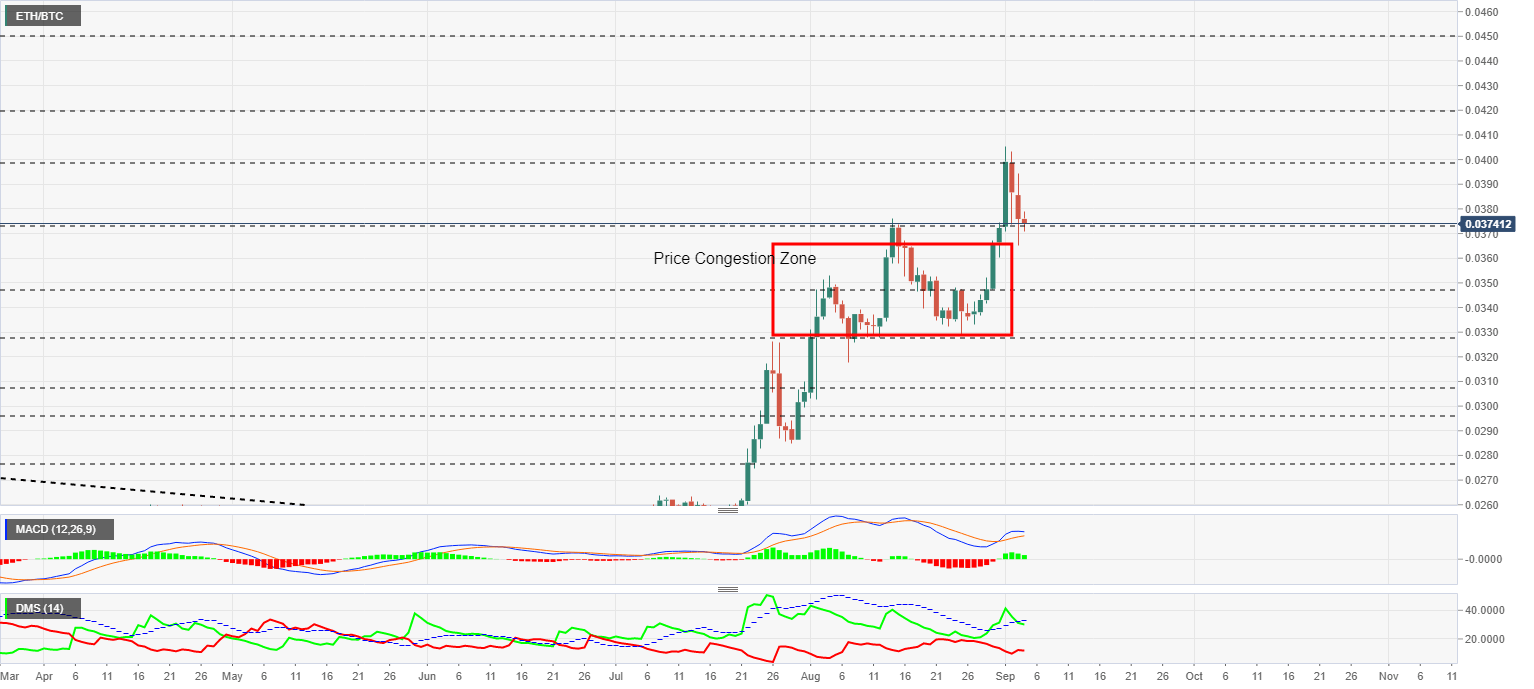
The MACD on the daily chart has lost the bullish profile and stands entirely horizontally. The current structure does not suggest a fall and leaves a very uncertain scenario for the next few days.
The DMI on the daily chart shows the bulls drilling down the ADX line and disabling the bullish pattern. The bears are rising a bit although they are still far away from the buy-side positions.
BTC/USD Daily Chart
The BTC/USD pair is currently trading at the price level of $10270. Below the current price, there is a significant area of price congestion support and the 200-day simple moving average as the ultimate safety support at the price level of $9000.
Above the current price, the first resistance level is at $10370, then the second at $12840 and the third one at $13650.
Below the current price, the first support level is at $10200, then the second at $9500 and the third one at $9000.
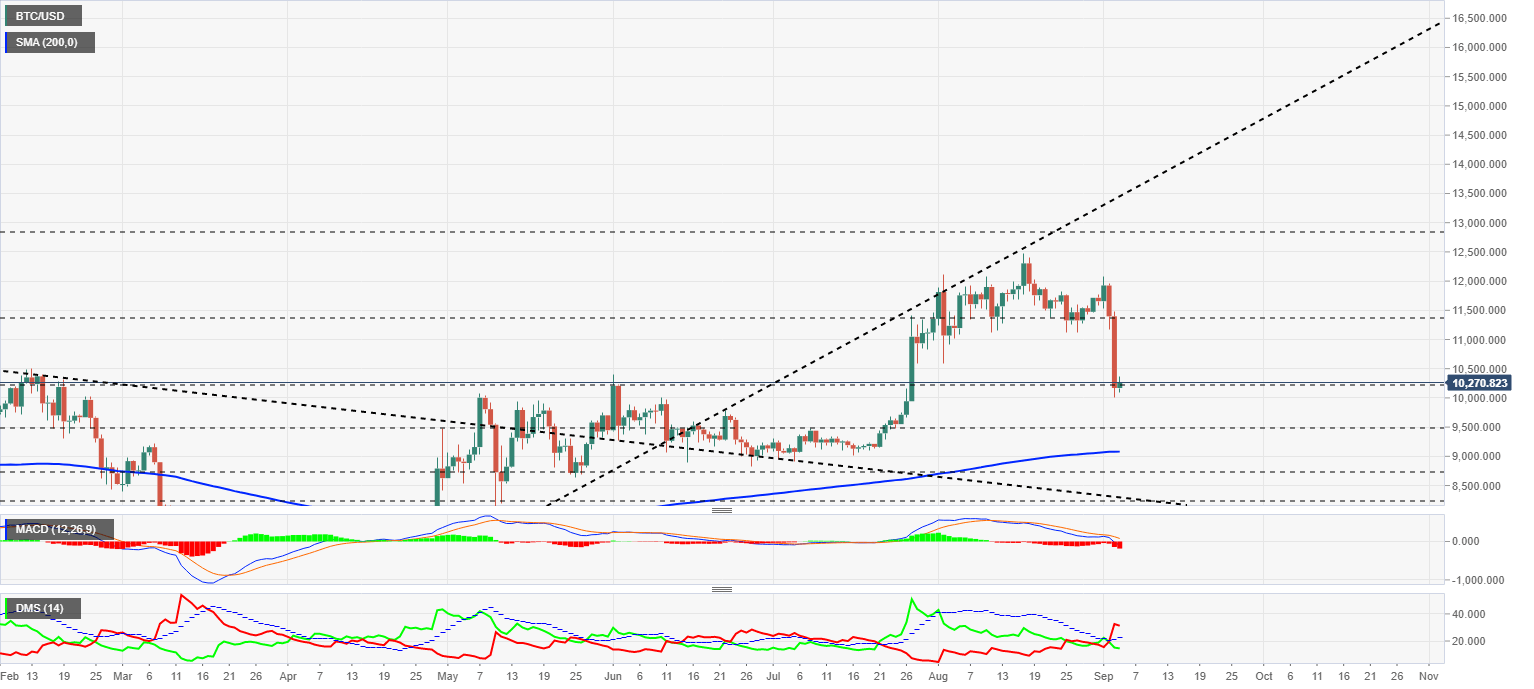
The MACD on the daily chart is moving violently down and into the negative zone of the indicator. The current structure would allow a violent rebound to the upside, although the market environment is not the most appropriate.
The DMI on the daily chart shows the bears taking control of the pair with force, distancing themselves from the bulls and promising an extended period of dominance.
ETH/USD Daily Chart
The ETH/USD pair is currently trading at $387.6, above the primary support of the current price range. The trend line that was born from the March lows – the natural support – passes through the $290 price level, but is projected to reach the $320 level by the end of this month. After many months of consecutive upward movement, we cannot rule out a three-week consolidation and a move into that price range.
Above the current price, the first resistance level is at $208, then the second at $218 and the third one at $225.
Below the current price, the first support level is at $200, then the second at $195 and the third one at $190.
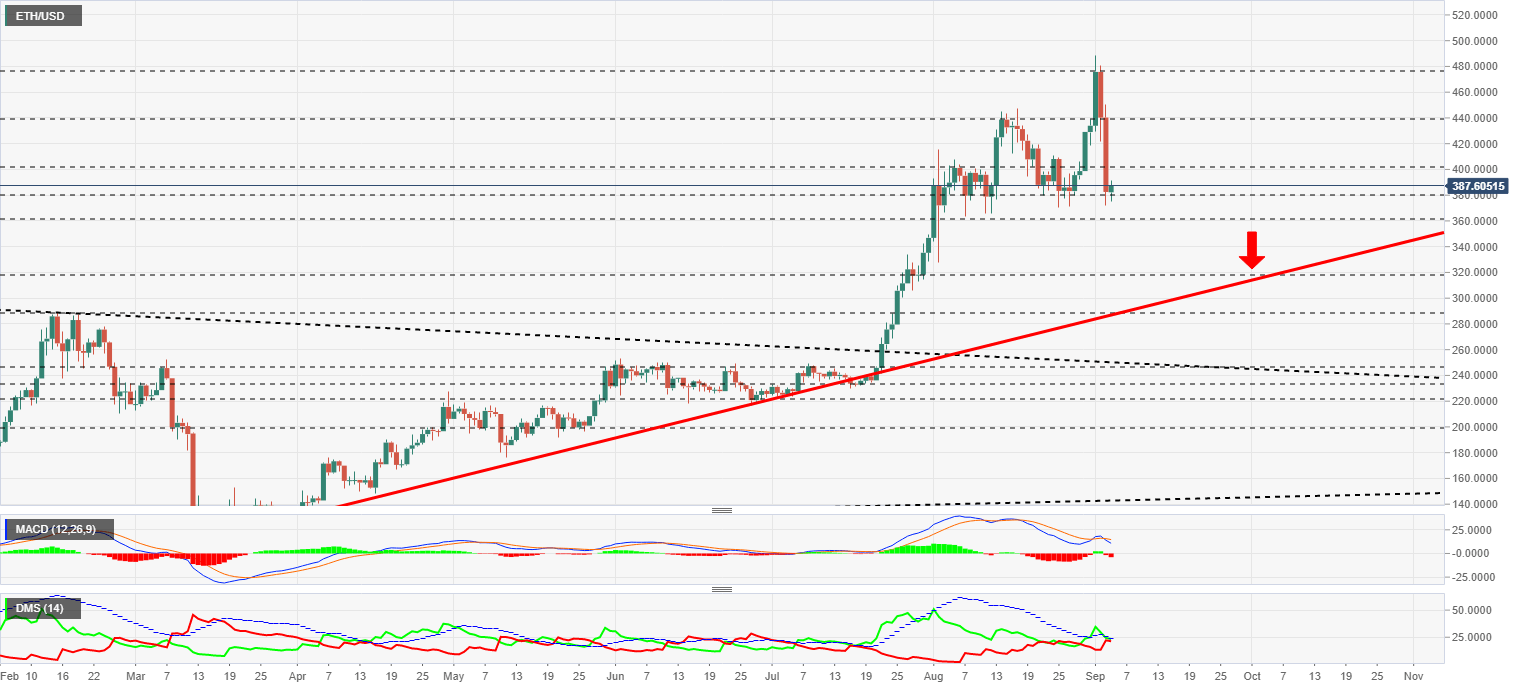
The MACD on the daily chart is crossing downwards and does so with a significant slope, which increases the chances of a prolonged fall.
The DMI on the daily chart shows the bulls losing support from the ADX line but still holding above the bears, the last hope of avoiding lower prices in the short term.
XRP/USD Daily Chart
The XRP/USD pair is currently trading at the price level of $0.2509, and after yesterday's decline, the price is now resting on the accelerated trend line from the start of the upward movement last July. If it breaks this downward trend line, the next line in the sand, originating from the March lows is at the $0.23 level.
Above the current price, the first resistance level is at $0.2618, then the second at $0.2846 and the third one at $0.31.
Below the current price, the first support level is at $0.244, then the second at $0.235 and the third one at $0.224.
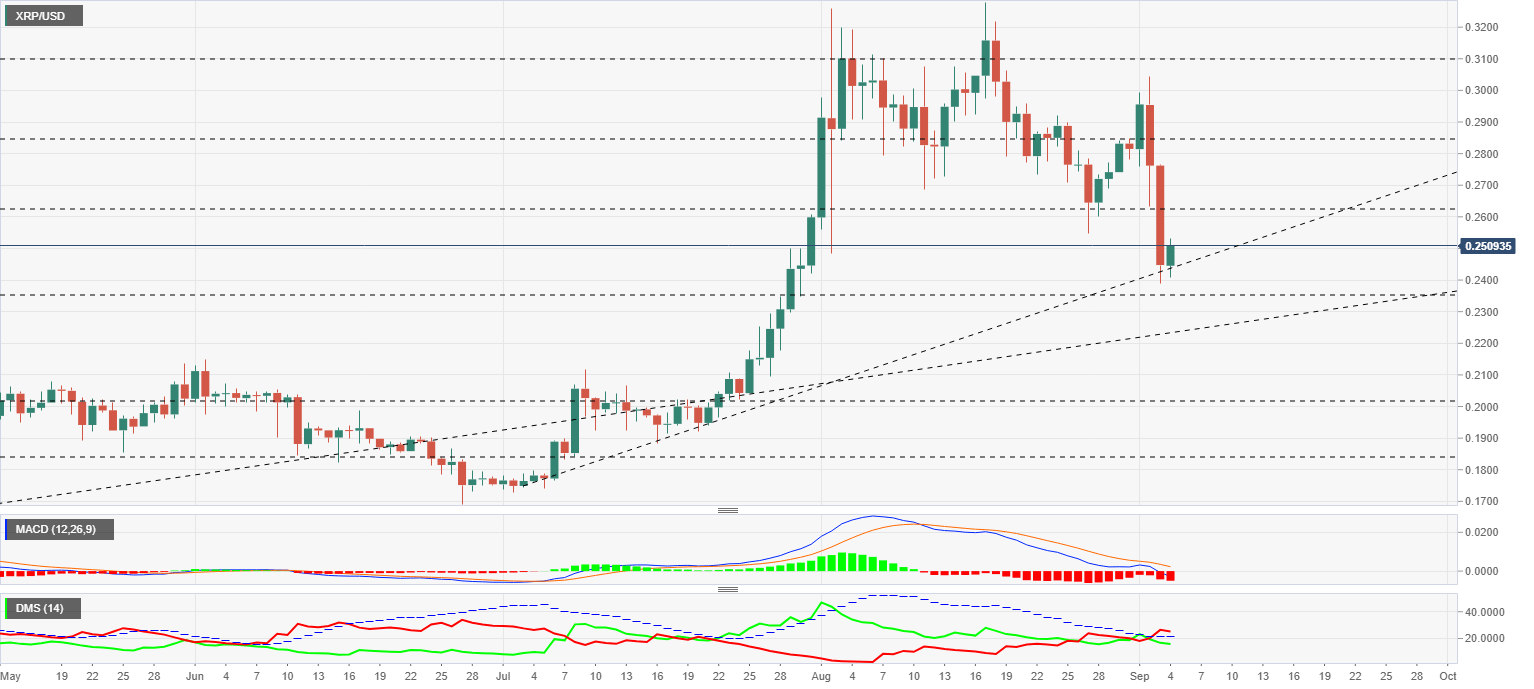
The MACD on the daily chart shows how the indicator penetrates the negative zone of the indicator, although the current profile still allows for an upward swing that will allow the XRP/USD to remain on the upside.
The DMI on the daily chart shows the bears taking control of the pair although without the exaggeration we see today in the Bitcoin. The bulls are resisting the loss of control well and are holding at levels that would allow them to turn the situation around.
Author

Tomas Salles
FXStreet
Tomàs Sallés was born in Barcelona in 1972, he is a certified technical analyst after having completing specialized courses in Spain and Switzerland. He expanded his technical training following the guidance of great experts on the financial markets.


