Top 3 Price Prediction Bitcoin, Ethereum, Ripple: Keltner-Bollinger pattern on Bitcoin dominance
- Keltner-Bollinger pattern activation predicts strong movement in the Bitcoin dominance chart in the coming sessions.
- The most likely development would negatively affect Bitcoin, but it would put the crypto segment on the path of the moon.
- Ripple is in danger of falling to multi-year lows.

The crypto universe moves between boredom and nervousness. Today, the focus is on the quadruple expiration of Bitcoin options and futures.
In a few hours, $1 billion in options and futures contracts on Bitcoin will expire, and with this event, an increase in volatility in the market's leading cryptocurrency.
From a technical point of view, there is no data to support a violent move, at least in the BTC/USD pair. Where there are technical indications that an intense market movement is coming is in the Bitcoin Dominance chart.
In technical analysis, there is a pattern of detecting volatility bursts, the Bollinger-Keltner pattern. This pattern inserts both indicators into the same chart, and works as it follows:
- Condition A: The Bollinger Bands are brought very close together by a radical drop in volatility.
- Condition B: The Bollinger Bands are within the Keltner Bands.
- Signal: The pattern is activated when the Bollinger Bands move out of the Keltner Band range again.
- Development: The model explains the first movement in zig-zag, with a first short segment and a second movement in the opposite direction, in this latter case of great magnitude and speed.
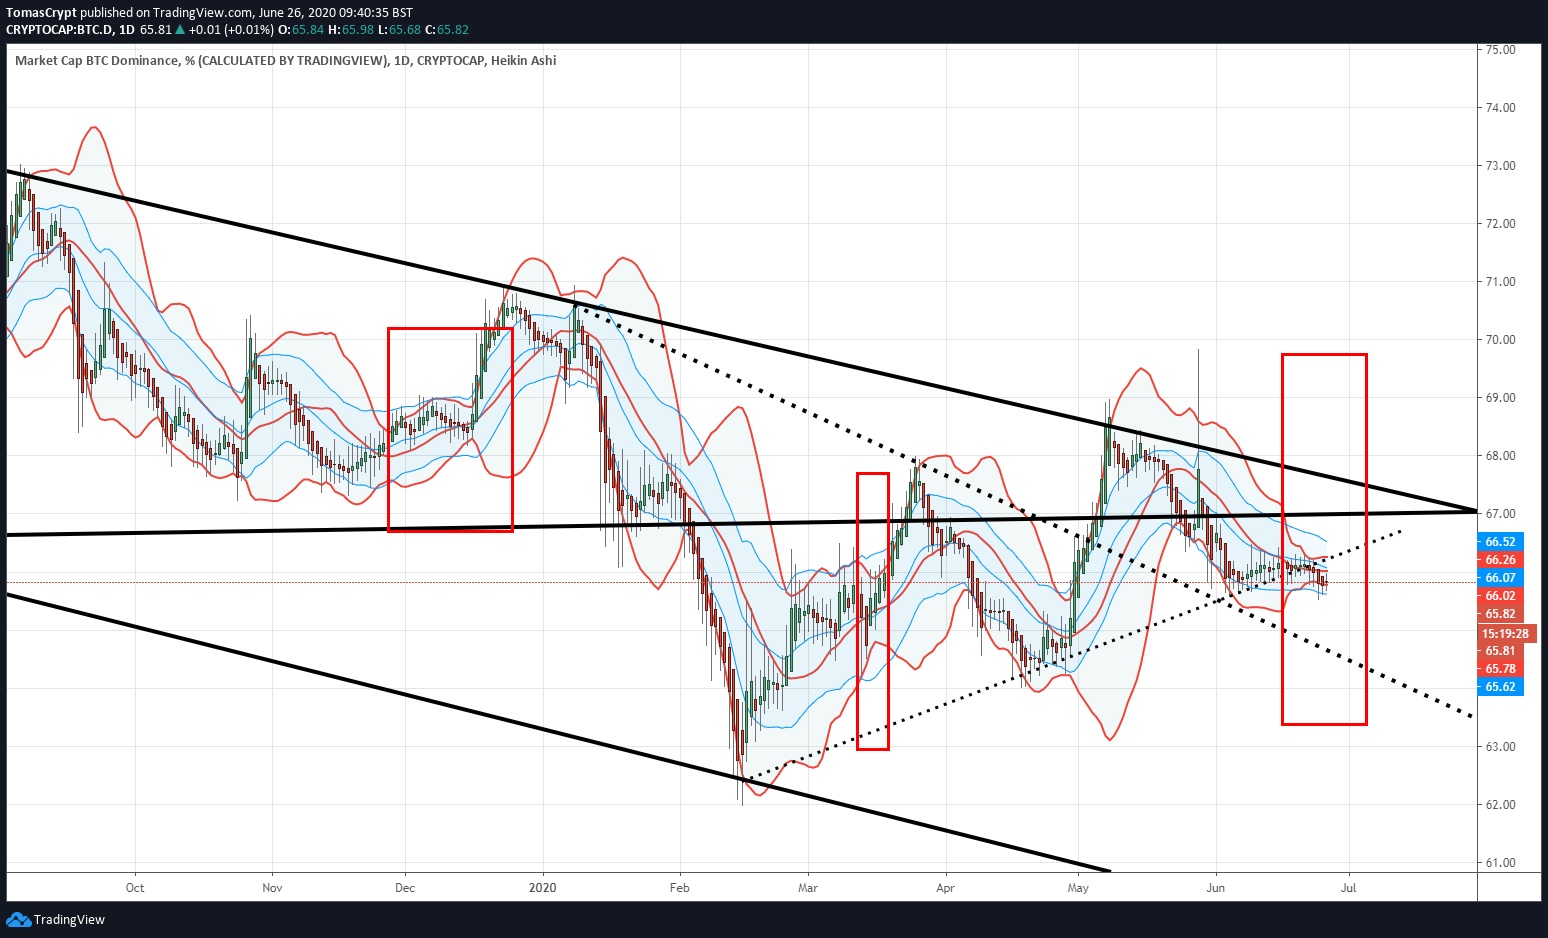
In the Bitcoin Dominance chart, we can see how since December 2019 this pattern has occurred three times, now in development a fourth, and how once the Bollinger Bands give the signal there is a zig-zag movement with strong directionality.
The information provided by the Keltner-Bollinger pattern doesn't include the direction the price will take. Still, given the recent break in the Bitcoin dominance chart's supports we could expect a first upward movement of the BTC dominance chart, positive for Bitcoin, and then a violent collapse in search of the 60% dominance level, positive for Altcoins.
ETH/BTC Daily Chart
The ETH/BTC pair is currently trading at the price level of 0.02513 and is looking for support on the upper line of the triangle figure broken four days ago. The loss of this support level would be a severe blow to the market's bullish expectations.
Above the current price, the first resistance level is at 0.026, then the second at 0.0278 and the third one at 0.0295.
Below the current price, the first support level is at 0.025, then the second at 0.0248 and the third one at 0.0235.
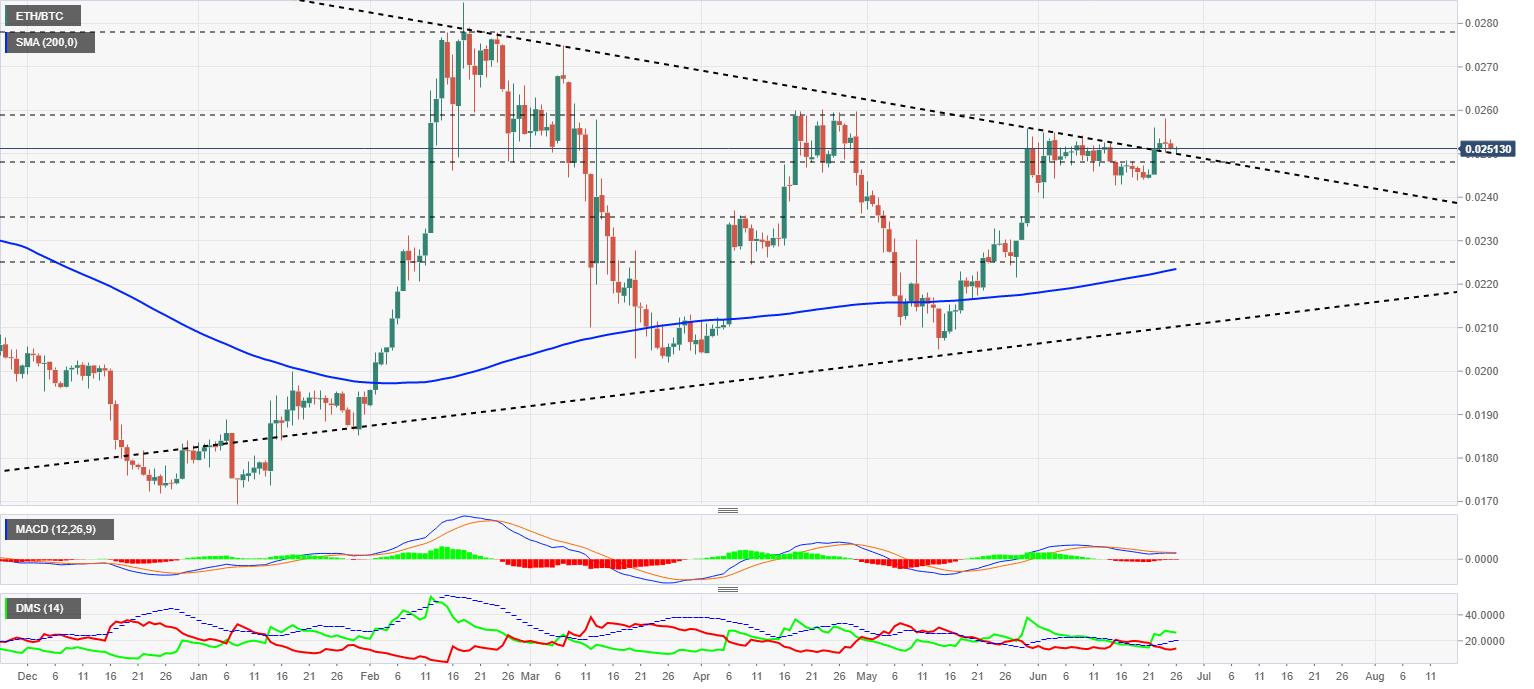
The MACD on the daily chart remains flat slightly above the neutral level of the indicator. The most likely development of this structure is bullish.
The DMI on the daily chart shows the bulls controlling the pair. The bears seem to be trying to approach the levels on the upside of the market.
BTC/USD Daily Chart
The BTC/USD pair is currently trading at the price level of $9088 and is looking for the lower part of the current triangle expansion scenario. A move below the $9050 price level would return the BTC/USD to the previous bearish scenario.
Above the current price, the first resistance level is at $9200, then the second at $9650 and the third one at $10400.
Below the current price, the first support level is at $9000, then the second at $8750 and the third one at $8400.
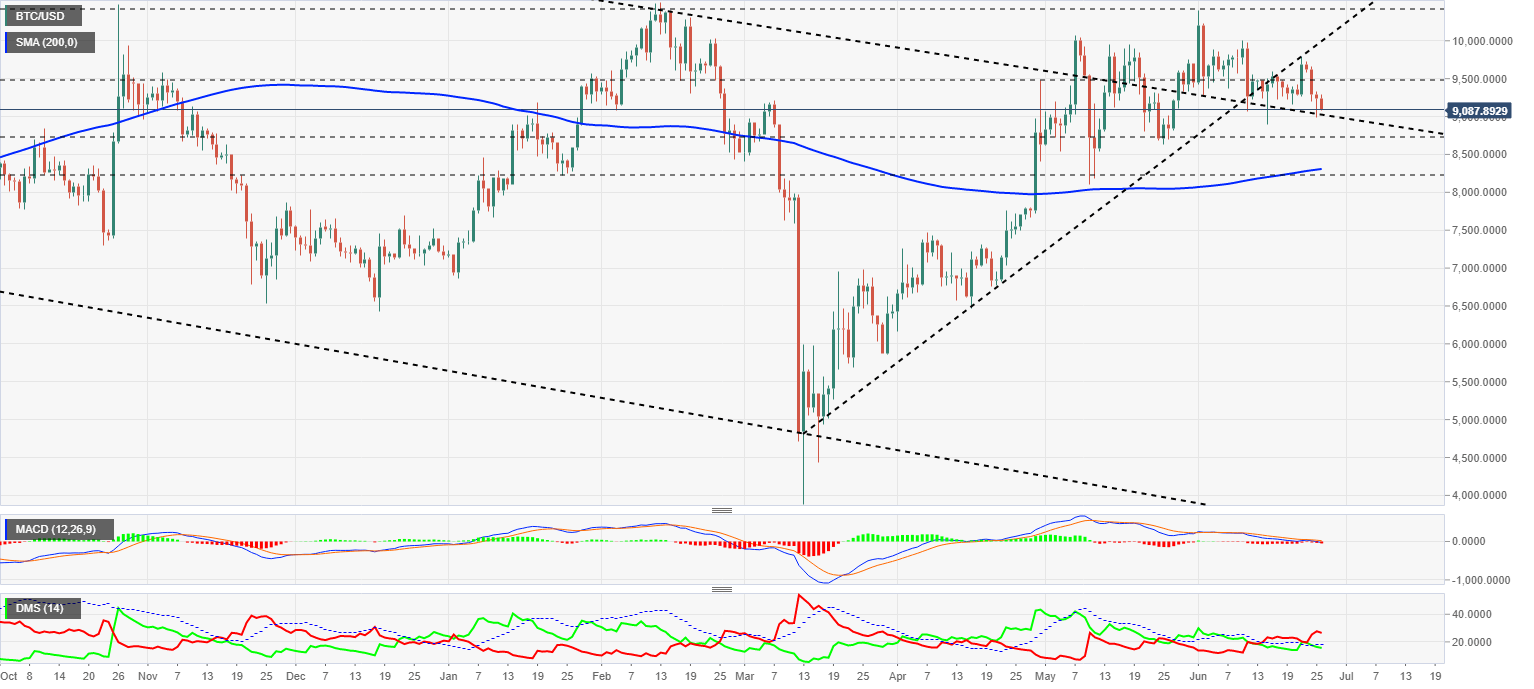
The MACD on the daily chart is slightly penetrating the bearish zone of the indicator. However, neither the slope nor the line spacing between averages augurs much potential for this movement.
The DMI on the daily chart shows the bears quite comfortably controlling the BTC/USD pair. The bears are staying close to the ADX line but with a clear downward direction.
ETH/USD Daily Chart
The ETH/USD pair is currently trading at $228.7 and has been down for three consecutive days after failing to break the $245 downward trend line. The 200-day simple moving average is sharply tilted higher and could provide vital support for the upward breakout by the end of August.
Above the current price, the first resistance level is at $235, then the second at $245 and the third one at $265.
Below the current price, the first support level is at $220, then the second at $200 and the third one at $188.
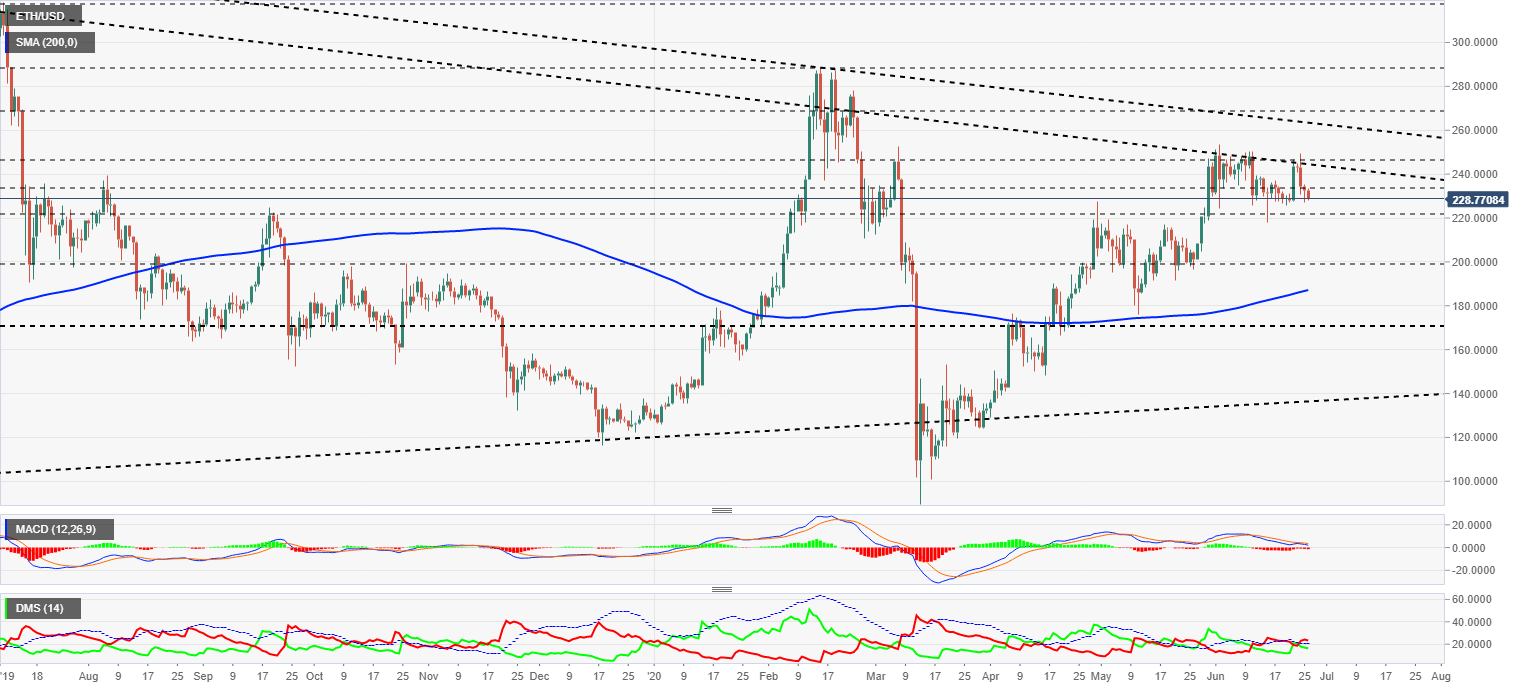
The MACD on the daily chart seems to be completing a pattern called "MACD crossover failure". This pattern develops with a first failed crossing attempt. Then, in a few days culminates in a valid and robust crossing.
The DMI on the daily chart shows bears with a small advantage over bulls. The selling side moves above the ADX line, which would reinforce its leading position.
XRP/USD Daily Chart
The XRP/USD pair is currently trading at the price level of $0.179 and is deepening into the negative territory of the chart after losing support at $0.185. The downside risk is very significant and could take the Ripple to multi-year lows.
Above the current price, the first resistance level is at $0.184, then the second at $0.189 and the third one at $0.202.
Below the current price, the first support level is at $0.163, then the second at $0.1405 and the third one at $0.113.
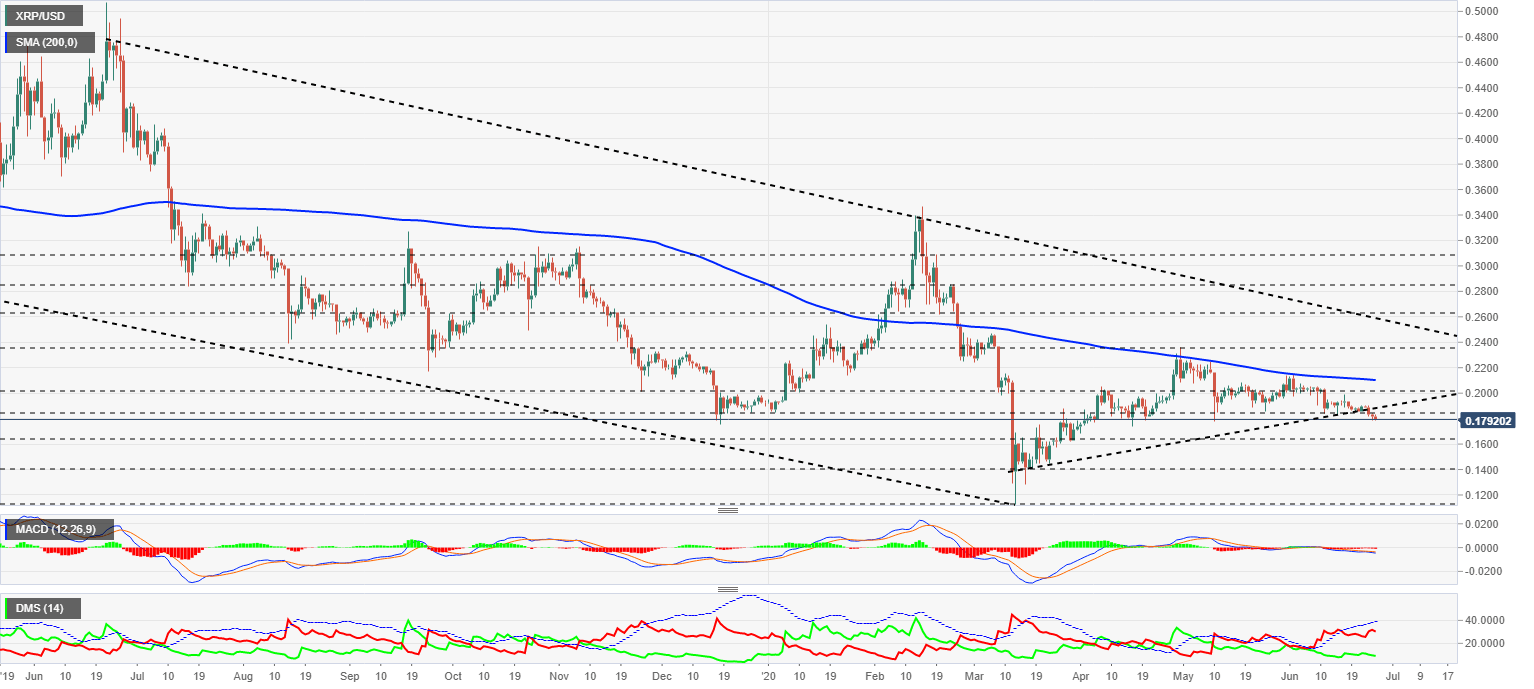
The MACD on the daily chart continues the slight downward trend of the earlier days. The moving averages lack the inclination and line spacing between averages, so we shouldn't expect significant movements in either direction.
The DMI on the daily chart shows bears with a significant advantage over bulls. The selling side is losing strength today, but the bulls are not responding and are also moving towards lower levels of trend force.
Author

Tomas Salles
FXStreet
Tomàs Sallés was born in Barcelona in 1972, he is a certified technical analyst after having completing specialized courses in Spain and Switzerland. He expanded his technical training following the guidance of great experts on the financial markets.


