Top 3 Price Prediction Bitcoin, Ethereum, Ripple: It is time for King Bitcoin
- The technical resistances benefit Bitcoin and can boost it to all-time highs.
- Ripple can follow King Bitcoin and move towards the $0.50 price level.
- Ethereum is very limited by technical resistance and could reach "only" the price level of $580.

The crypto board starts the week stuck on critical levels. The war for dominance has been favorable to Ethereum for weeks, and the graphics seem to indicate that it's now Bitcoin's turn to win a few battles.
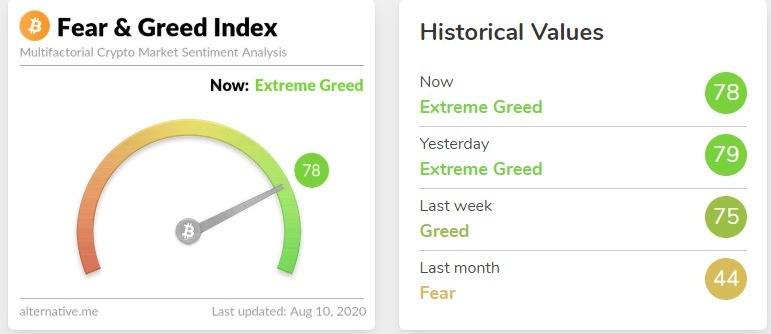
Source: alternative.me
Market sentiment has changed dramatically from the neutral/negative position of the current movement's beginning. The indicator prepared by the site alternative.me marks today the level 78 – extreme confidence – and reinforces the idea that the crypto market needs a break.
ETH/BTC daily chart
The ETH/BTC chart leaves the maximum upward movement at the 0.035 level, a price level that has been very important in the price history and has caused pauses in price development.
ETH/BTC moved through these levels for weeks in late 2018 and early 2019. It would be strange if the resistance level were now easily crossed, and the most likely scenario is to see Bitcoin perform better than Ethereum.
ETH/BTC pair is currently trading at the price level of 0.033 and is losing price support at 0.0335.
Above the current price, the first resistance level is at 0.0335, then the second at 0.035 and the third one at 0.0368.
Below the current price, the first support level is at 0.0315, then the second at 0.030 and the third one at 0.0292.
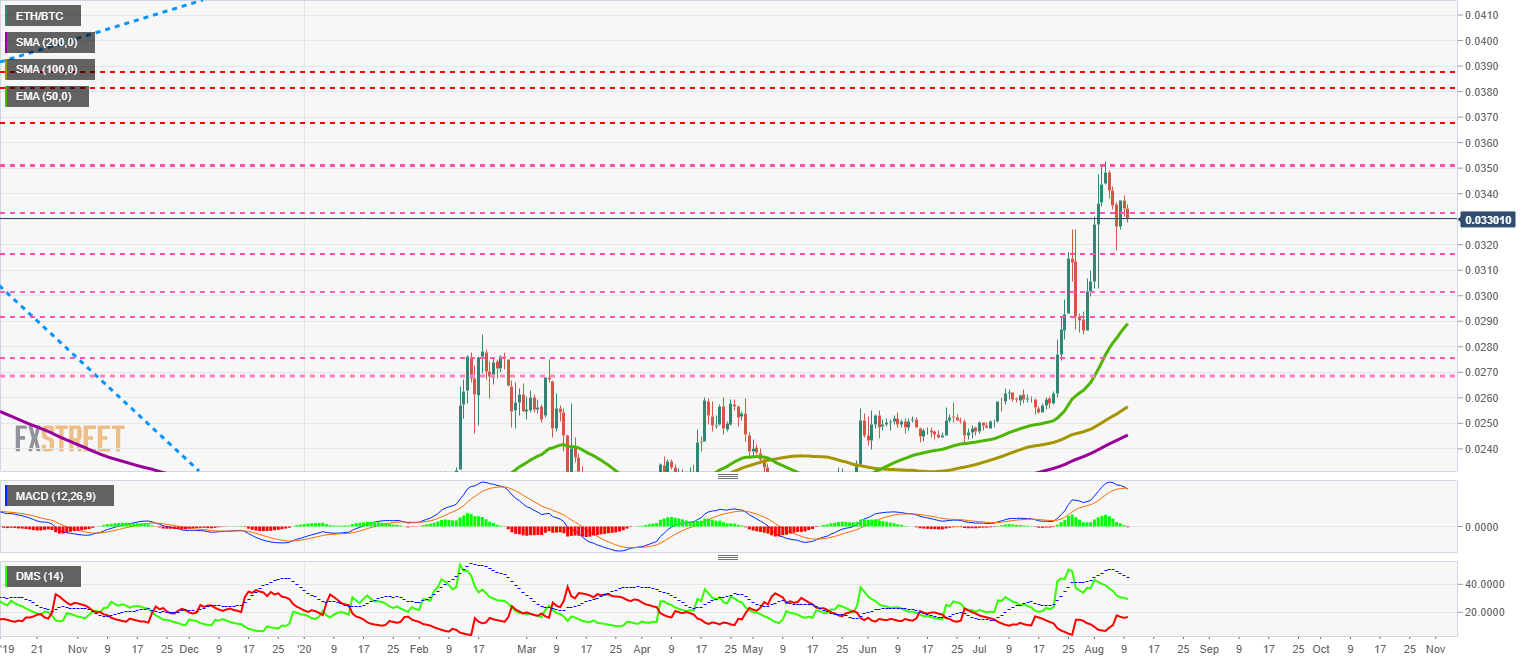
The MACD on the daily chart is crossing downward and confirms the loss of Ethereum's strength against Bitcoin. The most likely development for the ETH/BTC pair is bearish, with a possible drop in the search for the main moving averages.
The DMI on the daily chart shows the bulls still have an advantage over the bears. The selling side shows a bullish structure, and bears could make soon an attempt to take control of the pair.
BTC/USD daily chart
The BTC/USD pair is currently trading at the price level of $11988 while playing with the critical resistance level of $11850. This resistance level surpassed in previous days, but in the end, the price closed below it and undid the bullish signal.
Above the current price, the first resistance level is at $14000, then the second at $17100 and the third one at $19689.
Below the current price, the first support level is at $11850, then the second at $11280 and the third one at $10680.
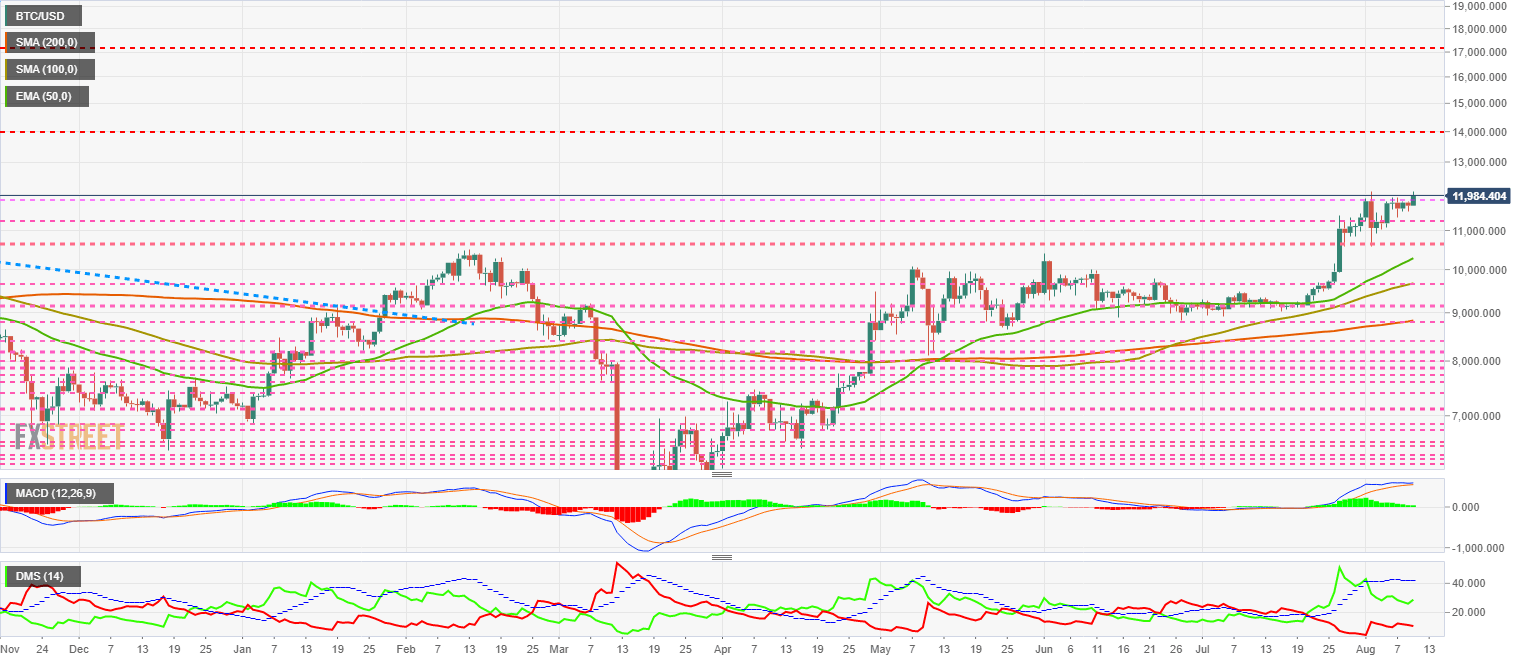
The MACD on the daily chart shows depletion in the upward movement, although a daily close at current levels would cause the move to extend to new relative highs or even new historical highs.
The DMI on the daily chart shows the bulls rebounding upward, while the bears continue to fall smoothly. The ADX remains at high levels despite the price breakout, a pattern that gives strength to a possible upward extension.
ETH/USD daily chart
The ETH/USD pair is currently trading at the price level of $397.12 as it continues to look for ways to break out of the price congestion resistance level at $400. The current bullish channel gives room for the price to rise above $580, still a long way from the historical highs. This data reinforces a scenario of better development for Bitcoin in the coming days.
Above the current price, the first resistance level is at $460, then the second at $480 and the third one at $520.
Below the current price, the first support level is at $390, then the second at $360 and the third one at $315.
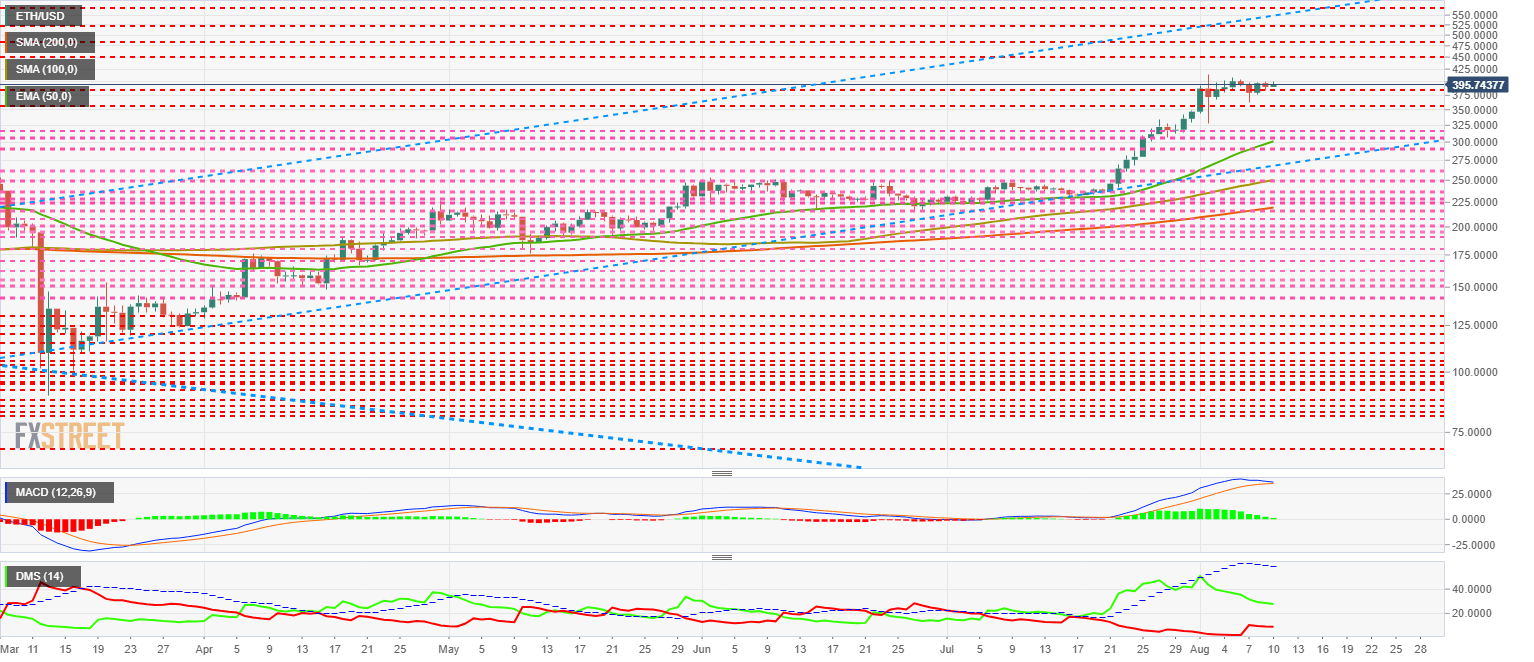
The MACD on the daily chart shows a depletion profile of the previous bullish trend. The position of the moving averages allows for a further upward movement, similar to that shown on the BTC/USD chart.
The DMI on the daily chart shows the bulls losing strength gradually, although the leadership of the bought side is not at risk because the bears are not interested in disputing the dominance of ETH/USD.
XRP/USD daily chart
The XRP/USD pair is currently trading at the price level of $0.2999 and is attempting to regain the $0.30 level. The bullish channel projected on the chart places the price target for the current movement above $0.50.
Above the current price, the first resistance level is at $0.30, then the second at $0.32 and the third one at $0.34.
Below the current price, the first support level is at $0.288, then the second at $0.265 and the third one at $0.255.
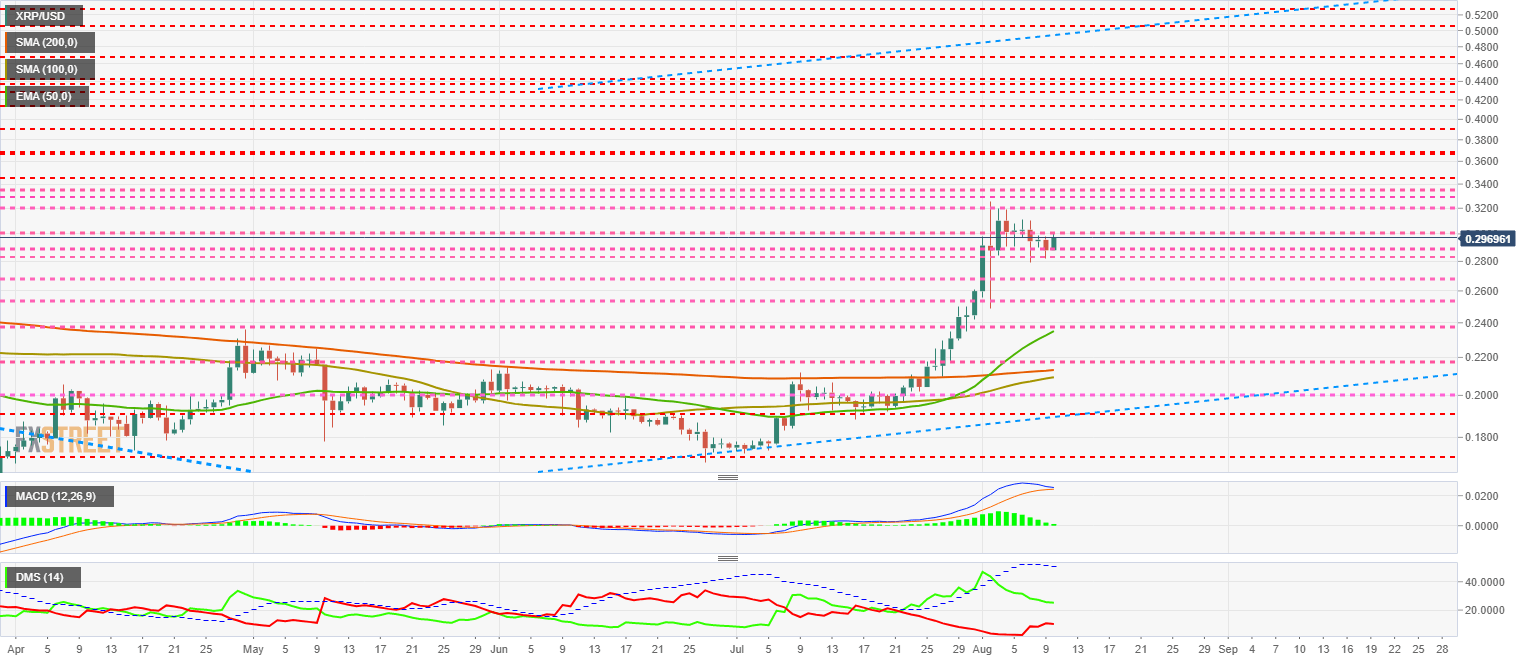
The MACD on the daily chart shows a depletion profile of the current bullish trend, although it shows a high probability of developing an upward extension of the movement.
The DMI on the daily chart shows the bulls improving after a few days of losing traction. Bears, which have been improving in the past few days, seem to be losing momentum in the last few hours.
Author

Tomas Salles
FXStreet
Tomàs Sallés was born in Barcelona in 1972, he is a certified technical analyst after having completing specialized courses in Spain and Switzerland. He expanded his technical training following the guidance of great experts on the financial markets.


