Top 3 Price Prediction Bitcoin, Ethereum, Ripple: Goldman Sachs puts Bitcoin on par with Gold
- In a conference for clients, Goldman Sachs bank put in the same headline inflation, Gold and Bitcoin.
- The business around the interchange of cryptocurrencies begins to yield properly.
- Ripple's CEO draws attention to China in the race for digital national currencies.

One of the world's largest investment banks, Goldman Sachs, announced a conference for its clients entitled “Implications of Current Inflation, Gold and Bitcoin Policies”.
No details of the above are known, but the crypto ecosystem takes as good news the simple fact that Bitcoin is treated on par with Bitcoin by an institution like Goldman Sachs.
The adoption of Blockchain technology is accelerating. A look at the latest news:
Brad Garlinhouse, CEO of Ripple Ltd, has requested through a Tweet that American lawmakers move quickly towards greater integration of digital currencies into the real economy. According to Mr Garlinhouse, the US cannot stand by and watch China's rapid progress in this field.

In India, the central bank (RBI) has authorised commercial banks to provide services to the cryptocurrency industry, something forbidden until now.
Another sign of the growing adoption of Blockchain technology is the generation of usage fee income. In the last 24 hours alone, the Ethereum network has generated over $426K in fees. The Bitcoin network has generated in the same time frame $827K in transactions commissions.
ETH/BTC Daily Chart
The ETH/BTC pair is currently trading at the price level of 0.0224. The 50-day exponential moving average is offering stiff resistance to the advance and could take ETH/BTC to the 0.022 level
Above the current price, the first resistance level is at 0.023, then the second at 0.0242 and the third one at 0.0254.
Below the current price, the first support level is at 0.0226, then the second at 0.022 and the third one at 0.0217.

The MACD on the daily chart flattens out when the indicator reaches the neutral level. The ETH/BTC pair has recently needed several days of lateral movement to cross over to the bullish side of the indicator.
The DMI on the daily chart provides us with a clearer picture of the current situation. The bulls have lost all their advantage over the bears and are now facing each other.
BTC/USD Daily Chart
The BTC/USD pair is currently trading at the price level of $9174 and holds above the price congestion support of $9150. The 50-day exponential moving average is rising rapidly and already offers support at the price level of $8600.
Above the current price, the first resistance level is at $9600, then the second at $10000 and the third one at $10400.
Below the current price, the first support level is at $9150, then the second at $8750 and the third one at $8575.
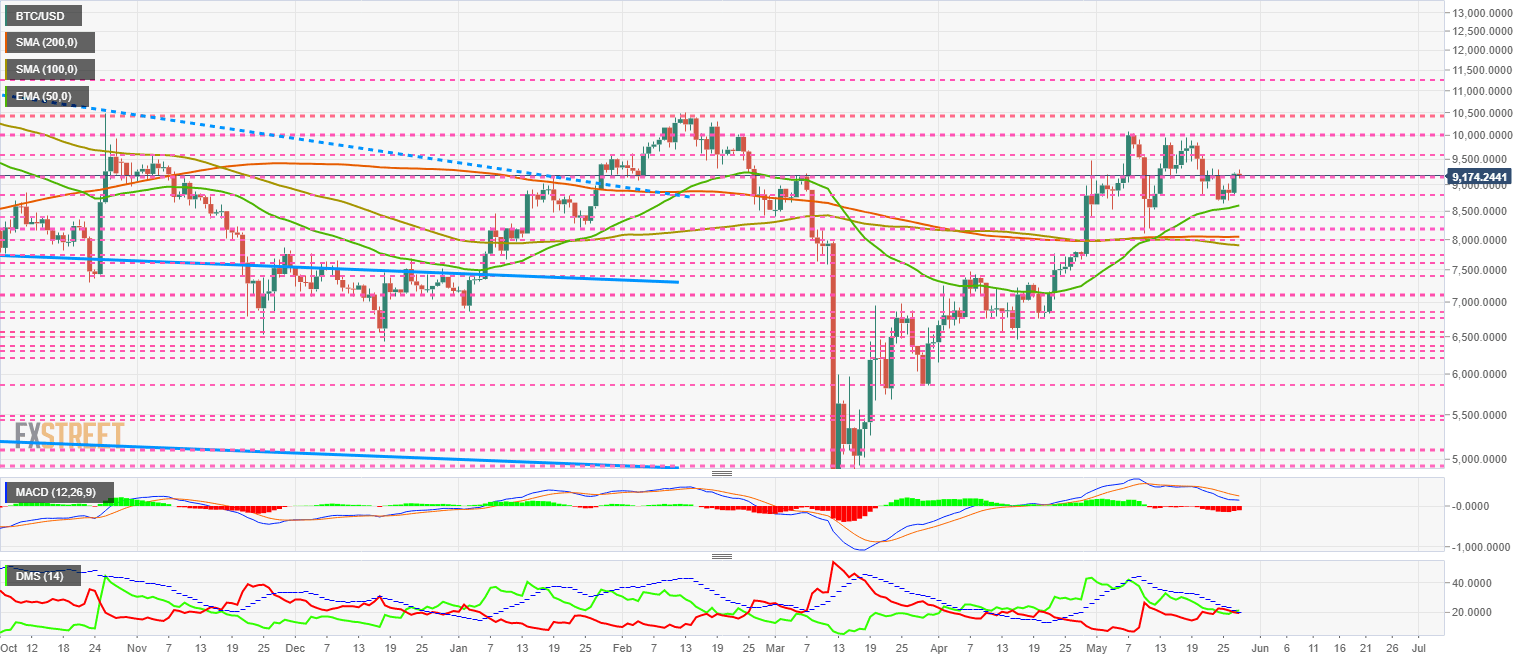
The MACD on the daily chart lose some of its downward momentum and is taking on a flat profile. The current structure of the moving averages is similar to that of the beginning of March. A few days later the price of the BTC/USD pair plummeted.
The DMI on the daily chart confirms the open scenario we have seen in the ETH/BTC pair. The two sides of the market are facing each other, and the winner could lead the market in the coming weeks.
ETH/USD Daily Chart
The ETH/USD pair is currently trading at the price level of $206. It is holding on to the low above the price congestion support level of $205.
Above the current price, the first resistance level is at $208, then the second at $218 and the third one at $225.
Below the current price, the first support level is at $200, then the second at $195 and the third one at $190.

The MACD on the daily chart is the bullish side profile, and you can no longer distinguish between the moving averages that make up this indicator. The only thing it provides, in this case positively, is that it remains in the bullish zone.
The DMI on the daily chart shows the bears leading with a small advantage over the bulls. Both sides of the market are above the ADX line, which could lead to violent movements both upwards and downwards.
XRP/USD Daily Chart
The XRP/USD pair is currently trading at the price level of $0.1958 as it is unable to pass the confluence of the 50-day exponential moving average and 100-day simple moving average at $0.20
Above the current price, the first resistance level is at $0.20, then the second at $0.22 and the third one at $0.237.
Below the current price, the first support level is at $0.19, then the second at $0.18 and the third one at $0.163.

The MACD on the daily chart flattens out entirely above the zero levels of the indicator, continually playing with the upside and downside of the indicator.
The DMI on the daily chart shows the bears controlling the XRP/USD pair although they are losing support from the ADX line today. The bulls are moving upwards and could take advantage of the weakness on the selling side to try and take the lead in the pair.
Author

Tomas Salles
FXStreet
Tomàs Sallés was born in Barcelona in 1972, he is a certified technical analyst after having completing specialized courses in Spain and Switzerland.


