Top 3 Price Prediction Bitcoin, Ethereum, Ripple: FTX and MLB make history, as crypto majors show signs of life
- Bitcoin price completes an Elliot five waves down pattern.
- Ethereum logs a doji candlestick pattern after closing down just -0.21% yesterday.
- XRP price contained by three technical indicators, generating today’s 17% rebound.

Bitcoin price briefly sweeps the May 19 low to confirm five waves down and flashes a bullish momentum divergence in the process. Ethereum doji candlestick pattern triggered today as ETH climbs above pattern’s high. XRP price respects support in a challenging two days of trading.
FTX announces a long-term, global partnership with Major League Baseball
FTX and Major League Baseball (MLB) sign the first-ever partnership between a professional sports league and a cryptocurrency exchange. The agreement is intended to boost brand recognition for FTX and signal a more innovative MLB.
The FTX and MLB partnership provides FTX with worldwide marketing rights associated with MLB marks, logos and special events. Fans will see applicable FTX brand promotion “around nationally televised MLB games, MLB.com, MLB Network, MLB.TV, social media platforms and more high-impact baseball media.”
Beginning with the MLB All-Star game on July 13th, an FTX.US logo patch will be seen on all umpire uniforms for regular season, postseason, spring training and Jewel Event games.
FTX CEO and founder Sam Bankman-Fried highlighted the company’s desire to have a global impact and how the MLB international fan base is the perfect platform to pursue that mandate.
At FTX, we strive each day to make a positive global impact, and there is no better partner for us to achieve this goal with than with MLB and its international fan base.
MLB was equally excited about the opportunity as the oldest professional sports league partners “with a global leader in the early stages of their unbelievable growth.”
In parallel, FTX.US, the cryptocurrency exchange’s American division, has established an agreement with the MLB Players Inc., a subsidiary of the MLB Players Association “that manages all the commercial activities for the organization.” FTX will have group player rights, which will allow the company to use highlights of players in content creation.
It is a five-year deal, but financial terms were not disclosed. Nevertheless, the partnership continues the energetic push of FTX to use sports as a platform for growth. The plan has included the naming rights for the Miami Heat arena for $135 million over 19 years and the impressive multimillion dollar partnership with eSports team TSM.
Bitcoin price risk vs. reward opportunity may have flipped to the upside
Bitcoin price may have printed a meaningful low yesterday as the flagship cryptocurrency briefly swept the May lows before reversing higher. The washout delivered an Elliot five wave down pattern and confirmed a bullish momentum divergence on the daily chart.
A bullish momentum divergence occurs when price prints a new low, but the Relative Strength Index (RSI) does not confirm with a new low. The last bullish momentum divergence was at the December 17, 2019 low. BTC went on to rally 60% into the February 13, 2020 high.
Despite the bullish implications of yesterday’s price action and today’s follow-through, it is essential to be aware that Bitcoin price also triggered the massive head-and-shoulders pattern with a trade below the neckline at $30,460. Of course, it could be just a bear trap, but more BTC price action is needed to confirm a sustainable low.
A daily close above $35,741 would be the first type of confirmation BTC investors need to ponder an initial long position. After that, it should free Bitcoin price to revisit the intimidating resistance between $41,986 and $43,256. The range includes the 50-day SMA, 38.2% Fibonacci retracement of the April-June correction and the 200-day SMA.
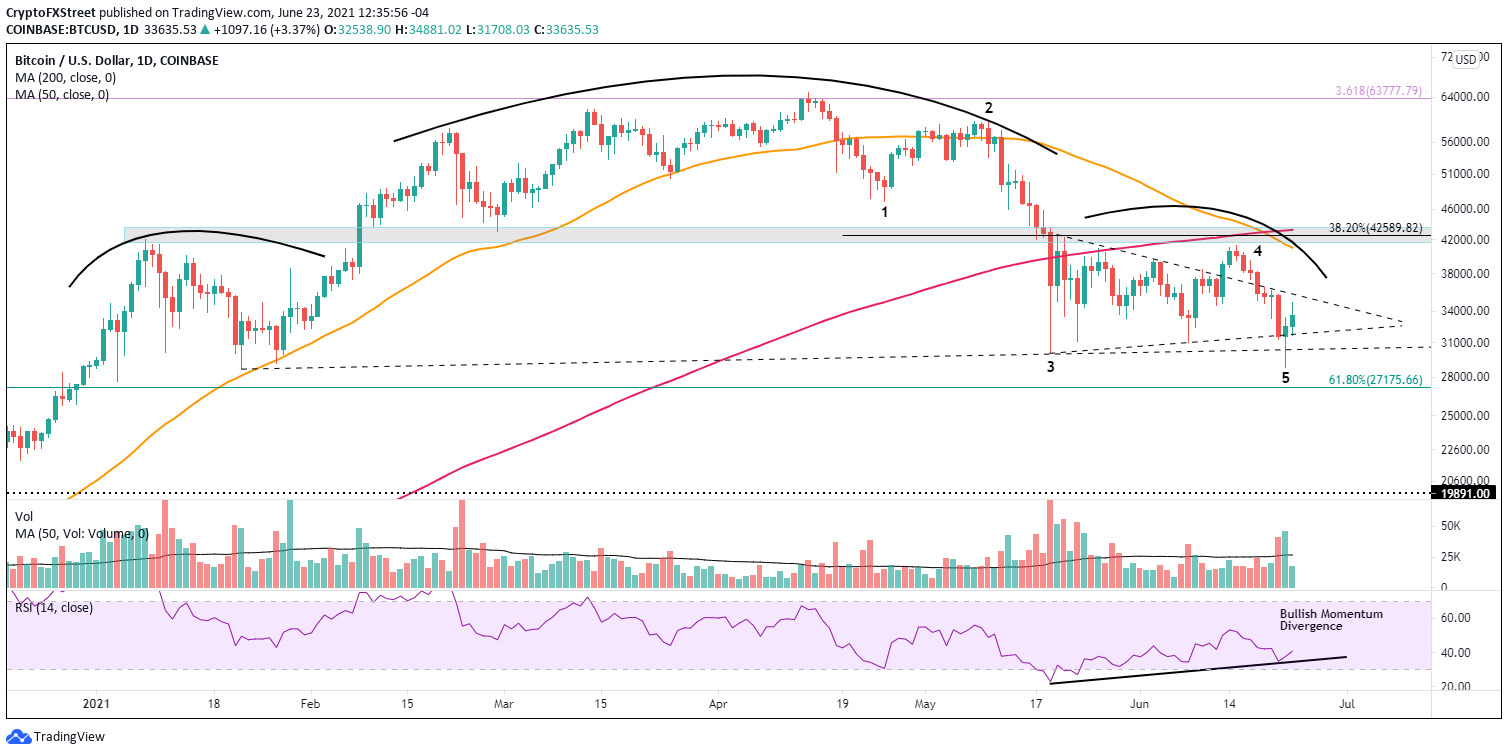
BTC/USD daily chart
Important things occurred yesterday that may signal an end to the multi-month correction, but BTC investors cannot overlook the dominant head-and-shoulders pattern triggered yesterday. The bullish reversal could also be a tricky message by Bitcoin price intended to fool the bullish market operators.
Bitcoin price and technical indicators did leave a few clues about BTC intentions, but patience remains warranted until the $35,741 is surpassed on a daily close.
Ethereum price respects pivotal support in a tricky tape
The positive response of Ethereum price to the outstanding support framed by the 200-day SMA at $1,878, the 2020 rising trend line at $1,793, the 61.8% retracement of the March 2020-May 2021 advance at $1,730 and the May 23 low of $1,728 created a hint of optimism for enthusiastic ETH investors and short term speculators.
Adding some comfort is Ethereum price closed yesterday with a doji candlestick pattern on the daily chart, showing indecision on the side of both ETH sellers and buyers. It could also represent a reversal point for the decline or the beginning of a consolidation range. Nevertheless, the doji pattern communicates that the early selling pressure was matched with spirited accumulation as the day progressed into the close.
The Ethereum price bounce and resulting doji pattern is a marked improvement for the smart contracts giant and today’s follow-through, if it holds, is a constructive development. Still, they do not confirm a viable low has been printed. Today’s failure at the February high of $2,041, a recognizable level of resistance and support for the last few months, reveals the technical hurdles that await ETH if the rebound gains traction.
Ethereum price needs a daily close above Monday’s high of $2,259 to confirm a meaningful low has been established. ETH investors could target the symmetrical triangle’s apex at $2,716 and the declining 50-day SMA at $2,815, generating a 25% profit for timely speculators.
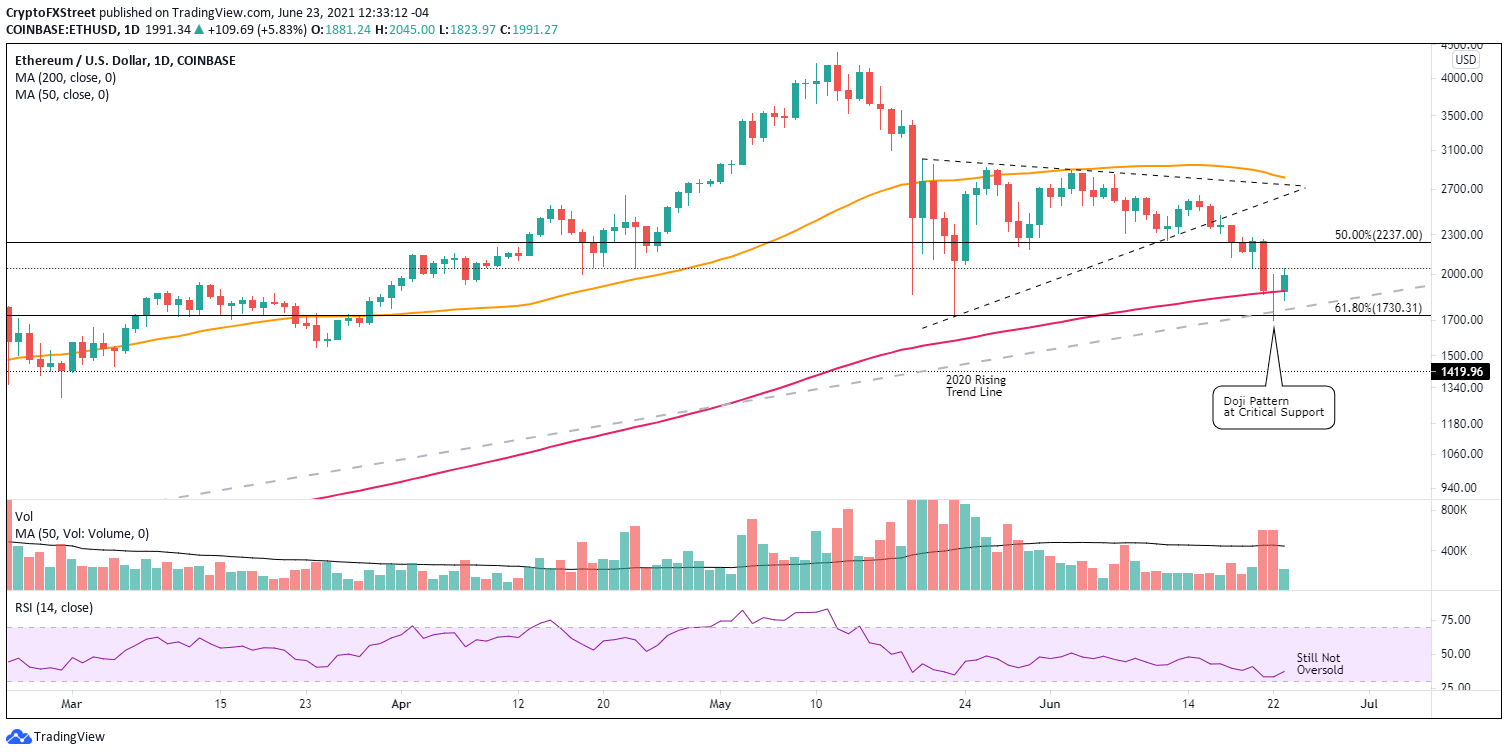
ETH/USD daily chart
A daily close below yesterday’s low of $1,700 (magnet effect of round numbers) would confirm that the ETH selling pressure has not been exhausted. The digital asset may fall to the 2018 high of $1,419, thereby ensuring an oversold condition on the daily RSI. A test of the 2018 high would represent a 28% decline from the current price.
XRP price hangs on as support levels converge
At yesterday’s low, XRP price had declined over 70% from the April high and 50% from the June 1 high while also destroying the May 23 low of $0.652. Nonetheless, Ripple realized three important technical milestones that provoked a commanding level of support: a test of the 78.6% retracement of the December 2020-2021 advance at $0.555, a touch of the 50-week SMA at $0.539 and an oversold reading on the daily RSI for the first time since late December 2020.
The failure of XRP price to close yesterday with at least a doji candlestick or a gain does suggest that residual selling may persist in the immediate future before Ripple engages the 200-day SMA at $0.728 and the critical resistance now defined by $0.760. However, a daily close above $0.652 would put the international settlements token in a credible position to embark on a rally to those levels.
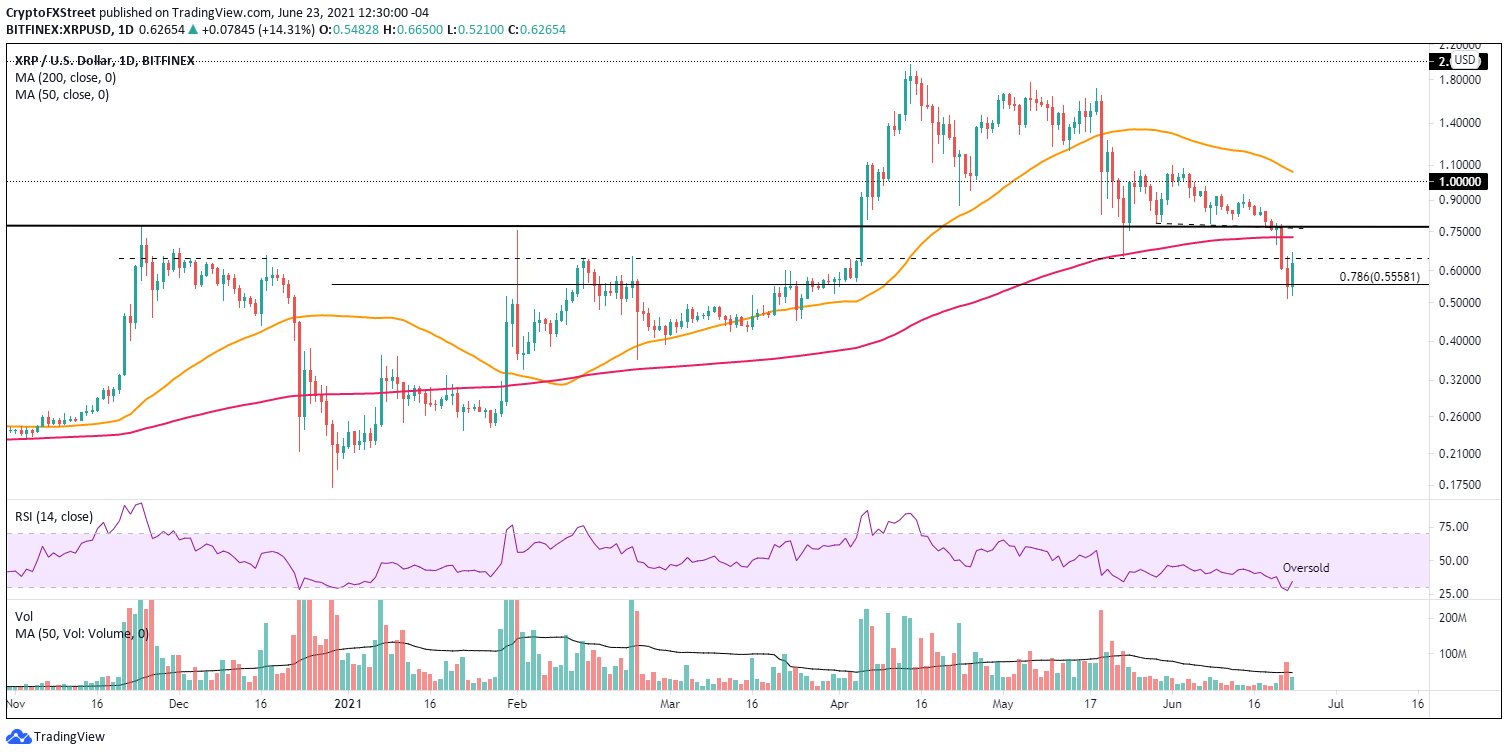
XRP/USD daily chart
Alternatively, XRP price may trade in a range in the short-term, framed by yesterday’s low of $0.512 and the May 23 low of $0.652, putting the pressure on Ripple speculators to refrain from knee-jerk trading decisions without price confirmation.
Any heavy selling pressure below yesterday’s low would leave XRP price unimpeded to suffer a surprisingly large sell-off.
The cryptocurrency market is a unique arena for market technicians. It is just supply and demand at its most extreme. There are no earnings, valuation metrics or government intervention (yet). Instead, fear and greed drive the ship, placing technical analysis at the apex for analysis and projections.
Author

Sheldon McIntyre, CMT
Independent Analyst
Sheldon has 24 years of investment experience holding various positions in companies based in the United States and Chile. His core competencies include BRIC and G-10 equity markets, swing and position trading and technical analysis.



