Top 3 Price Prediction Bitcoin, Ethereum, Ripple: Dominance struggle intensifies
- Dominance charts show high levels of stress in crypto market fundamentals.
- Bitcoin strives to win, while Ethereum strives to resist in front of the king.
- Ripple Ltd's poor results impact on an XRP lacking in positive news.

The fight for market dominance between Bitcoin and Ethereum has taken its toll on the crypto market as a whole.
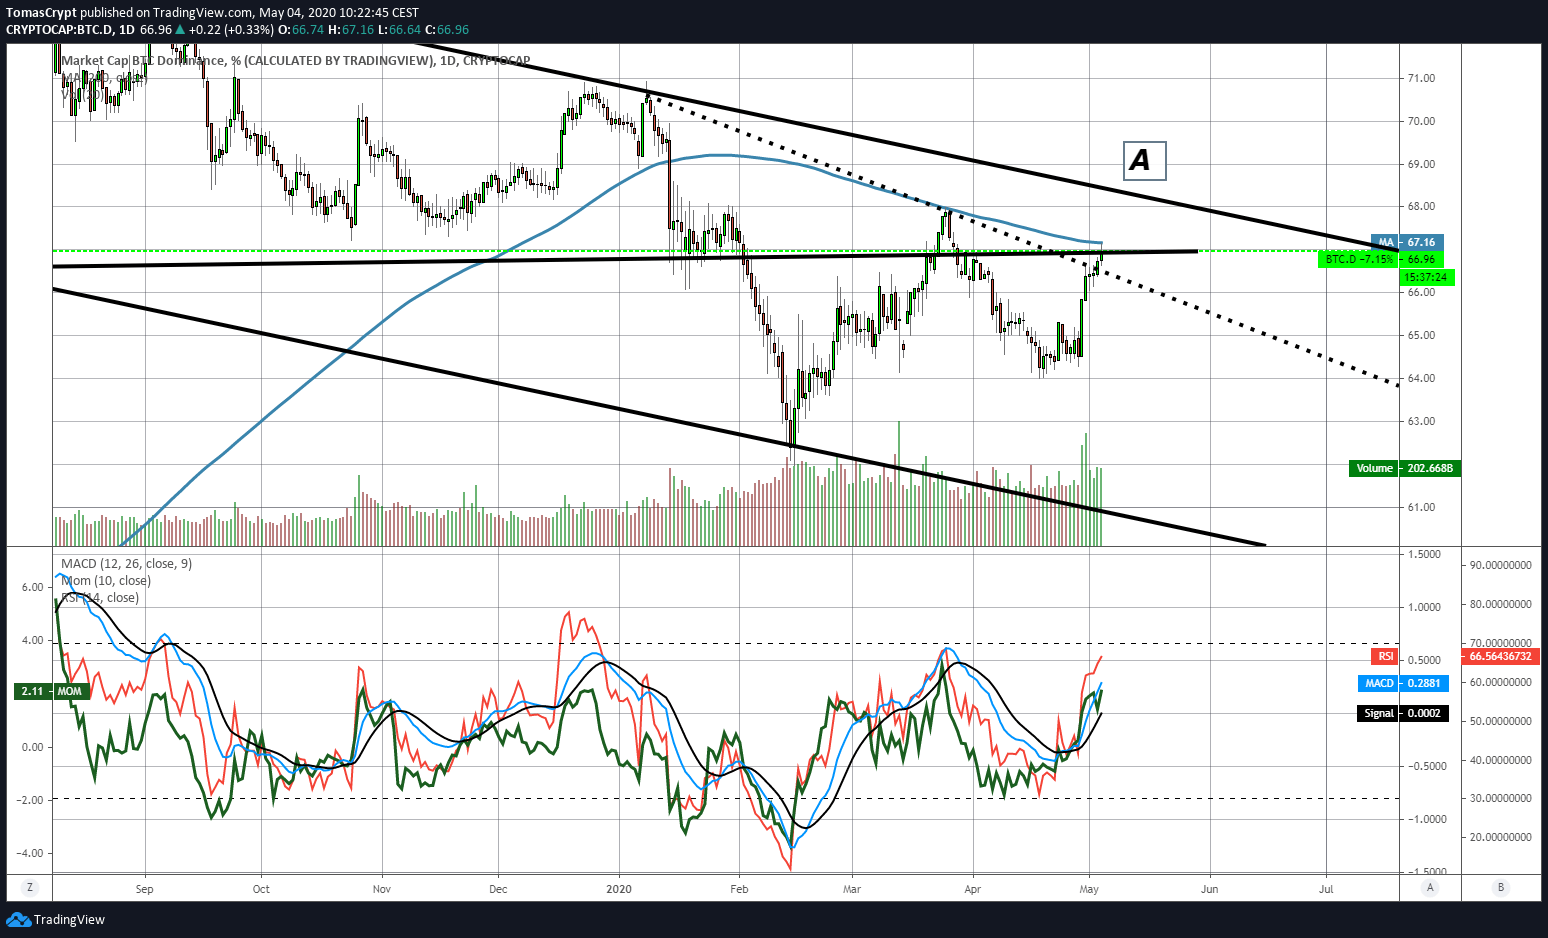
During the weekend, Bitcoin managed to overcome the first resistance level created by a medium-term downward trend line. But today it meets the 200-day simple moving average and the upward movement has become more complicated.
The Bitcoin now has a 67.16 level of market dominance, and if it manages to overcome the current obstacle, the primary target will be the 68.3 level, right at the top of the long term bearish channel (A).
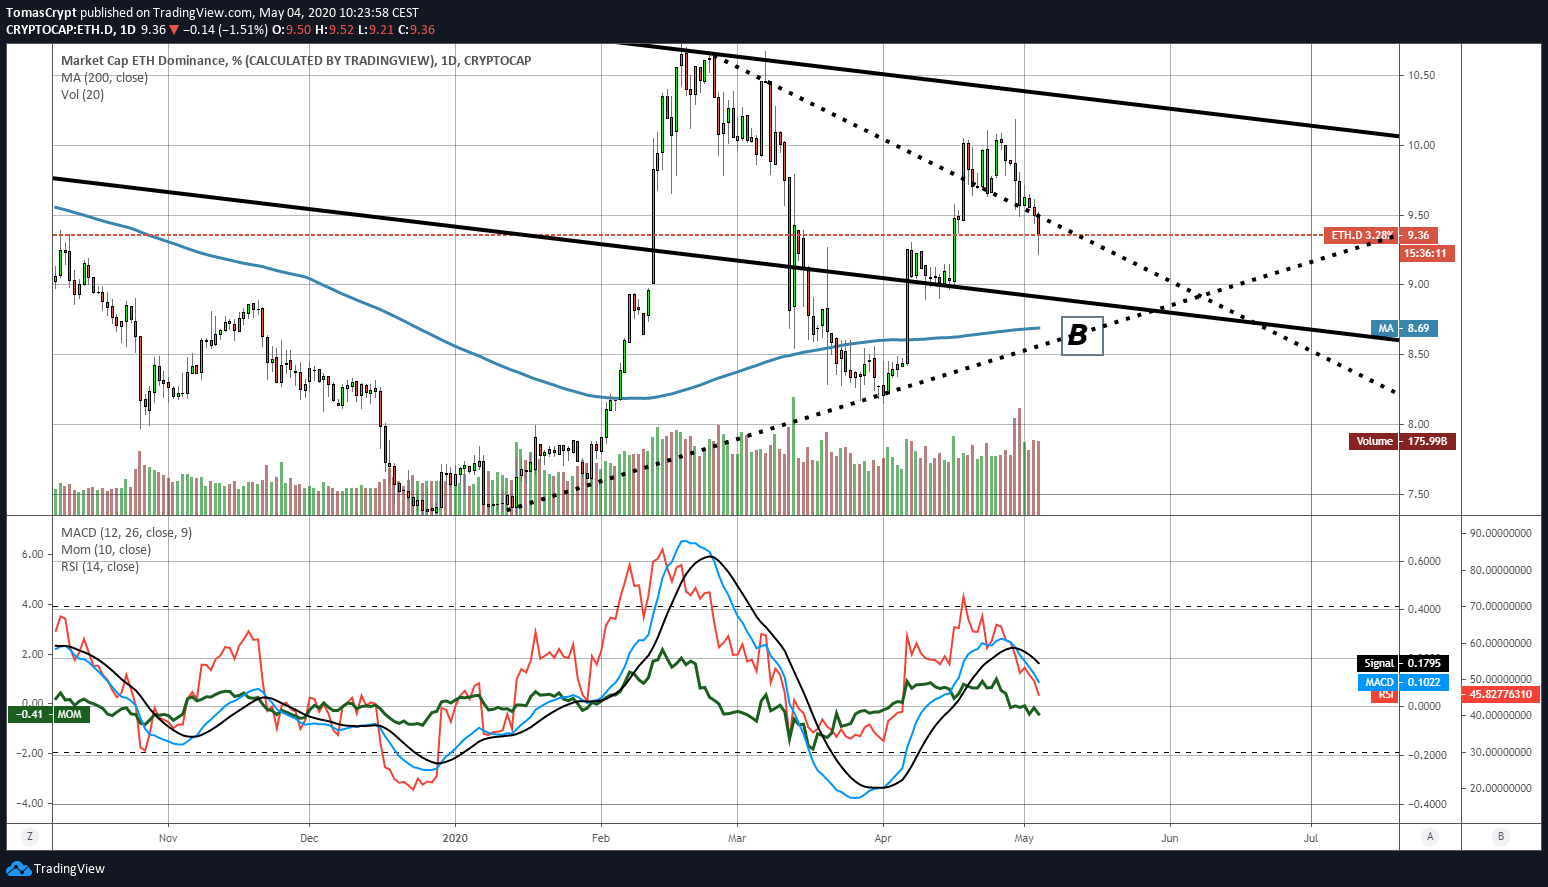
It is easy to imagine the potential impact on the structure of the crypto market of this moment in which the two top representatives of the crypto segment are in opposite situations.
If Bitcoin manages to break the long-term bear channel upwards, it will immediately send Ethereum to a new bear scenario below its long-term bear channel. That would penalize ETH a lot in the medium and long term. The opposite situation, positive to Ether, would imply an increase in capital flowing into the Altcoin segment.
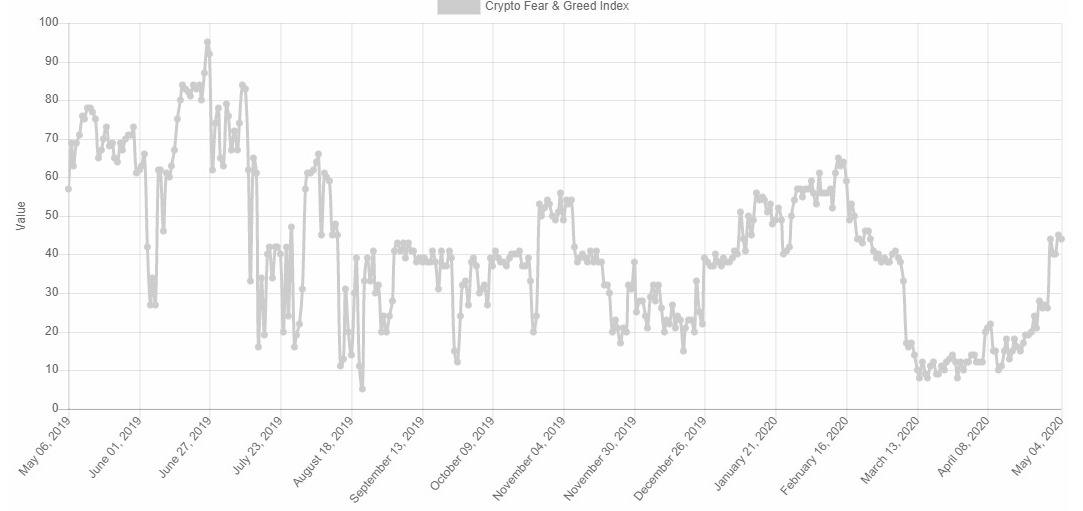
The market sentiment in the crypto segment, elaborated by the site alternative.me loses a point from yesterday's measurements, and at the 44 levels, it is on the verge of the optimistic side of the indicator.
Investors and cryptocurrency enthusiasts are not yet comfortable with the market and are still suspicious that the upward movement of the last few days is the long-awaited new bull market.
ETH/BTC Daily Chart
The ETH/BTC pair is currently trading at the price level of 0.0231, losing support at the 50-day exponential moving average and the 200-day simple moving average. The daily low is at the critical support level at 0.0227. Below this level, the technical structure would worsen for the Ether's interests against Bitcoin.
Above the current price, the first resistance level is at 0.0236, then the second at 0.0245 and the third one at 0.0255.
Below the current price, the first support level is at 0.0227, then the second at 0.0221 and the third one at 0.0215.
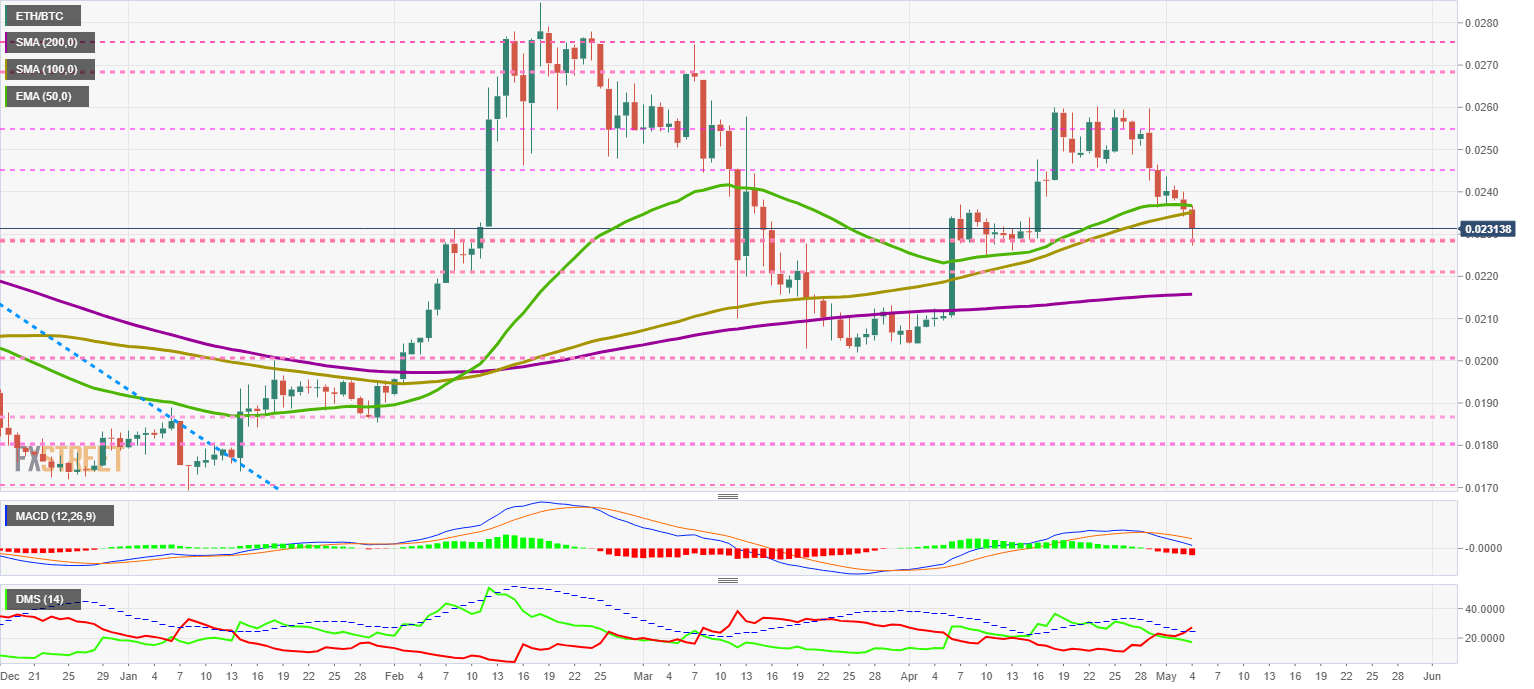
The MACD on the daily chart continues to cross downward as it approaches the neutral level of the indicator. The reaction of the price when the averages reaches this level is the key to the ETH/BTC pair for the medium term.
The DMI on the daily chart shows bears crossing the ADX line, activating a negative bearish pattern for the Ethereum's interests. The bulls remain at high levels of trend strength.
BTC/USD Daily Chart
The BTC/USD pair is currently trading at $8698 and remains at last week's relative high. The most critical support level is at the $8000 level where the 100-day simple moving average and the 200-day simple moving average add to the psychological factor of the round number.
Above the current price, the first resistance level is at $8800, then the second at $9200 and the third one at $9750.
Below the current price, the first support level is at $8400, then the second at $8200 and the third one at $8000.
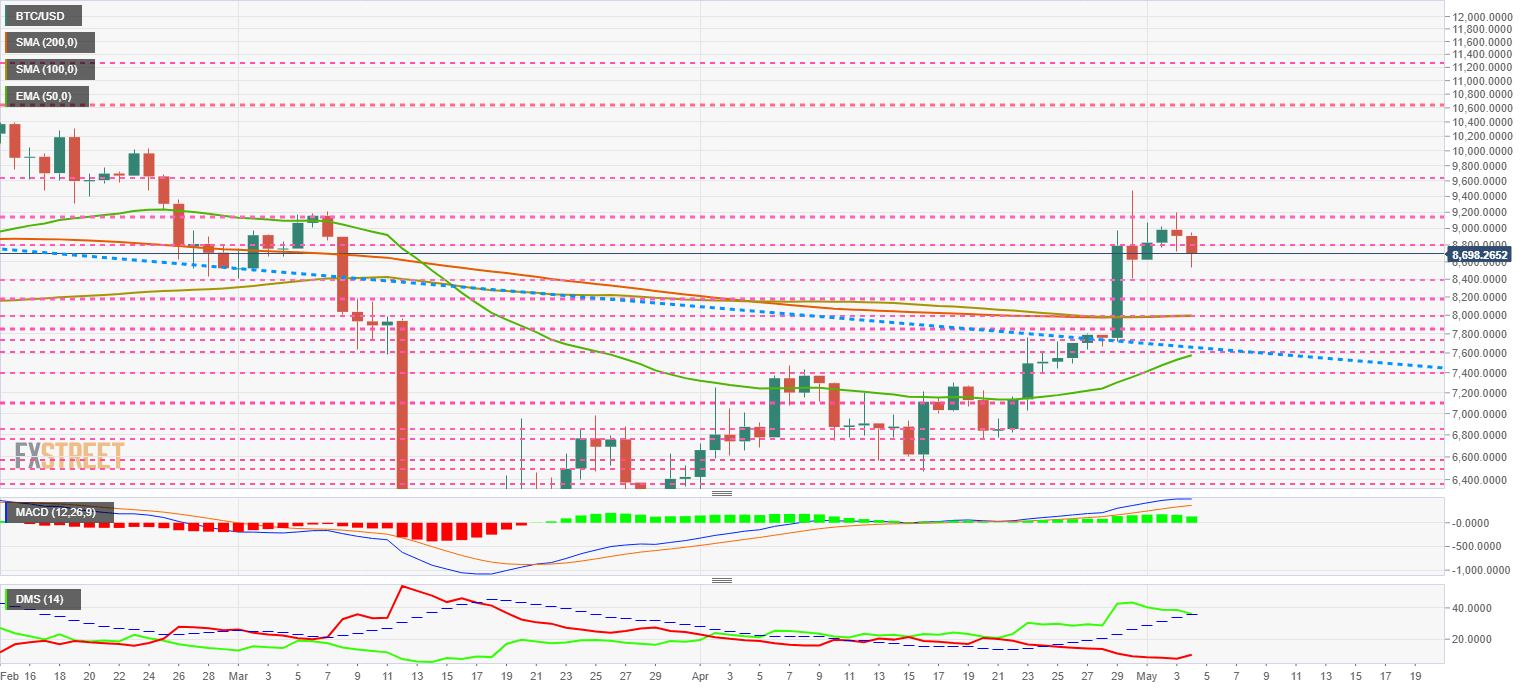
The DMI on the daily chart shows that the bulls almost broke the ADX line, which would end the bullish pattern and the BTC/USD pair would enter a more volatile phase with a tendency towards bearish shocks.
ETH/USD Daily Chart
The ETH/USD pair is currently trading at $199.9 and is losing its psychological support level at $200.
The major moving averages continue to trend higher between the price levels of $170 and $190.
Above the current price, the first resistance level is at $200, then the second at $208 and the third one at $215.
Below the current price, the first support level is at $195, then the second at $190 and the third one at $180.
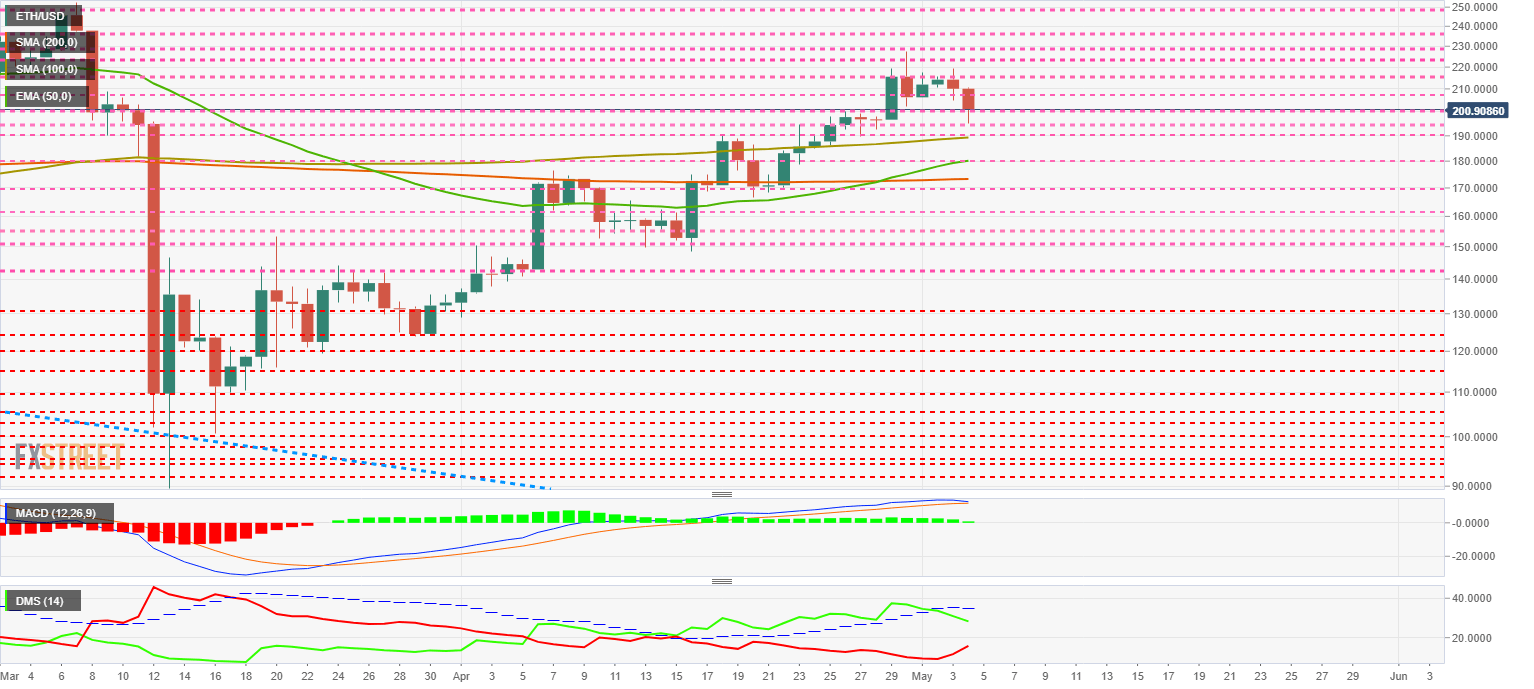
The DMI on the daily chart shows the bears moving very fast upwards, while the bulls are still losing strength after three weeks of leading the ETH/USD pair.
XRP/USD Daily Chart
The XRP/USD pair is currently trading at the price level of $0.212 and sends a message of weakness as it has not been able to break out of the major moving averages. Negative news coming from Ripple Ltd, and almost all of them are related to XRP. The disappointing sales figures for XRP among its corporate customers raise doubts about the potential for implementation and projection of the Ripple Ltd token.
Above the current price, the first resistance level is at $0.217, then the second at $0.227 and the third one at $0.237.
Below the current price, the first support level is at $0.20, then the second at $0.19 and the third one at $0.174
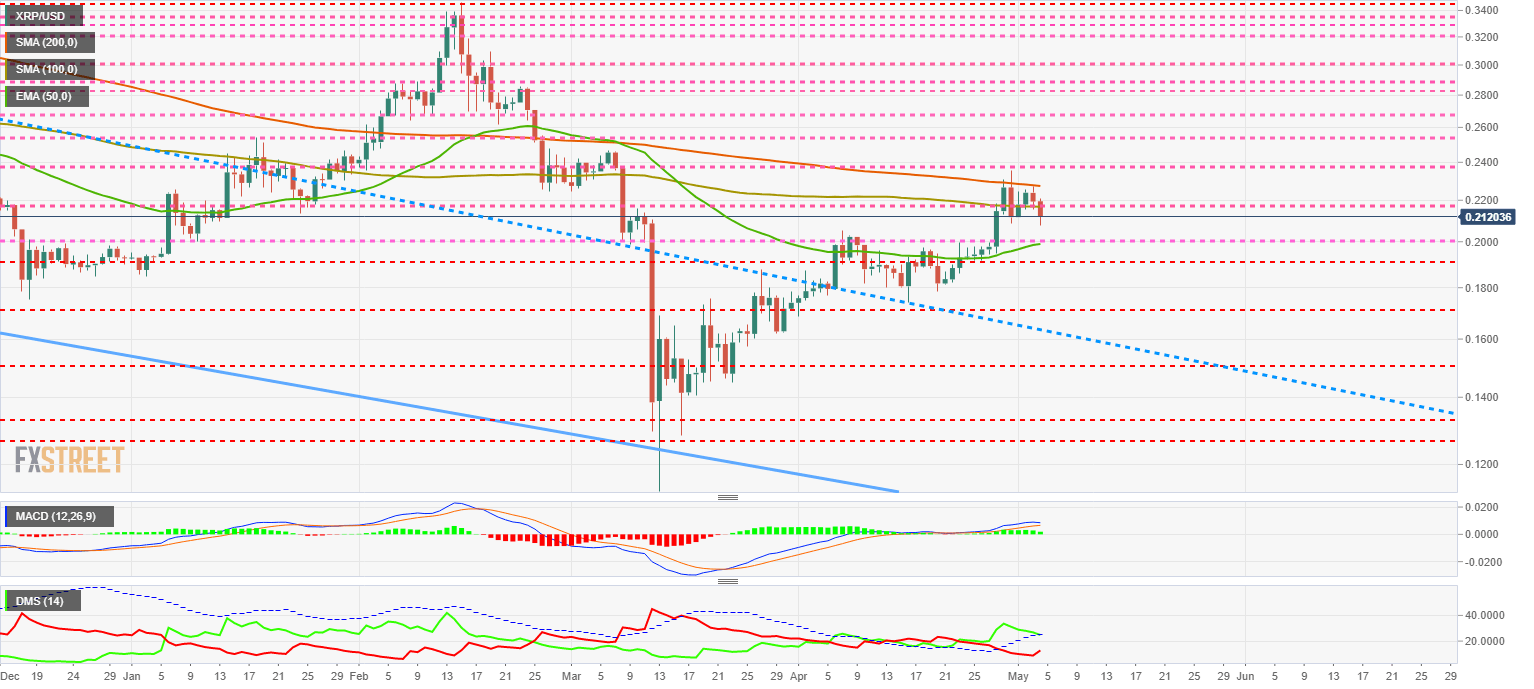
The DMI on the daily chart shows the bulls just above the ADX line and with a good chance of a breakout. The bulls are moving fast upwards and seem convinced that they can contest the control of the XRP/USD pair.
Author

Tomas Salles
FXStreet
Tomàs Sallés was born in Barcelona in 1972, he is a certified technical analyst after having completing specialized courses in Spain and Switzerland. He expanded his technical training following the guidance of great experts on the financial markets.


