Top 3 Price Prediction Bitcoin, Ethereum, Ripple: Cryptos hang by a thread as bulls disappear
- Bitcoin price slowly descends below the 200 three-day SMA, indicating a lack of buying pressure.
- Ethereum price looks ready to breach the support confluence, extending from $2,800 to $3,000.
- Ripple price reenters the buy zone, extending from $0.626 to $0.689, suggesting that there is still hope.

Bitcoin price has slid below a crucial support level slowly indicating that the sellers are overwhelming the buyers into a slow death. Although the last two times BTC tagged this barrier, it resulted in a bullish move, this time around, things are different and could head south. Ethereum, Ripple and altcoins could see a similar bearish fate.
Bitcoin price at wits’ end
Bitcoin price set up an ascending parallel channel on a three-day time frame after connecting the three swing highs and three swing lows since January 13. The last two times BTC dropped lower, it tagged the 200 three-day Simple Moving Average (SMA) and bounced off aggressively.
However, this time, BTC is slowly breaching the said SMA and is heading close to the ascending parallel channel’s lower trend line. Until a breakout from the lower trend line, the setup is bullish and could see Bitcoin price bounce from it.
The resulting upswing could see BTC retest the 50-day and 100-day SMA at $42,074, $41,076. Clearing these hurdles could see the big crypto push toward the yearly open at $46,198 and in some cases, the $50,000 psychological level.
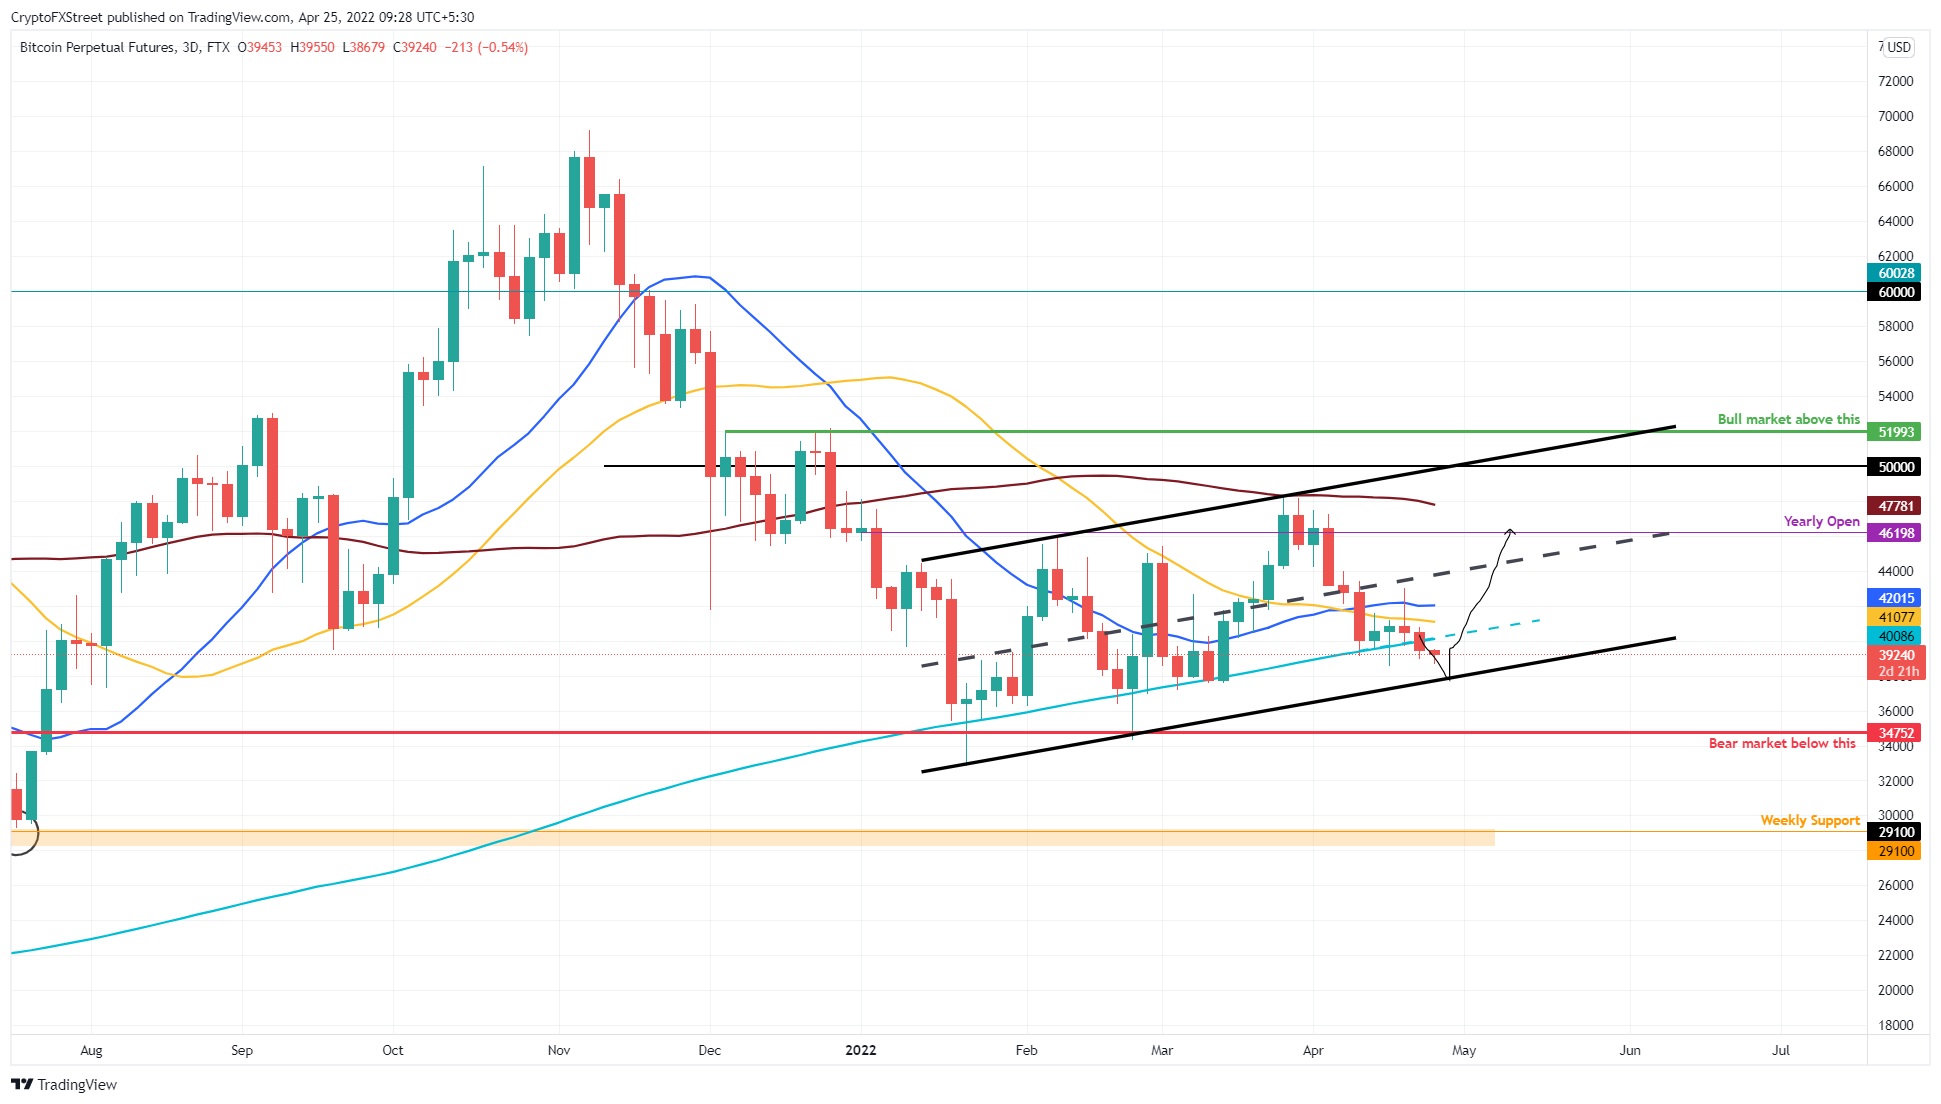
BTC/USDT 3-day chart
A daily candlestick close below the $34,752 support level will invalidate the ascending parallel channel and the bullish thesis.
Ethereum price at make-or-break moment
Ethereum price action seems to be degrading with the recent downswing in Bitcoin price. The bears have pushed ETH lower into the support cluster, extending from $2,800 to $3,000. This footing is significant since it contains a demand zone and a bullish crossover of the 50-day and 100-day Simple Moving Averages (SMAs).
So far, ETH has pierced through both the SMAs and is edging closer to the lower limit of the said demand zone. However, a quick recovery followed by a bounce is likely to result in an upswing for ETH.
The resulting move could cause ETH to retest the 200-day SMA at $3,495 and the low-volume node at $3,703.
Any uptick beyond these levels will require massive bullish momentum spikes and is highly unlikely without the big crypto’s support.
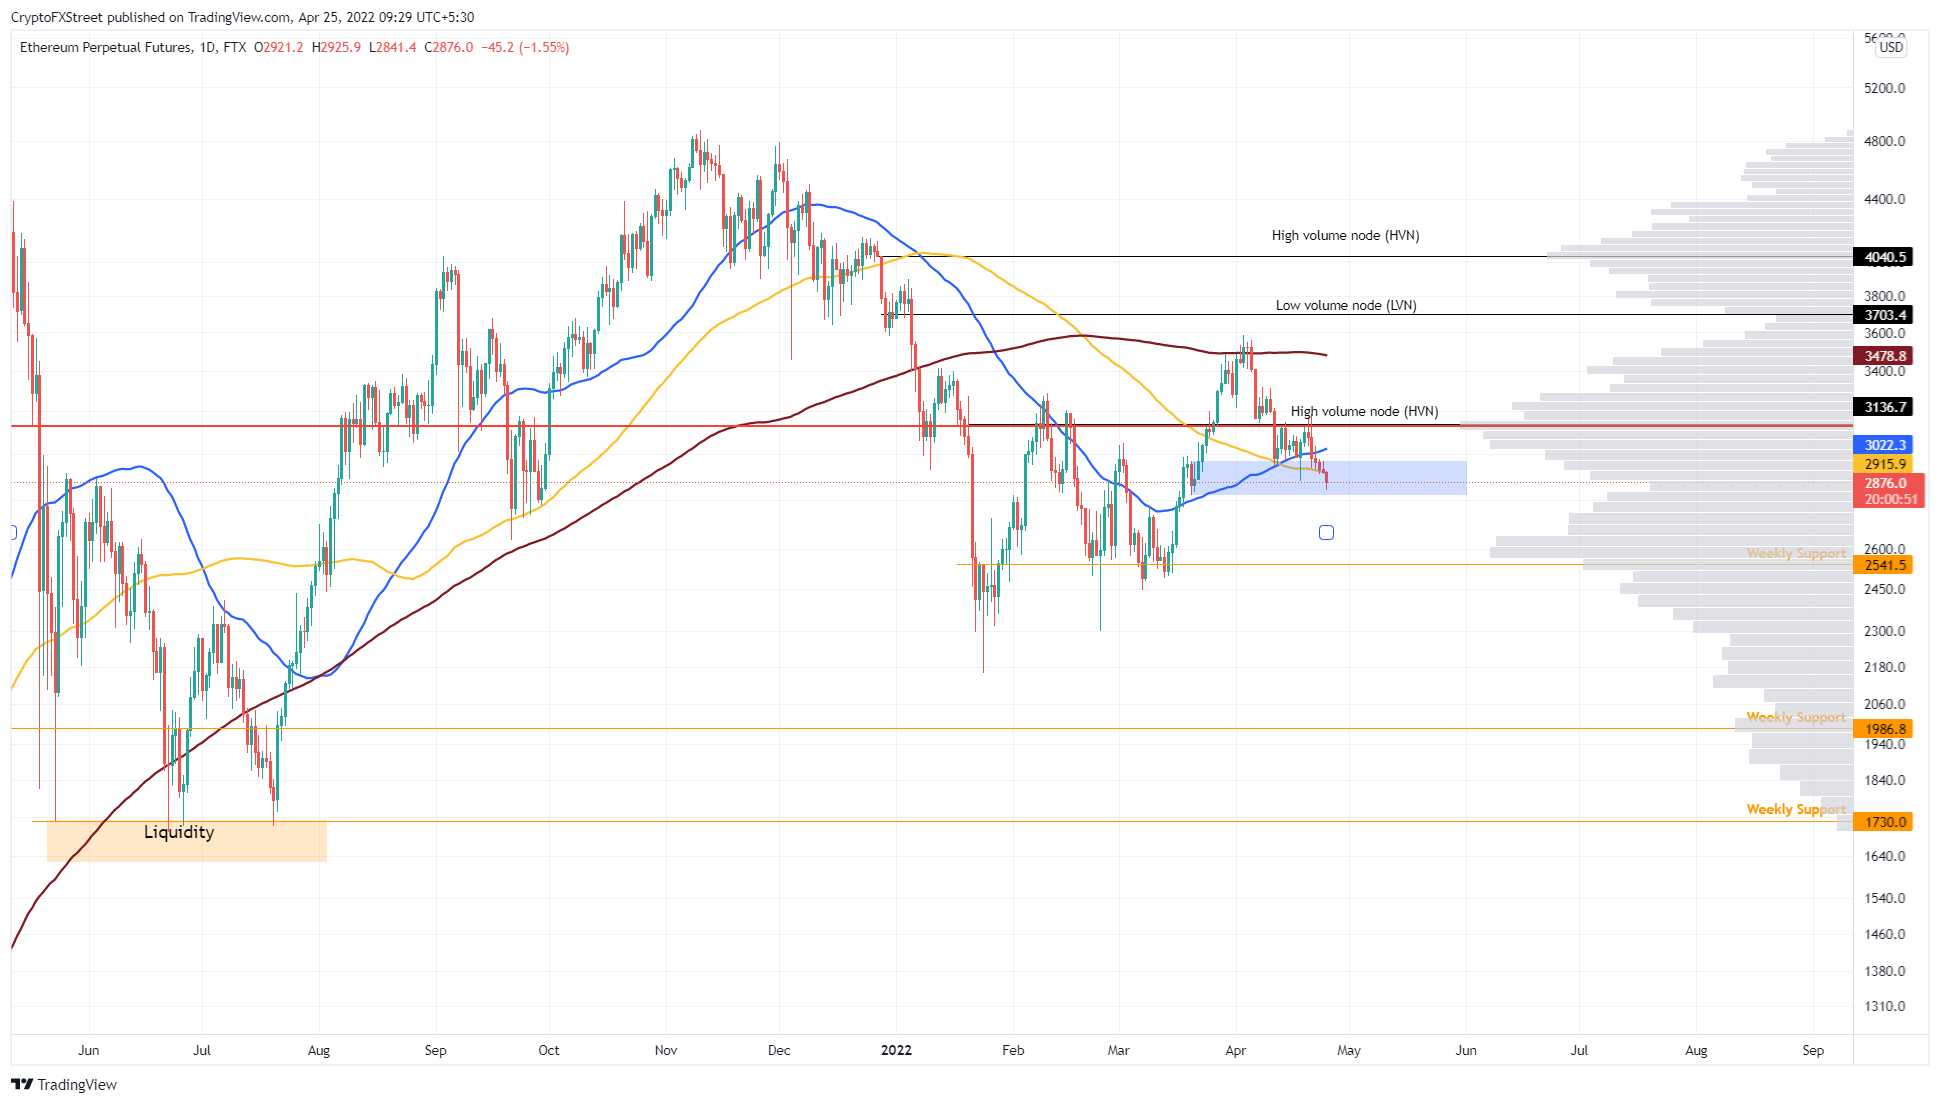
ETH/USD 1-day chart
A daily candlestick close below the support cluster’s lower limit at $2,820 will create a lower low and invalidate the bullish thesis. This development could crash ETH to retest the next high-volume node present to the downside at $2,584.
Ripple price approaches a launching pad
Ripple price has taken another U-turn and reentered the buy zone, extending from $0.62 to $0.68. This move is likely to push XRP price to retest the 70.5% retracement level at $0.657 before triggering an uptrend.
The resulting uptrend could push XRP up by 17% to retest the 2022 volume point of control at $0.772, where the trade volume for Ripple was at its highest. If the remittance token manages to flip this hurdle into a footing, there is a good chance the run-up will continue to and tag the $0.854 hurdle. Failing to do so could result in a local top formation.
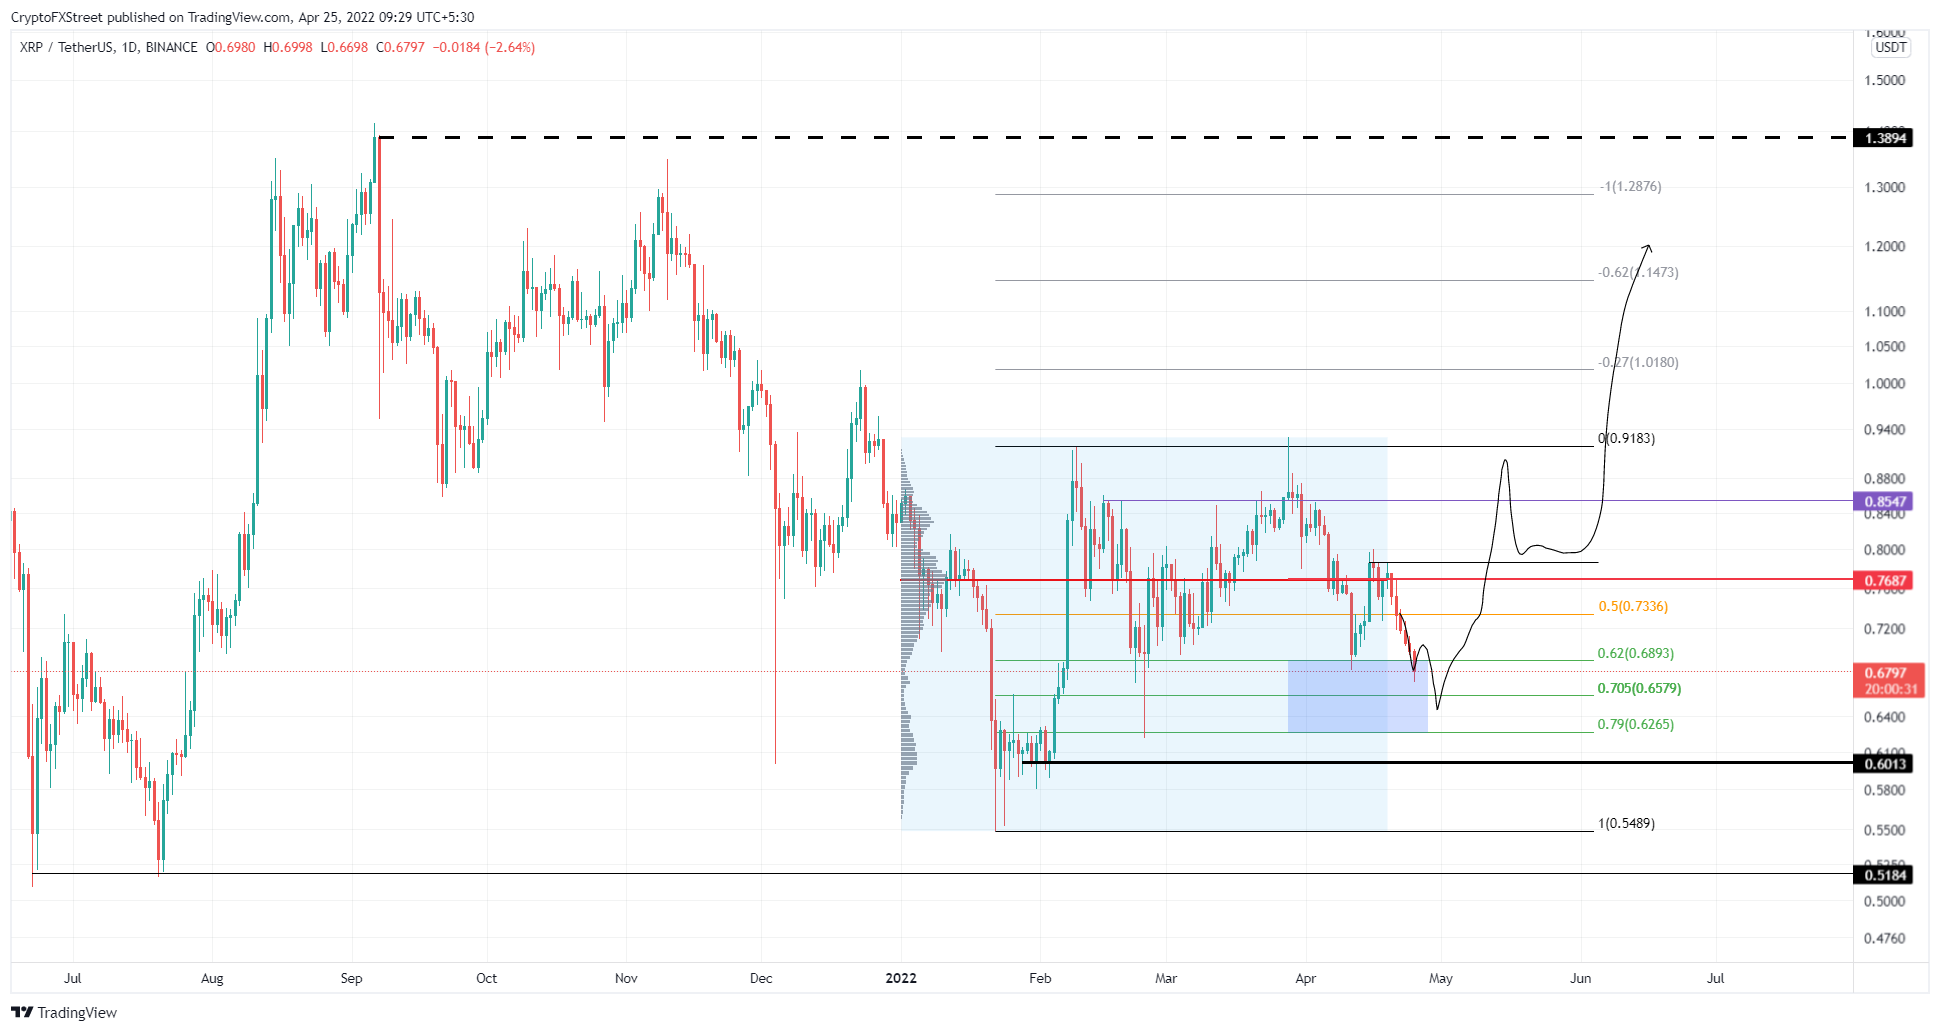
XRP/USD 1-day chart
On the other hand, if the Ripple price breaks below the $0.601 support level and produces a lower low, the bullish thesis will face invalidation. In such a situation, XRP might crash to the $0.548 support level before stabilizing and reestablishing its directional bias.
Author

Akash Girimath
FXStreet
Akash Girimath is a Mechanical Engineer interested in the chaos of the financial markets. Trying to make sense of this convoluted yet fascinating space, he switched his engineering job to become a crypto reporter and analyst.


