Top 3 Price Prediction Bitcoin, Ethereum, Ripple: Cryptocurrency market in bloodbath as OKEx halts operations
- Bitcoin bleeds its way to $11,200 after OKEx announced the suspension of withdrawals.
- Ethereum has quickly resumed the uptrend, keeping the focus back to $400.
- Ripple revisits $0.24 support as hell breaks loose in the cryptocurrency market.

A bearish wave swept through the cryptocurrency market like a tsunami on Friday, leaving most cryptoassets in the red. Bitcoin, as reported, plummeted to $11,200 after losing $300 in a matter of minutes. The unexpected selloff is reflected by the drop in the total market capitalization from $364 billion on Thursday to the current $356 billion. On the other hand, the 24-hour trading volume surged from $78 billion to $85 billion.
Market capitalization chart

OKEx suspends withdrawals shaking the crypto market
As mentioned earlier, the selloff is likely to have been triggered by OKEx decision to suspend withdrawals. According to the exchange company, one of the parties holding its private keys is "cooperating with a public security bureau" in conjunction with continuing "investigations."
The exchange explained that efforts to get in touch with the holding party have been unsuccessful. At the moment, OKEx does not have the "associated authorization" to complete the operations. However, the company assured its users that withdrawals would commence as soon as the holding parity "is able to authorize the transaction."
Bitcoin is not done with the downside
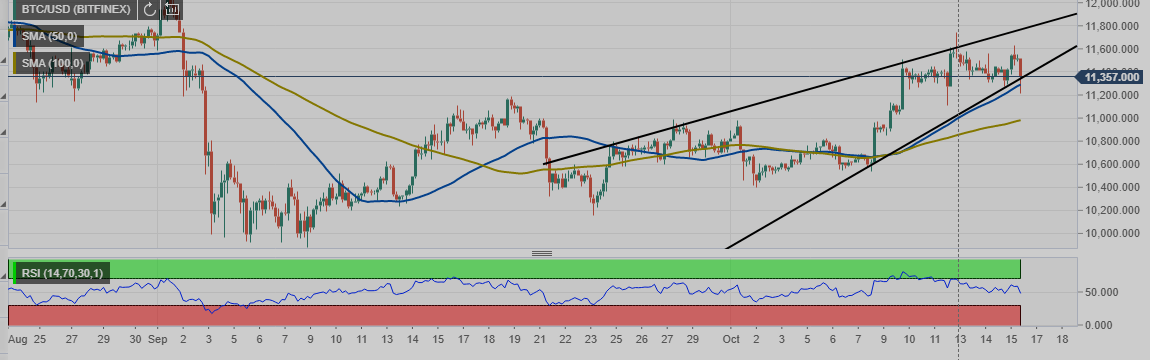
After testing $11,200, the flagship cryptocurrency made a reflex recovery, stepping above $11,300. At the moment, it is exchanging hands at $11,350. The Relative Strength Index (RSI) clarifies that BTC is not down with the downside. Declines to $11,000 could come into the picture in the next session before bitcoin finds the demand for gains towards $12,000.
A rising wedge pattern gives credence to the bearish outlook. Meanwhile, the 50 Simple Moving Average is in line to absorb some of the selling pressure. According to the 4-hour support, $11,000 is the most formidable support area, highlighted by the 200 SMA.
BTC/USD 1-hour chart
IntoTheBlock's IOMAP model reveals challenging resistance ahead of BTC, running from $11,355 to $11,683. Here, approximately 2 million addresses bought almost 1.2 million BTC. If this zone is flipped into support, Bitcoin could start the ultimate rally towards $13,000.
On the downside, Bitcoin has some room before hitting the significant support between $10,678 and $11,007. Here, 1.4 million addresses previously purchased nearly 961,000. Thus, Bitcoin could drop to $11,000 before resuming the uptrend.
Bitcoin IOMAP chart
-637384320870466344.png)
Ethereum's drop to $365 only a temporary setback
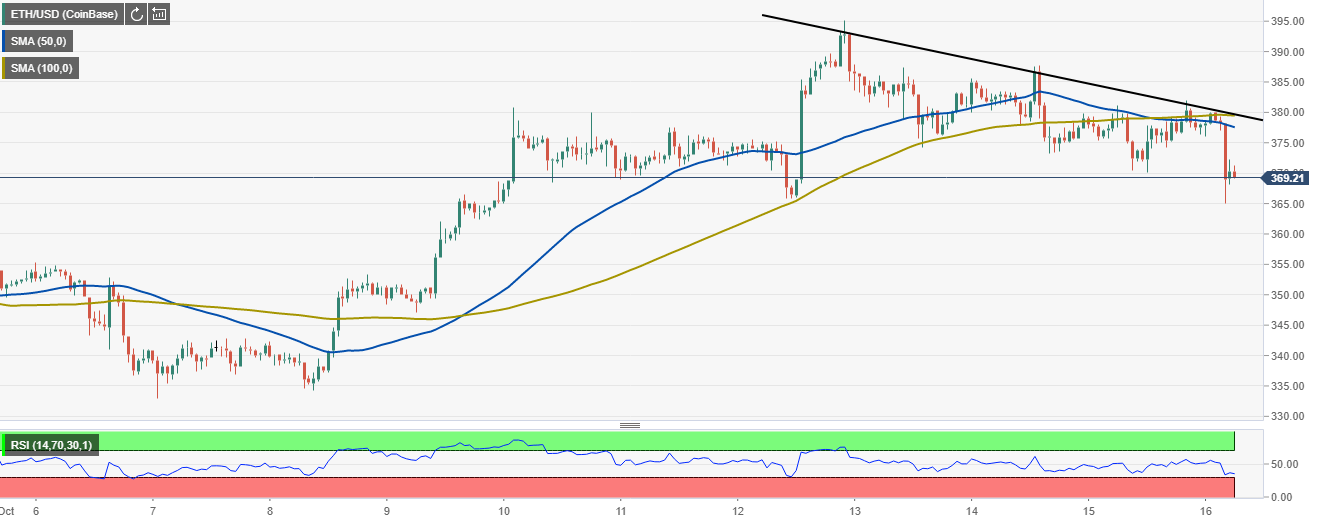
The smart contract token plunged in tandem with Bitcoin, testing support at $365. As discussed yesterday, the spike in Age Consumed preceded the volatility and the price movement. A reversal is underway while Ethereum exchanges hands at $370. This recovery is reflected by the Relative Strength Index (RSI), but resistance is anticipated at $375, the 50 SMA and the 100 SMA.
ETH/USD 1-hour chart
IntoTheBlock's IOMAP model shows that the only critical resistance between $372 and $382. Here, about 1.5 million addresses previously purchased roughly 4.4 million Ethereum. The path after this hurdle is relatively smooth and could allow a breakout to $400.
On the downside, enormous support levels exist to keep Ethereum afloat. For instance, the most robust one runs from $360 to $371. Previously, nearly 650,000 bought approximately 11.5 million ETH. It is doubtful that Ethereum will continue with the downtrend in the near term.
Ethereum IOMAP chart
-637384322027878067.png)
Ripple back to the drawing board
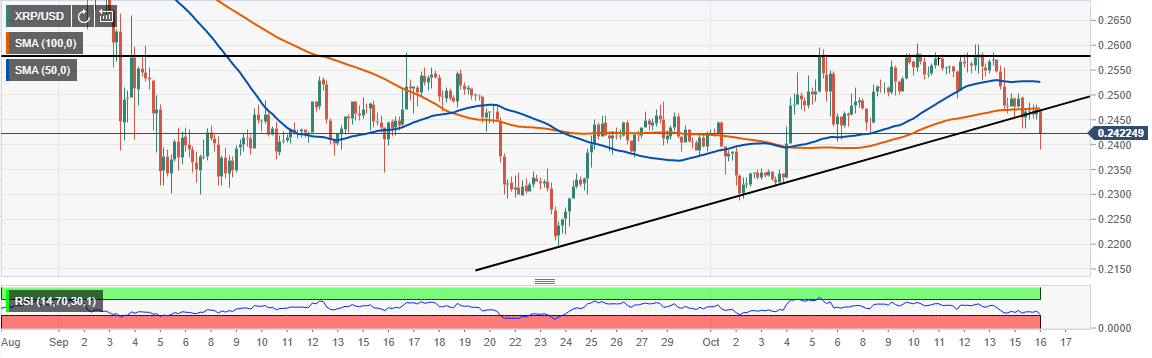
The bearish forces in the market did not spare the cross-border token; hence it extended the declines to $0.24. The bearish outlook confirmed an ascending triangle breakout whose impact is still being felt according to the RSI. If support at $0.24 shatters, XRP might dive to the next critical support at $0.23, while the primary support lies at $0.22.
For now, the path of least resistance is downwards. However, price action above the 100 SMA will see XRP rush towards $0.26. Nonetheless, the 50 SMA will absorb some of the buying pressure, delaying the breakout.
XRP/USD 4-hour chart
According to Santiment, Ripple whales holding between 1 million and 10 million XRP are starting to accumulate. In the last three days, wallets in this range have grown by three to 1,331. The increase may seem insignificant, but the volume moved by these whales is gigantic. A consistent uptrend in the number of whales buying XRP is a bullish indicator in the long run.
Ripple holder distribution chart
 [11.05.20, 16 Oct, 2020]-637384323285586271.png)
Daily takeaway
OKEx suspended withdrawals leading to bleeding in the entire cryptocurrency market. Bitcoin spiraled to $11,200 before making a shallow recovery. Unfortunately, the exchange withdrawal issue still hangs in the balance and could topple BTC towards $11,000.
Ethereum slumped to $365 amid the declines experienced by Bitcoin. The price action also occurred after a spike in the Age Consumed according to data by Santiment. However, ETH has quickly resumed the uptrend and the path to $400 seems easy enough to tackle in the coming sessions.
Ripple was pushed to the support at $0.24. The whales' buying pressure is perhaps the one holding the cross-border token from plunging further in the short term. Losses are anticipated towards $0.23 and $0.22 support levels.
Author

John Isige
FXStreet
John Isige is a seasoned cryptocurrency journalist and markets analyst committed to delivering high-quality, actionable insights tailored to traders, investors, and crypto enthusiasts. He enjoys deep dives into emerging Web3 tren


