Top 3 Price Prediction Bitcoin, Ethereum, Ripple: Crypto recovery rally or exit pump
- Bitcoin price slows down its descent after retesting the parallel channel’s lower trend line.
- Ethereum price reveals an ascending parallel channel after breaching the $3,000 to $2,800 support cluster.
- Ripple price collects liquidity to the south, preparing for a move to $0.733.

Bitcoin price seems like it is stabilizing around a significant support level that has been battle-tested twice over the last three months. A resurgence of buying pressure is likely to propel BTC and all altcoins higher.
Bitcoin price prepares for a run-up
Bitcoin price has been describing an ascending parallel channel for the past three months. This channel is formed when you connect the three higher highs and higher lows using trend lines. The last two times BTC tagged the lower trend line, there was a quick recovery that led to a 40% upswing.
The main characteristic of these lower trend line tags was that the candlesticks closed above the 200 three-day Simple Moving Average (SMA). However, the latest retest pierced through the said SMA slowly, indicating buyers are weakening.
However, as mentioned in the previous article, should a bullish engulfing candlestick form on the three-day chart it would indicate buyers still remain a force. Despite this bullish signal, BTC also needs to break through the 200 three-day SMA and make its way toward the daily supply zone, extending from $42,153 to $43,981.
The upside is likely going to be capped around the aforementioned supply zone, which would indicate a 9% upswing.
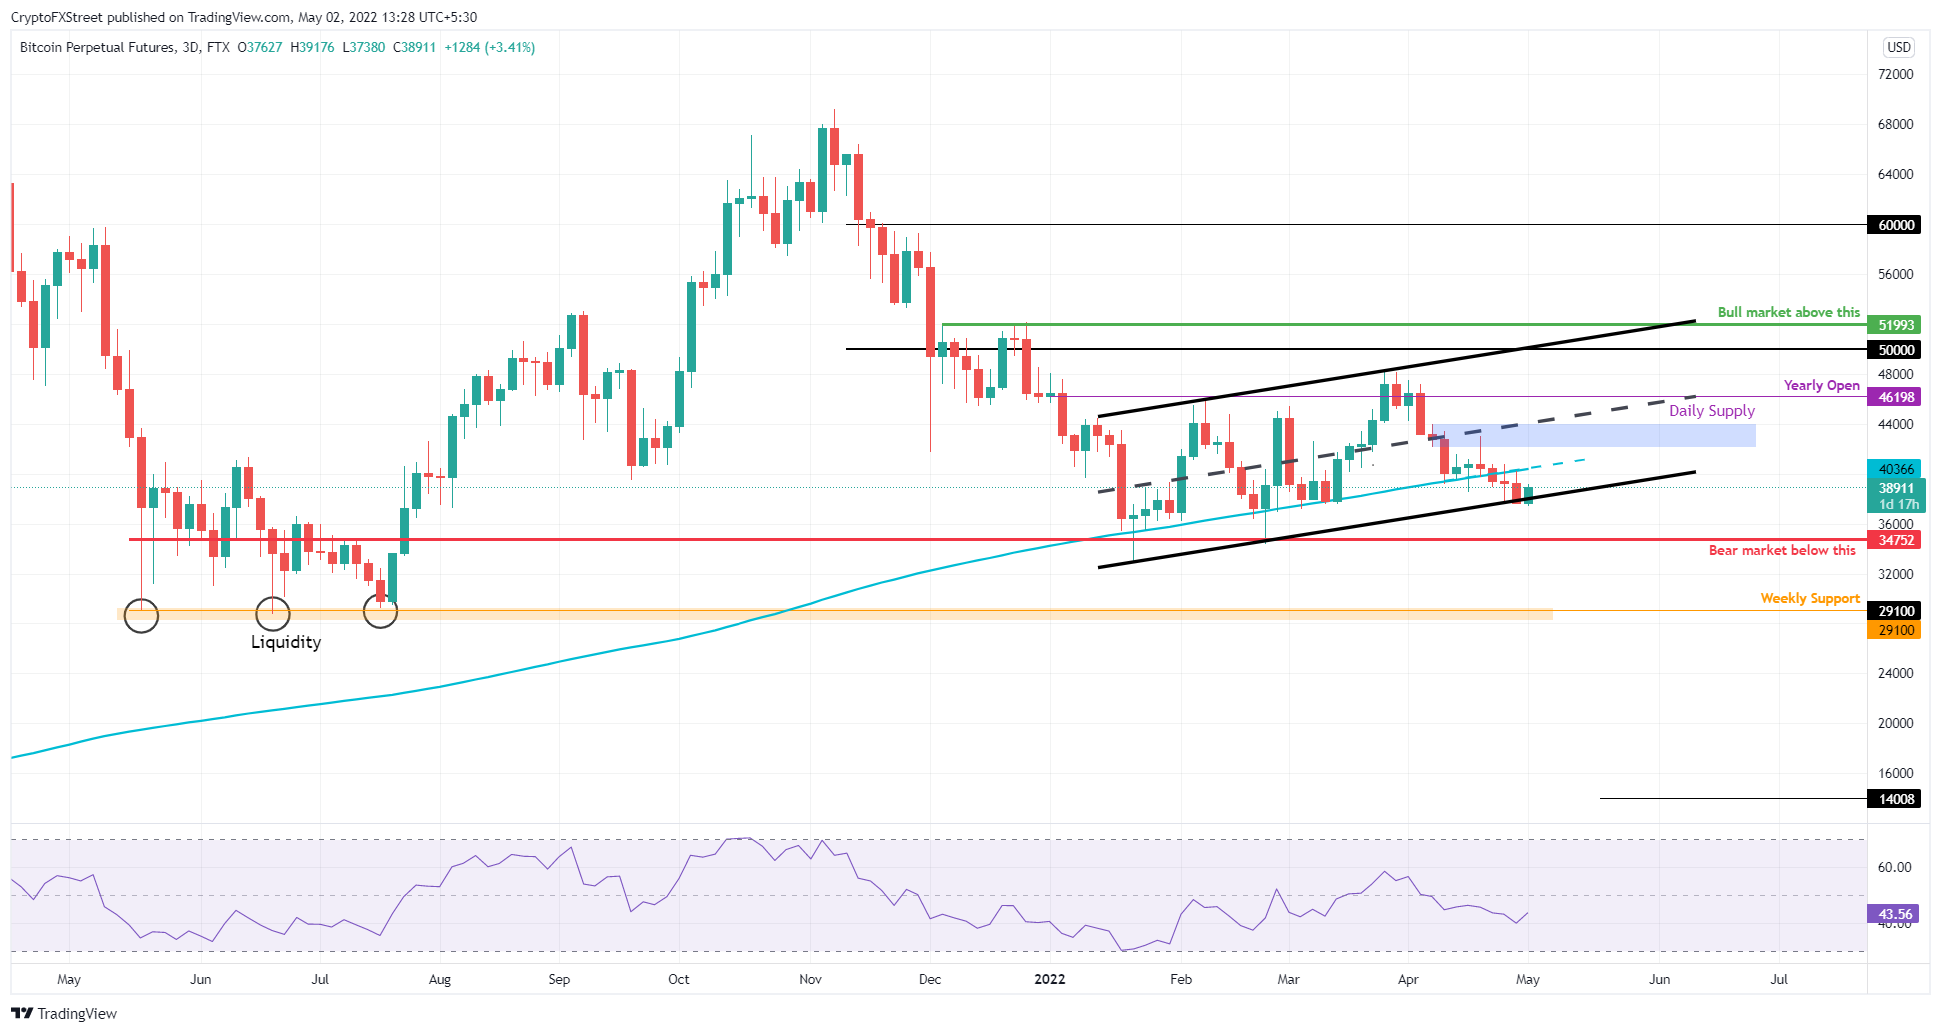
BTC/USDT 3-day chart
While the bullish outlook makes logical sense, a resurgence in selling pressure that produces a daily candlestick close below the $34,752 support level will invalidate the ascending parallel channel and the bullish thesis.
Ethereum price with a new look
Ethereum price breached the long-standing support cluster, extending from $2,800 to $3,000, indicating a short-term spike in selling pressure. While this development might be bearish short-term, drawing a trend line joining the two higher highs and three higher lows reveals an ascending parallel channel.
The latest bounce from the lower trend line is promising, but needs to slice through the 100-day SMA at $2,908 and the 50-day SMA at $3,061 to have any chance of extending. Beyond this, ETH needs to flip the 2022 volume point of control at $3,129 into a support level.
This level is where the most volume for ETH was traded in 2022.
Doing so will be key in triggering a run-up to the 200-day SMA at $3,472, this move would constitute a 21% ascent from the current position - $2,855 and is likely where the upside is capped.
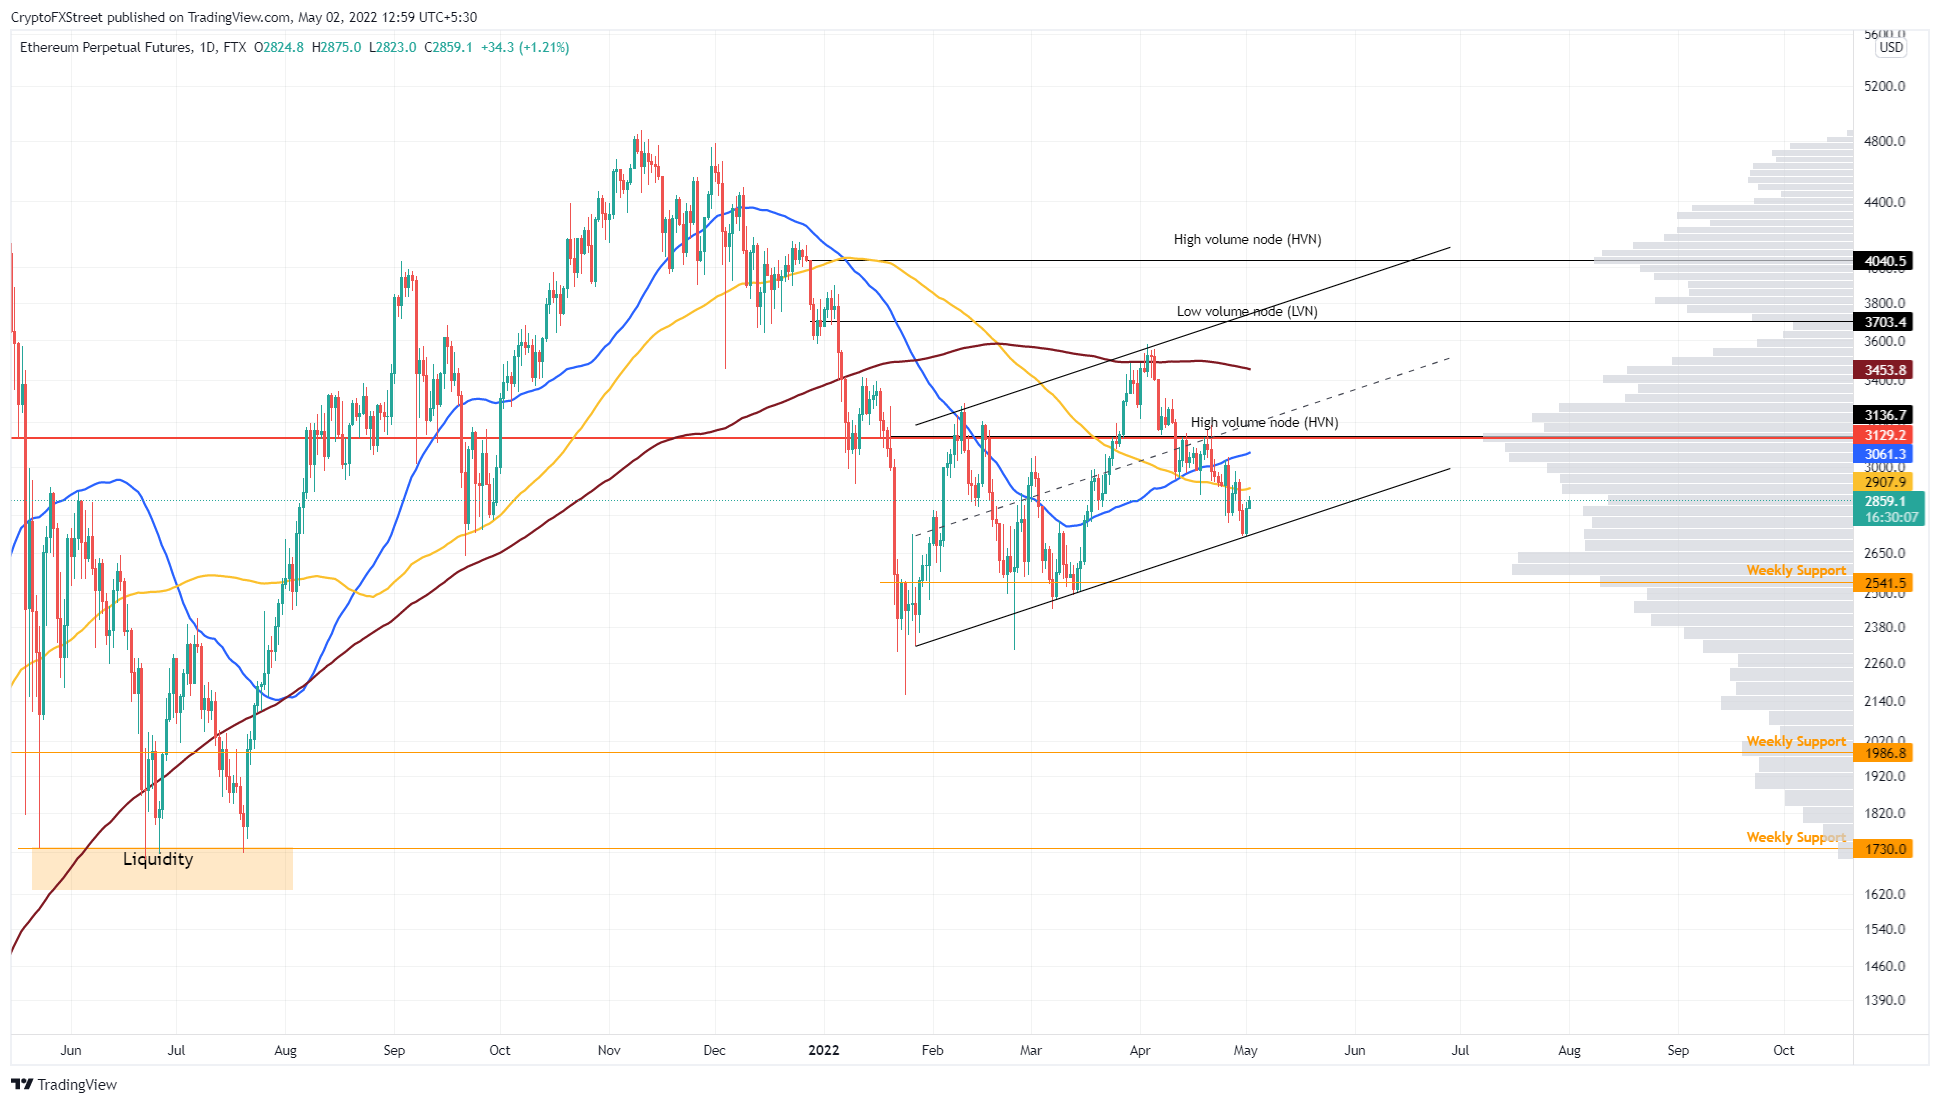
ETH/USD 1-day chart
A surge in bearish momentum that pushes ETH to produce a daily candlestick close below the weekly support level at $2,541 will invalidate the bullish thesis by creating a lower low. This development could further catalyze a nosedive to the $2,000 psychological level.
Ripple price purges sell-side pressure
Ripple price dipped below the support level at $0.601 to collect the sell-stops formed in late January. This move purged the downside pressure, indicating that a reversal is likely in the coming days.
As seen in the chart, the recovery seems to be strong and is targeting a reversion to the mean; in this case, it is the 50% retracement level at $0.733. There is a high chance that this barrier is where Ripple will form a local top.
Adding credence to this thesis is the 2022 volume point of control at $0.768. Therefore, the $0.733 to $0.768 range is where investors should consider booking profits.
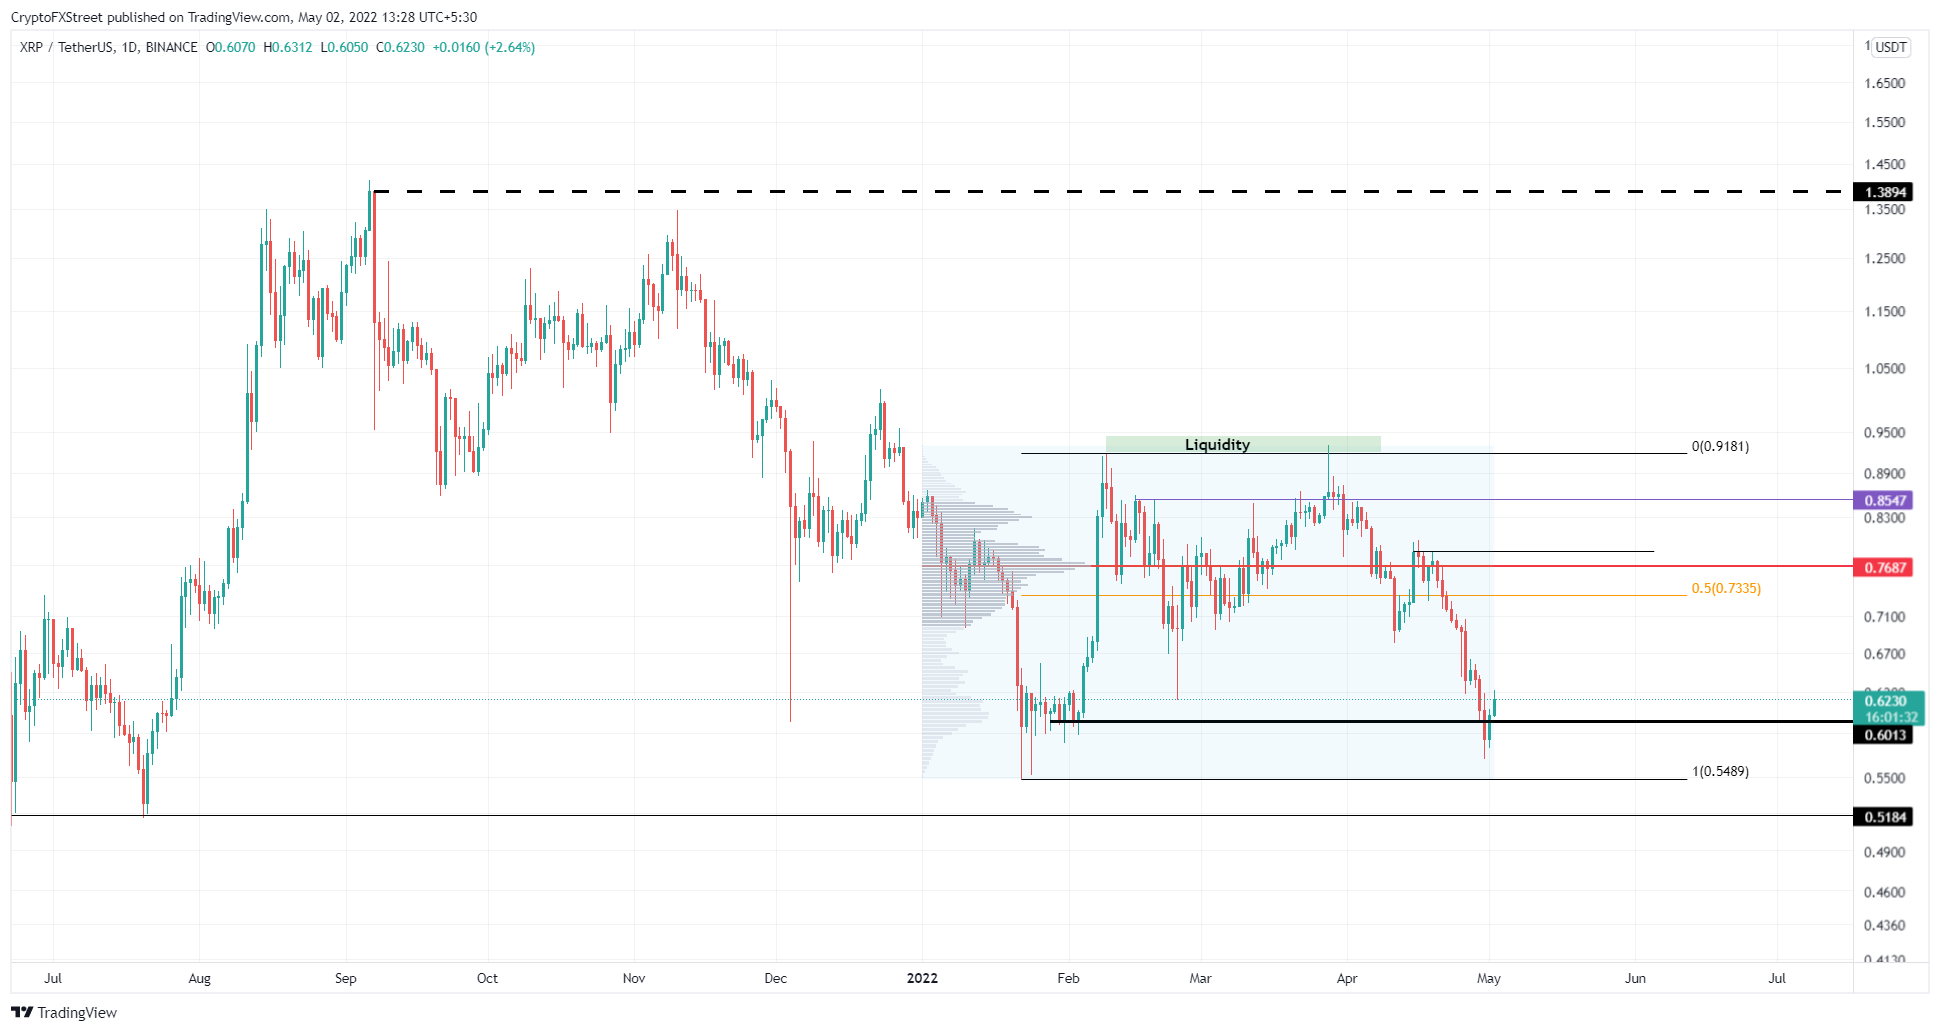
XRP/USD 1-day chart
On the other hand, if Bitcoin price faces a sudden decline,XRP price may also feel the pinch, with a daily candlestick close below the $0.601 support level producing a lower low and invalidating the bullish thesis. In such a situation, XRP might crash to the $0.548 support level and from there try to reevaluate its directional bias.
Author

Akash Girimath
FXStreet
Akash Girimath is a Mechanical Engineer interested in the chaos of the financial markets. Trying to make sense of this convoluted yet fascinating space, he switched his engineering job to become a crypto reporter and analyst.


