Top 3 Price Prediction Bitcoin, Ethereum, Ripple: Crypto markets take off without clear goals
- Bitcoin price shows a healthy bounce off the 79% Fibonacci retracement level at $40,727, suggesting temporary relief.
- Ethereum price creeps back above the $3,000 psychological level as it follows in BTC’s footsteps.
- Ripple price is struggling to flip the $0.964 to $1.01 supply zone into a demand barrier.

Bitcoin price suffered two fatal blows, one on September 7 and another from September 19 to September 21. These two downswings pushed the big crypto down to a critical support floor.
While an impulse move has produced green candles across the board, it is uncertain how long the optimism lasts.
Bitcoin price bounces back
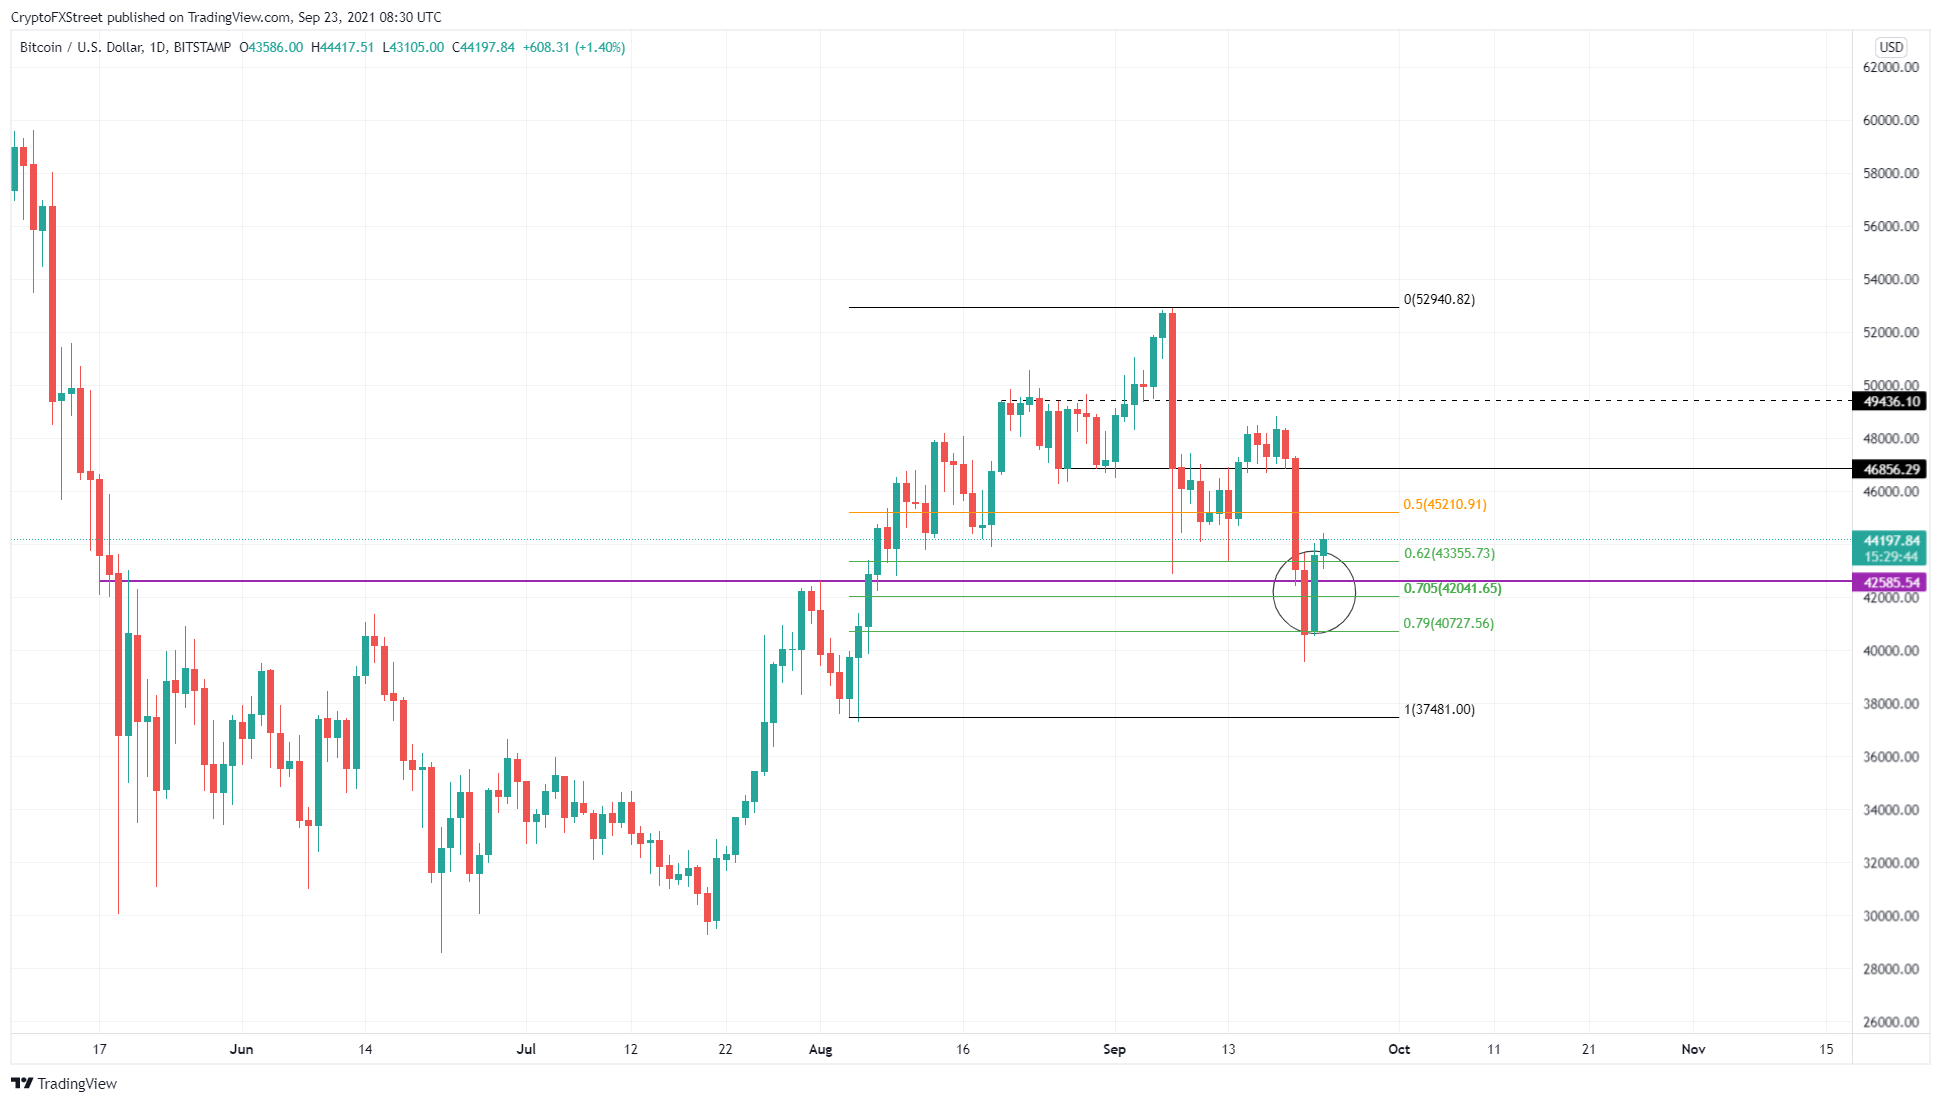
Bitcoin price closed above the 79% Fibonacci retracement level at $40,727 on September 21 and immediately produced a bullish engulfing candlestick the next day. The uptrend continued, yielding a 9% ascent so far.
A retest of the 50% Fibonacci retracement level at $45,210 is likely to occur if the buying pressure persists. Here the bulls might have trouble due to the consolidation witnessed during the second week of September.
However, a successful flip of $46,856 will bring the big crypto close to making a change. If Bitcoin price produces a decisive close above $49,436, it will set up a higher high and mark the start of a new uptrend.
However, as of now, it is unclear if the big crypto has made up its mind to erect a new swing high yet. Moreover, it has set up two lower highs on September 7 and September 18, and this trend might continue moving forward.
Therefore, investors need to pay close attention to the next swing high.
BTC/USDT 1-day chart
On the other hand, if Bitcoin price fails to set up a swing high above $46,856, it could trigger a pullback that could dip deeper and set up a lower low around $37,481, which is the swing point created on August 4.
Ethereum price needs to clear two key barriers
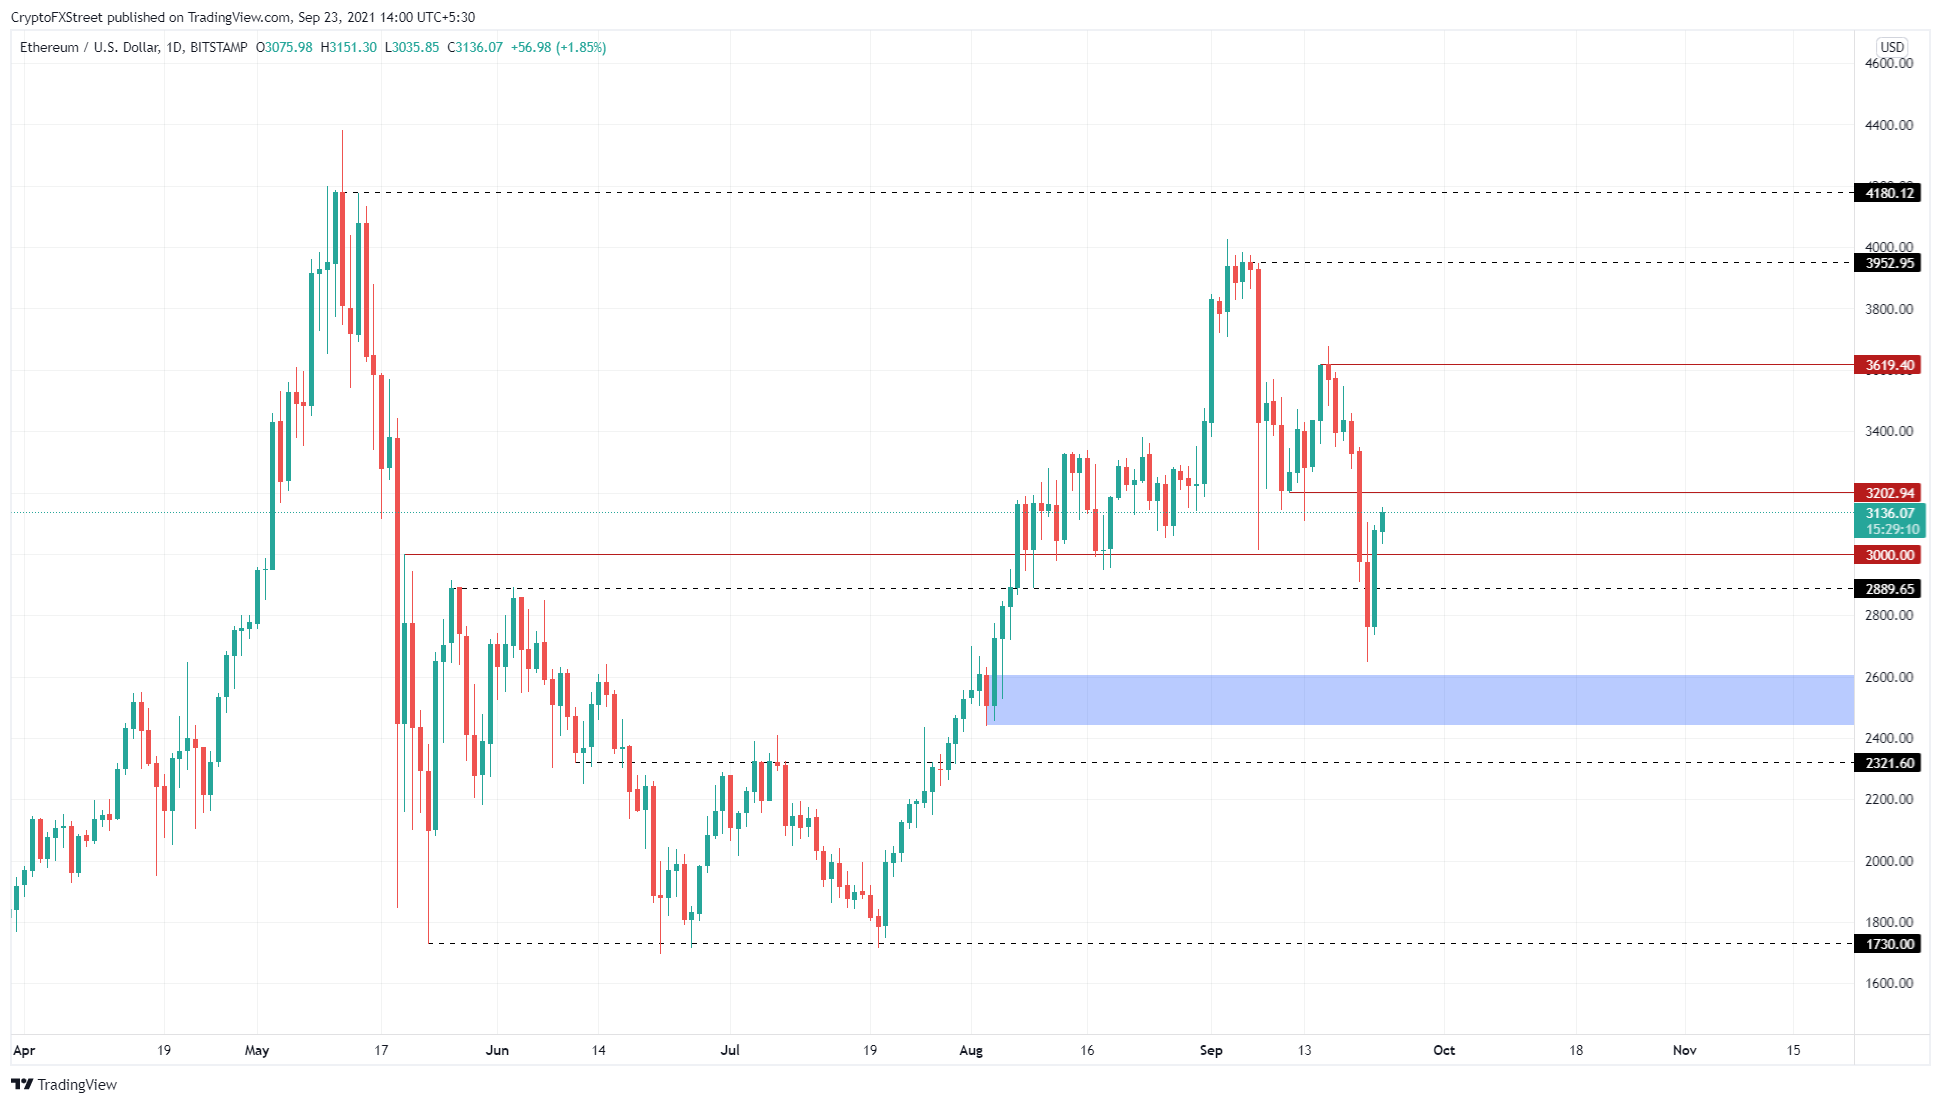
Ethereum price was riding shotgun when BTC tumbled to $40,000. As a result, ETH dropped below $3,000, a key psychological level, and formed a swing low at $2,650. Regardless, Ethereum price has climbed above this barrier and shows a willingness to go higher.
Moreover, ETH needs to slice through the $3,202 resistance level to have a chance at retesting the swing high at $3,619.
If the buyers can push Ethereum price to produce a decisive close above $3,619, it will indicate the start of a new rally. In this situation, the smart contract token could climb to $4,180.
ETH/USDT 1-day chart
While this optimism sounds realistic, it is dependent on the assumption that Bitcoin price continues to go higher or consolidates. However, if BTC makes a U-turn, knocking ETH below $2,889, it will invalidate the bullish thesis and trigger a potential crash to the demand zone ranging from $2,442 to $2,605.
Ripple price to face many hurdles along its journey
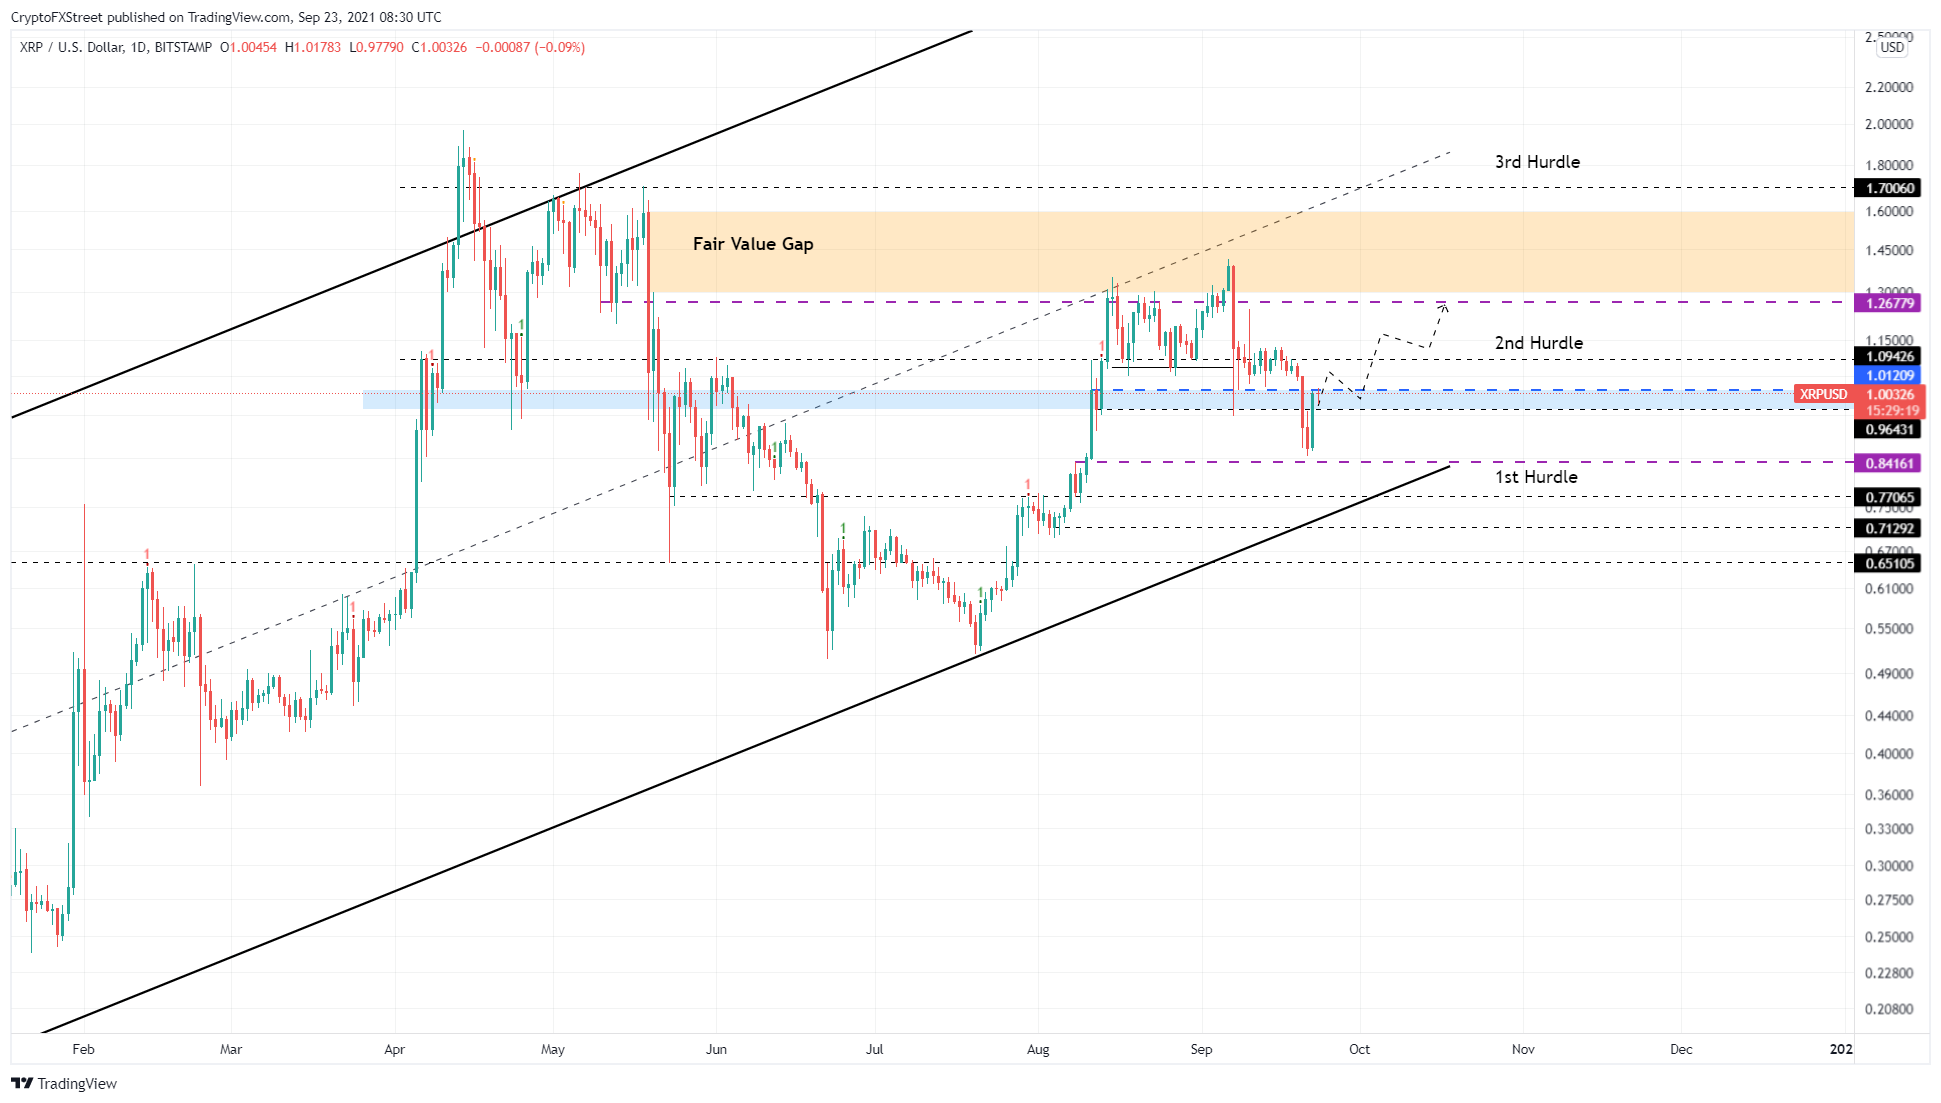
Ripple price continues to struggle as it tries to flip the $0.964 to $1.01 supply zone into a demand barrier, while Bitcoin and Ethereum continue to make headway. A potential spike in buying pressure that pushes XRP price to produce a daily close above $1.01 will indicate the resurgence of buyers.
In such a case, investors can expect a retest of the $1.09 resistance barrier. If the bullish momentum continues to pour in, the remittance token could extend its ascent to $1.26. This move would represent a 25% climb from $1.01.
Interestingly, Ripple price might even make a run at the Fair Value Gap (FVG), ranging from $1.30 to $1.60 if the overall structure of the market remains neutral.
XRP/USDT 1-day chart
As simple as it sounds, the bullish aspect explained above depends on the big crypto’s market structure and the assumption that it does not crash like it did on September 7. However, if BTC fumbles and sells off, the XRP price might slide below $0.964 and head toward the $0.841 support level.
A breakdown of this barrier will invalidate the bullish thesis and further trigger a descent.
Author

Akash Girimath
FXStreet
Akash Girimath is a Mechanical Engineer interested in the chaos of the financial markets. Trying to make sense of this convoluted yet fascinating space, he switched his engineering job to become a crypto reporter and analyst.



