Top 3 Price Prediction Bitcoin, Ethereum, Ripple: Crypto markets bleed as bears take control
- Bitcoin price has breached a significant support level at $34,752 on the weekly time frame, hinting at a descent.
- Ethereum price followed BTC’s lead and crashed below the $2,541 foothold.
- Ripple price has also flipped below a stable floor but technicals are still reflecting a bullish possibility.

Bitcoin price is in a fragile state after a breakdown of a critical support barrier. Ethereum, Ripple and many altcoins have already crashed a lot and could continue doing so if BTC does not recover quickly.
Bitcoin price at serious levels
Bitcoin price has signaled a bearish breakout from the bear flag pattern that it has formed over the past five months or so. The 52% crash from an all-time high at $69,000 is known as the flagpole. This downswing was followed by a consolidation in the form of higher highs and higher lows, which formed the flag.
In summary, this bearish continuation pattern forecasts a 52% downswing, determined by adding the flagpole’s height to the breakout point at $38,305. So far, BTC has crashed 13% from this point and has also produced a weekly candlestick close below the $34,752 support level.
A failure to recover above this foothold will likely lead to a crash to $30,000. In a dire case, BTC could nosedive to $18,179, which is the bear flag’s forecasted target for Bitcoin price.
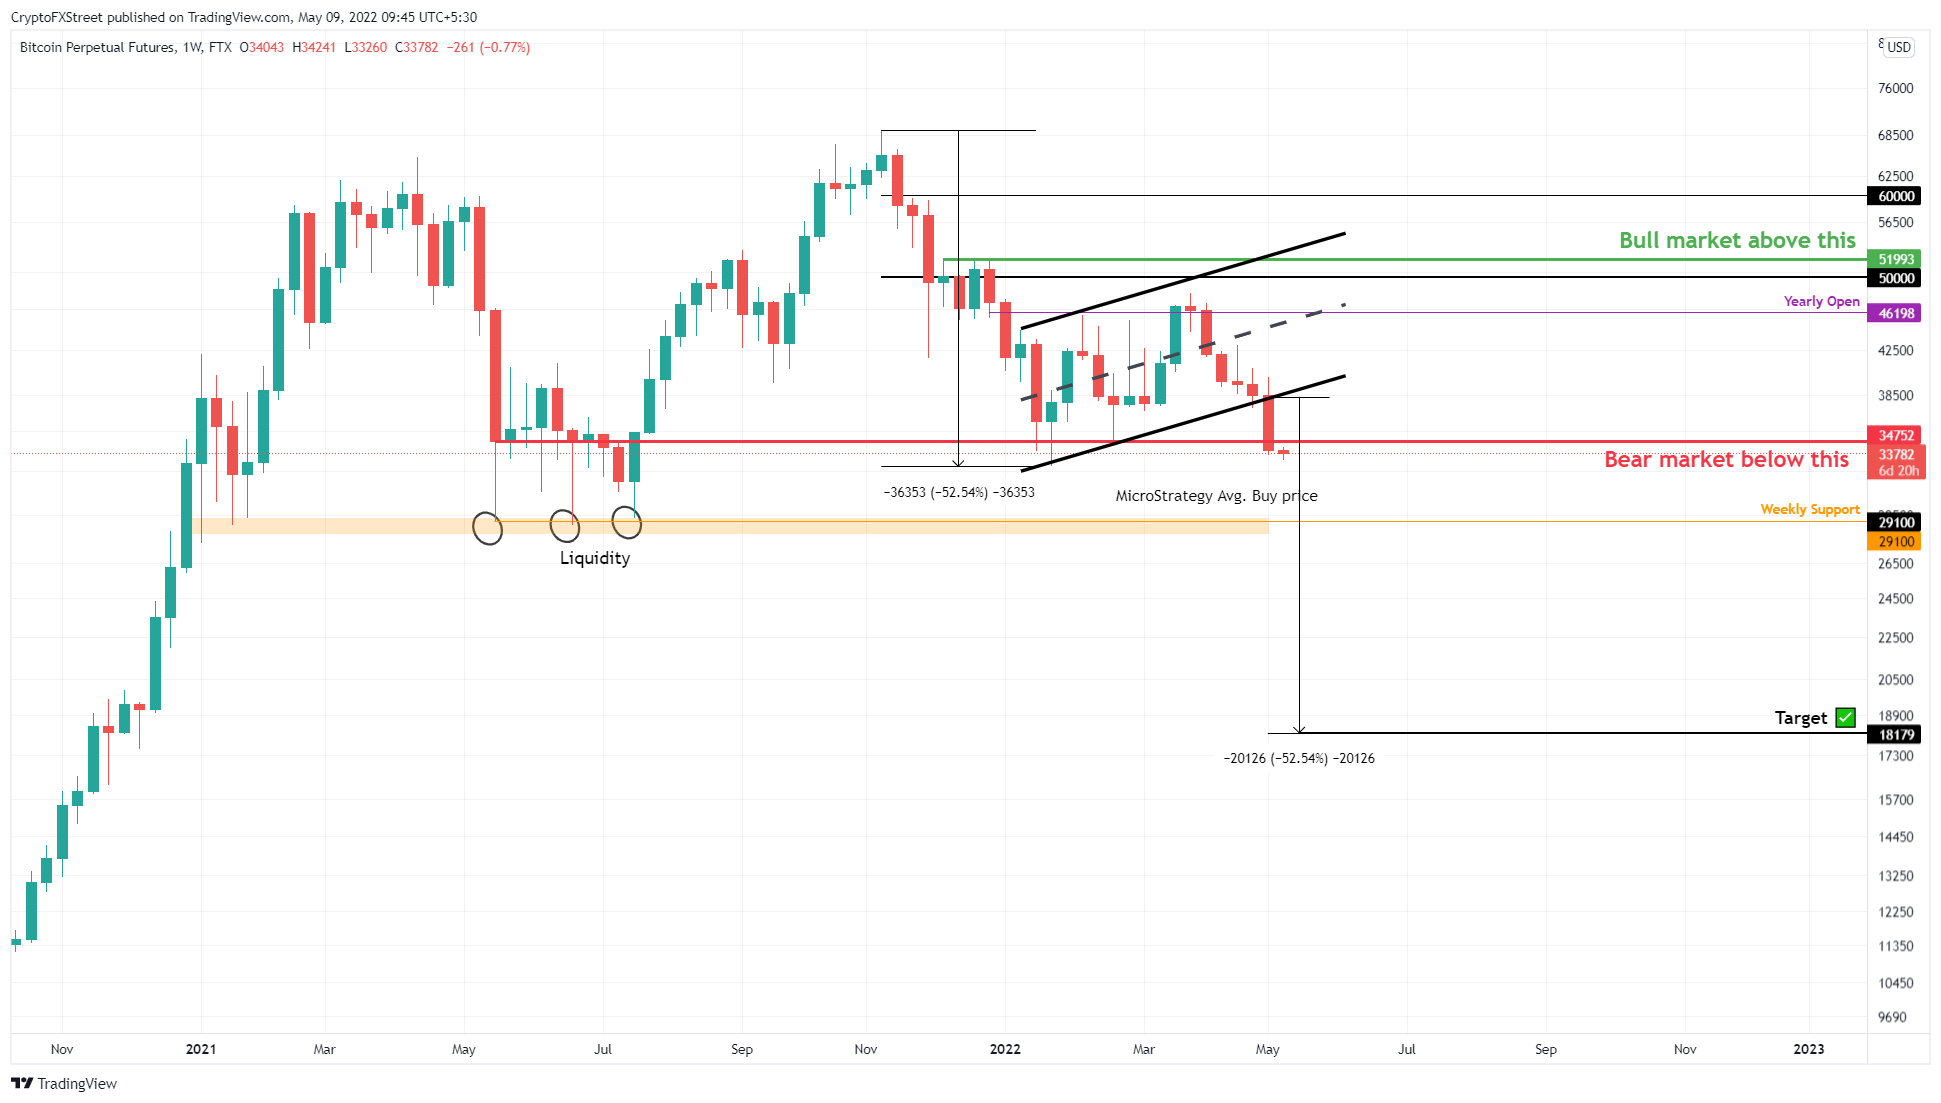
BTC/USD 1-week chart
While things are looking grim for Bitcoin price, a quick recovery above $34,752 could alleviate the bearish pressure. This development could propel BTC to $36,251, where bulls could fight for establishing a different directional bias.
Ethereum price crumbles
Ethereum price created an ascending parallel channel after three higher lows and two higher highs since January 25. While the consolidation was promising, ETH breached the channel on May 4, signaling that the sellers are dominating.
Additionally, Ethereum price also sliced through the $2,541 support level, indicating that a sell-off is imminent. Considering the bearish outlook in Bitcoin price, there is a good chance this outlook might arrive soon.
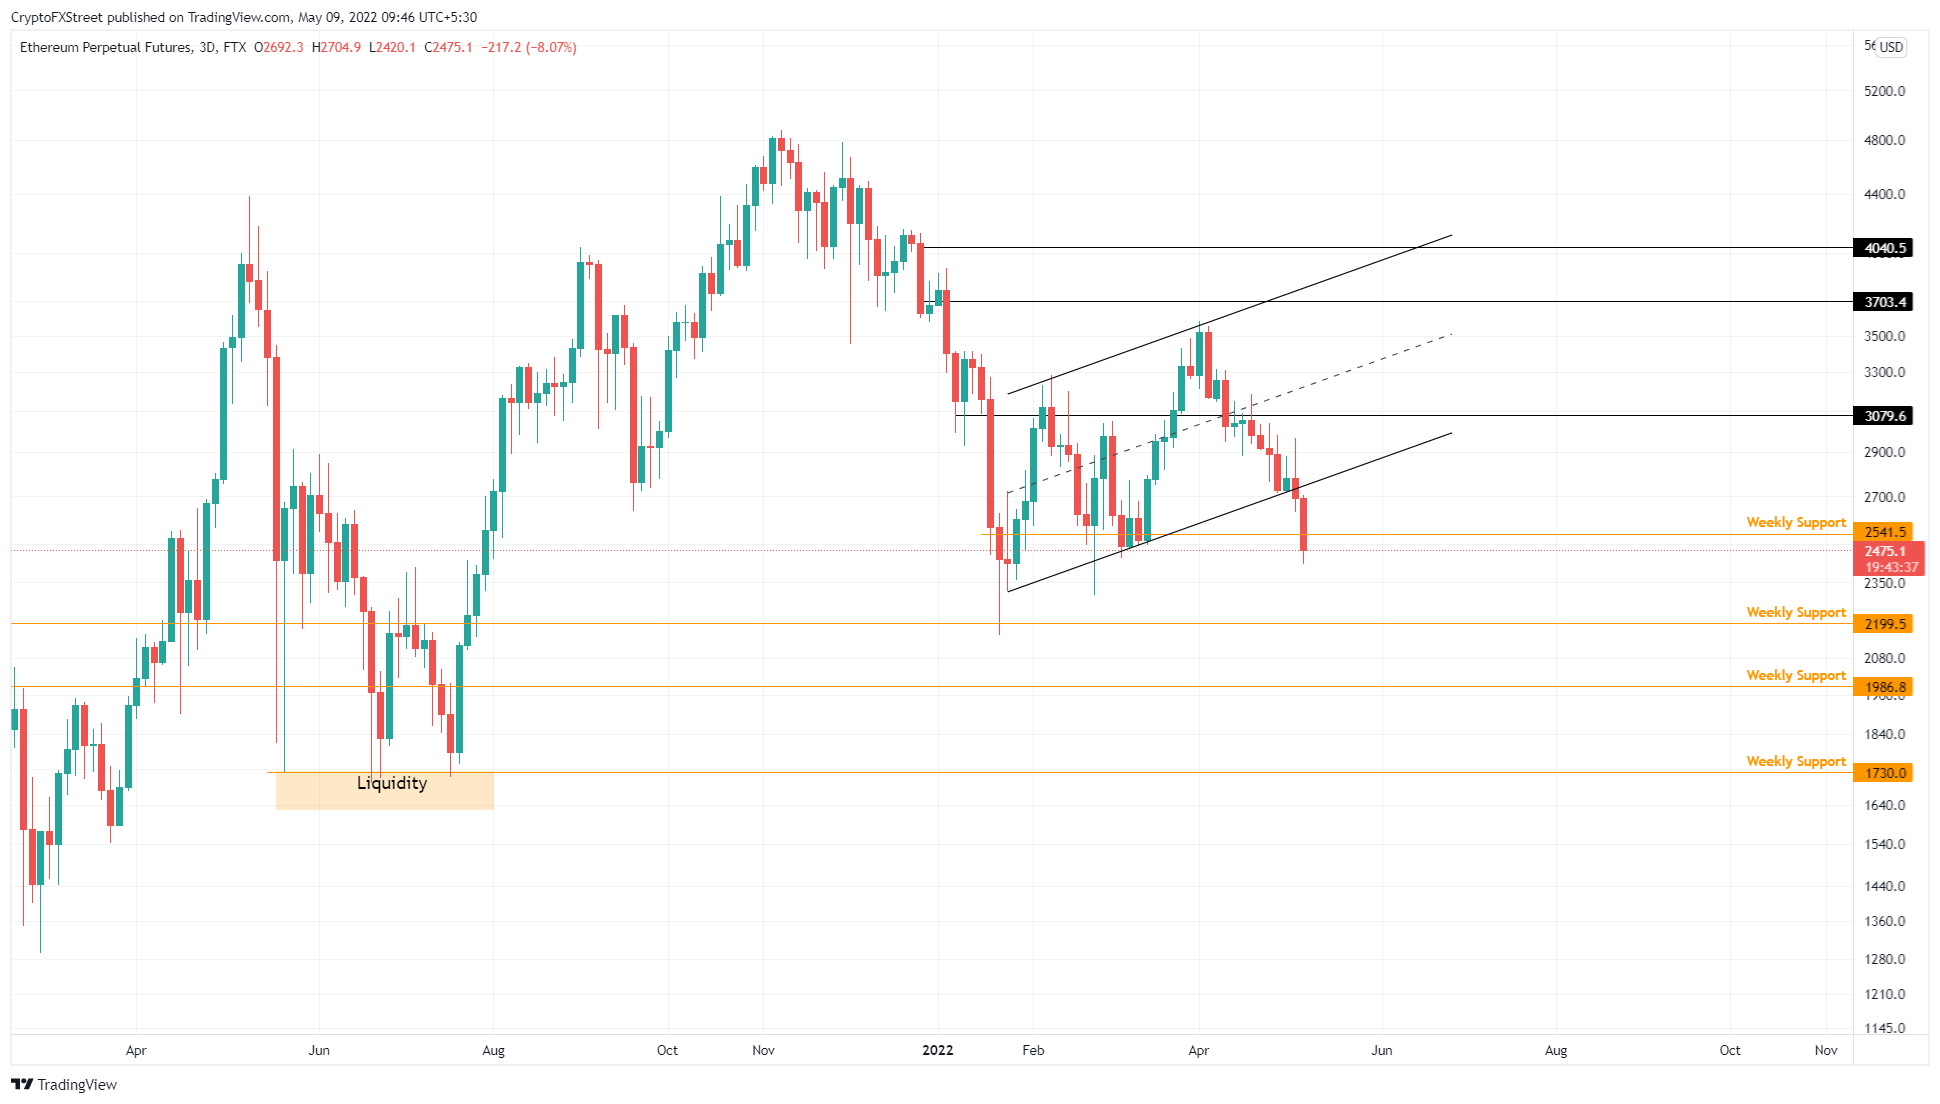
ETH/USD 3-day chart
Regardless of the bearish outlook, if Ethereum price recovers above the $2,541 barrier, the downswing could be postponed. On the other hand, a three-day candlestick close above $3,703 will create a higher high and invalidate the bearish thesis.
Ripple price remains optimistic
XRP price is traversing a W-bottom reversal pattern. This setup has been forming since November 2021 and contains a long downswing followed by two retests of a support level. For XRP, the stabilization is happening at around $0.582.
While the recent bearishness has caused the remittance token to breach it, the bullish divergence seems to be unaffected. This technical setup is formed when the asset produces a lower low and the momentum indicator, aka Relative Strength Index (RSI), forms higher lows.
The result of such a pattern is a spike in the asset’s market value. Therefore, investors can expect the second retest to be followed by an impulsive move to the starting point, in this case $1.35. However, the upswing will face a resistance between $0.917 and $0.998.
Clearing these hurdles would propel XRP price to $1.35, which would be a 120% ascent from the current position at $0.556.
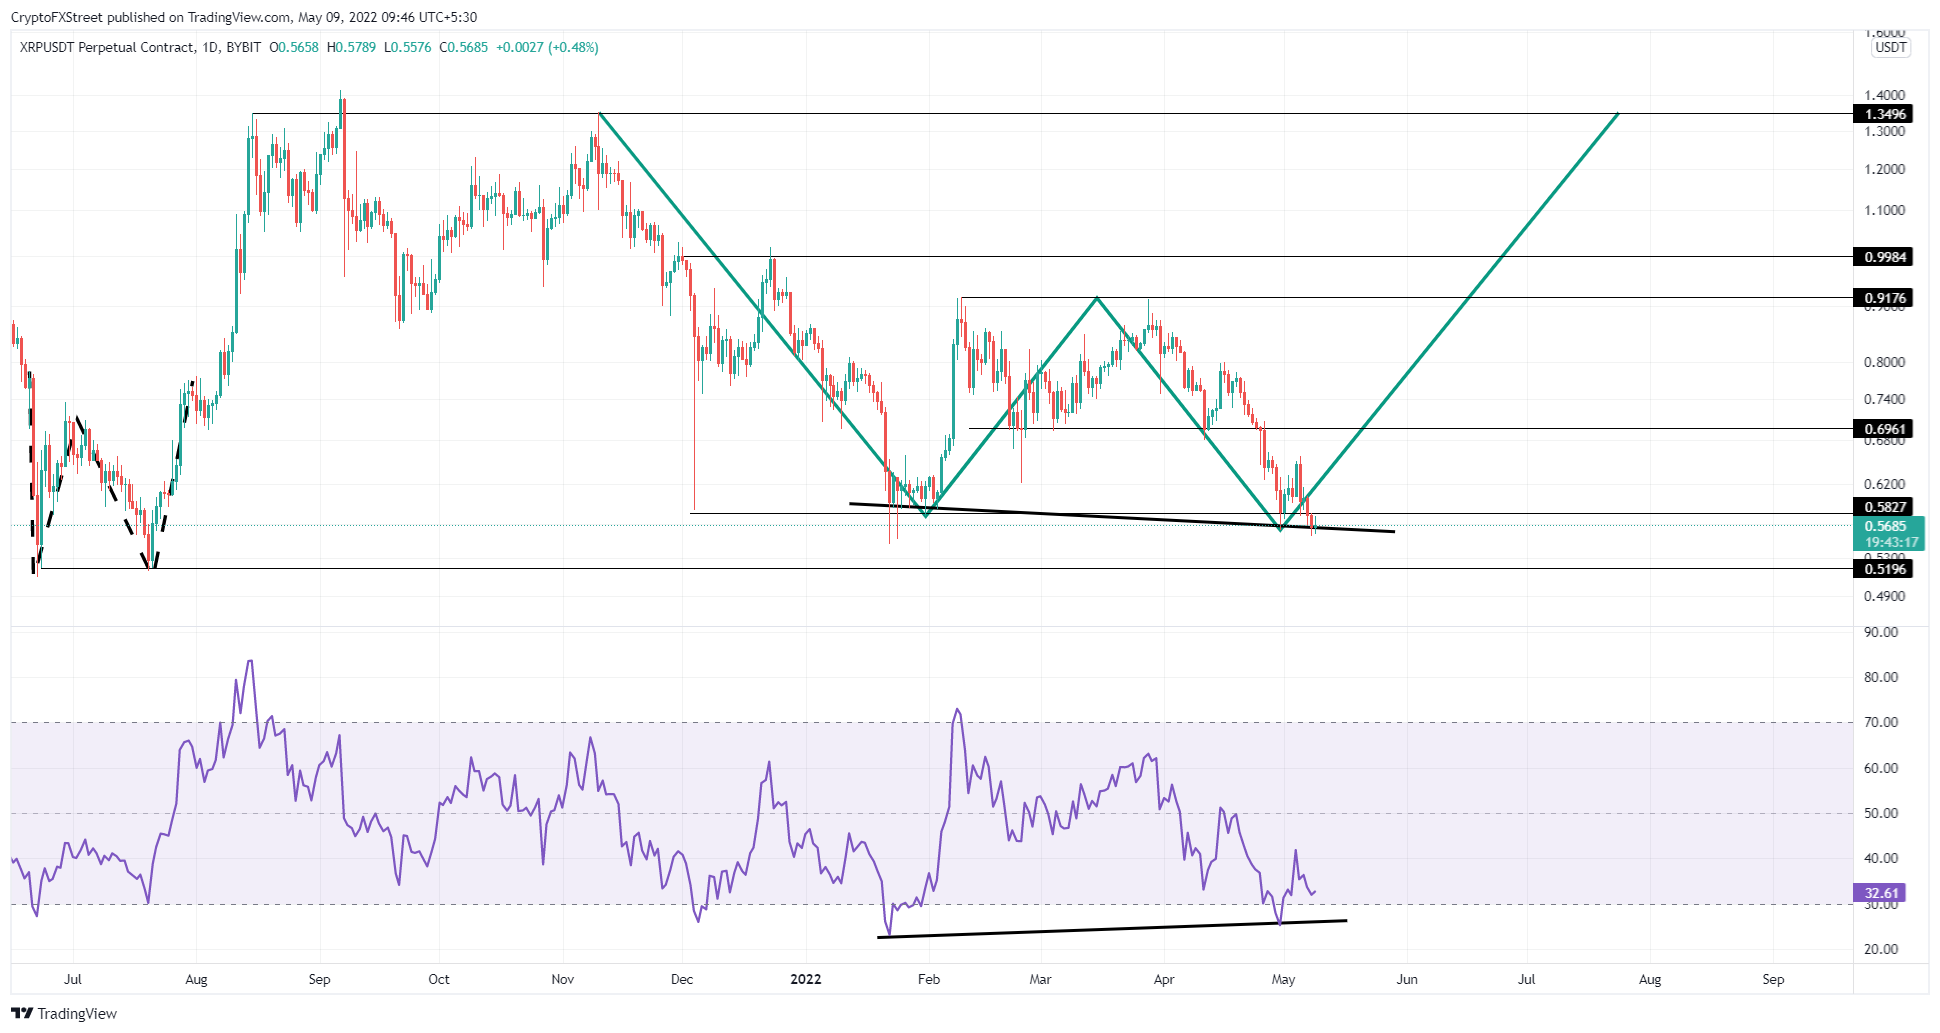
XRP/USDT 1-day chart
On the other hand, if XRP price produces a daily candlestick close below $0.519, it will create a lower low and invalidate the bullish thesis for Ripple.
Author

Akash Girimath
FXStreet
Akash Girimath is a Mechanical Engineer interested in the chaos of the financial markets. Trying to make sense of this convoluted yet fascinating space, he switched his engineering job to become a crypto reporter and analyst.


