TOP 3 price prediction Bitcoin, Ethereum, Ripple: BTC/USD finds time and takes advantage in the “Escape Room” game
- BTC/USD overcomes key resistance and trades at $6,920.
- ETH/USD follows Bitcoin but is not as successful, trading at $285.
- XRP/USD waiting to breach the price level of $0.368.

New climbing day on the Crypto board. Early in the Asian session, BTC/USD moved rapidly upwards, crossing key levels and impacting the SMA200 on the 240-minutes chart. It is premature to take this move for granted, as in the very short term the indicators are quite deviated and a correction seems very likely. When the Bitcoin price consolidates, it will deliver the real confirmation.
Both ETH/USD and XRP/USD are following the general trend of the Crypto market and are also moving higher. In this case, it seems necessary to continue the upward movement in order to reach confirmation levels.
BTC/USD 240-Min
BTC/USD is currently trading at the price level of $6,921. In my morning article yesterday, I mentioned that this area could be complicated to surpass, because of the proximity of two important resistances: the trend line conquered at first light and the SMA200.
It is in this scenario that Bitcoin now finds itself, barely breaching the moving average of 200 periods. Due to the proximity of the gained bullish trend line, any setback from a certain entity could send the price back below it, undoing the bullish signal.
So, good news for the bulls, but don't celebrate prematurely, because it's really too early for that.
Above the current price, the first need for the bulls would be to clearly breach the SMA200 and, if possible, overcome the price congestion resistance at the $7,100 price level. It would also be useful for them if they manage to break the psychological level of $7,000, but would not be as optimal.
Above this level, multiple resistances for Bitcoin. The next levels to overcome are the resistance at $7,100 (SMA200), followed by the price level of $7,400 (price congestion), $7,600 (price congestion) and $7,720 (price congestion).
More important today are the support levels, as a close below the key price level of $6,850 would undo all what the BTC/USD has achieved, returning it to the previous scenario. This is the first and most important support, but the following should be taken into account in case of discouraged sales. Next support level in the price level of $6,760 (price congestion), $6,638 (SMA100), $6,560 (price congestion) and $6,477 (EMA50)
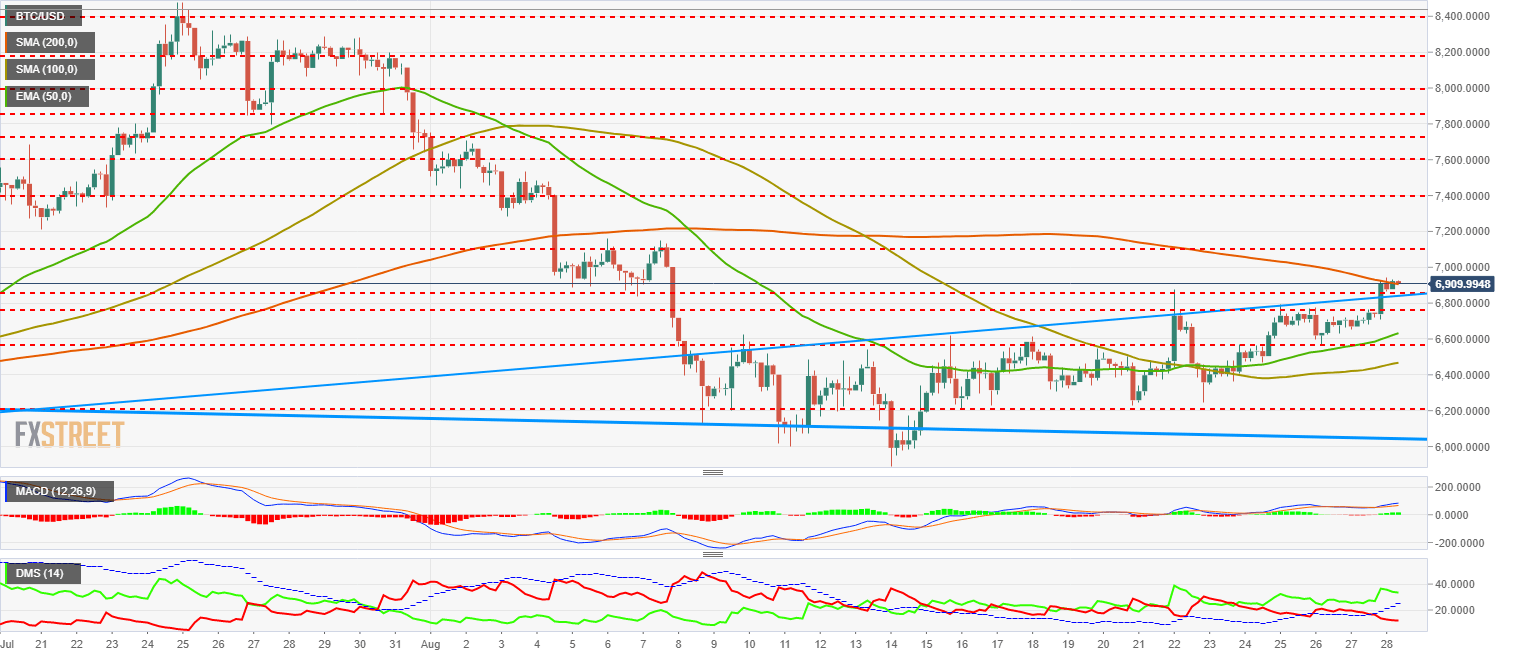
The MACD at 240-Min has managed to open up a little space between the lines but without too much inclination. Both a downward cross and a bullish development, with greater opening between lines and an increase in inclination, are possible.
The DMI at 240 Min is clearly set upward. Buyers increase their strength as sellers sink and fall below an ADX line that has reacted quickly to Bitcoin's bullish push.
ETH/USD 240-Min
ETH/USD is currently trading at the $285 price level after following Bitcoin in its bullish move, but has not breached the $288 price level (SMA100) and therefore, a possible change of scenario remains in quarantine for now.
Above the current price, the first resistance to overcome at the price level of $288 (SMA100), to immediately find the ETH/USD with the price level of $291 (price congestion). Above this last resistance, two resistance levels at the price level of $300 and $317 (price congestion) and finally the price level of $340 (SMA200, estimated).
Below the current price, first support at the price level of $281 (EMA50) followed by the price level of $269 (price congestion). Below these two levels, it would be the relative lows left in recent weeks at the price level of $260 and $251 (relative lows).
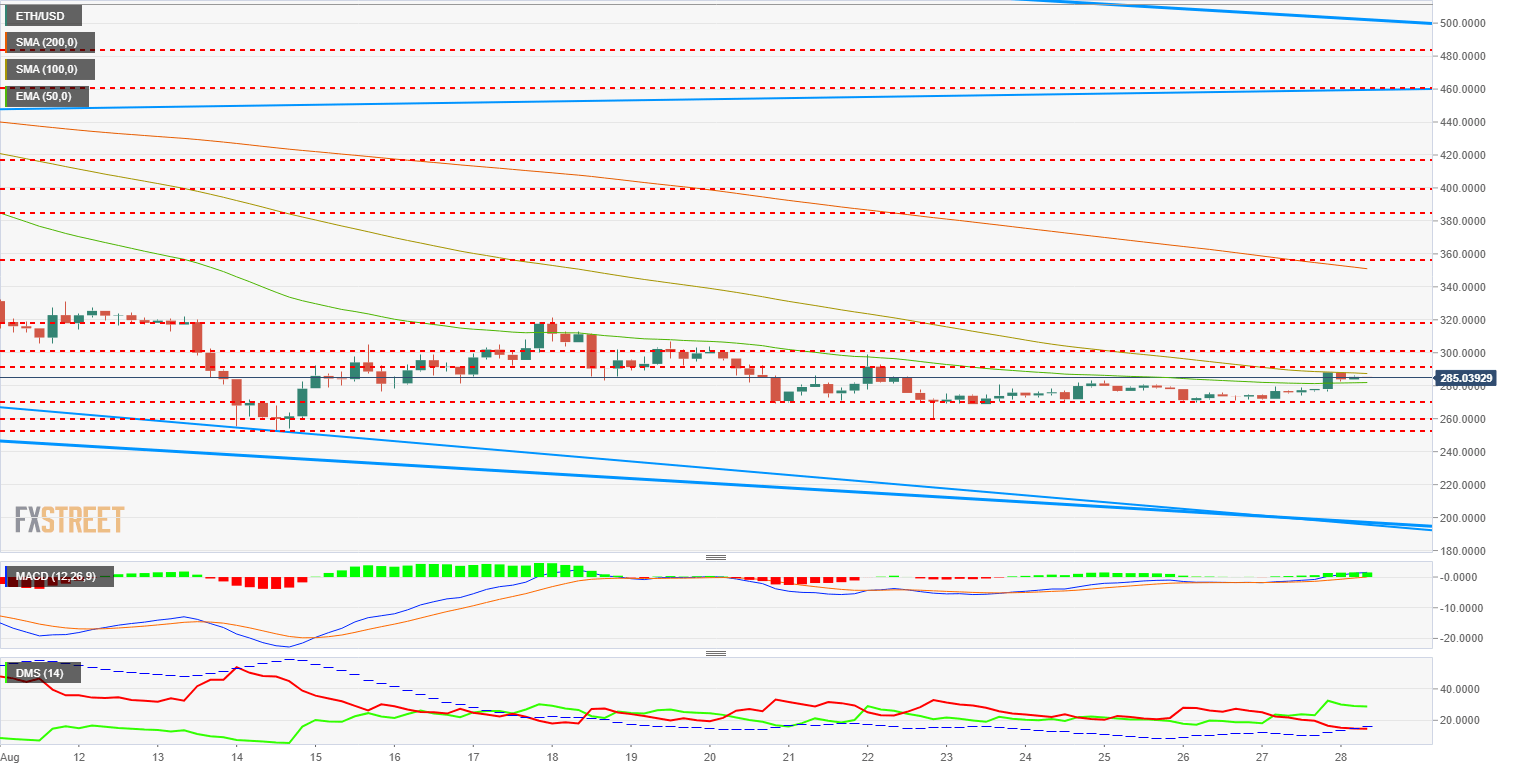
The MACD at 240-Min is placed slightly above the 0 line. It does so with some opening between the lines but with very little inclination. Ethereum needs to expand its daily range and bring back to life some lethargic indicators.
The DMI at 240-Min shows how buyers have reached levels not seen in many days as sellers retire and narrowly cross the line of an ADX that has reacted to the bullish movement, but has not yet surpassed the level that indicates the existence of a living trend.
XRP/USD 240-Min
XRP/USD is trading just below the resistance level of $0.342 (price congestion) and is trying to beat it on this first attempt. As in the case of its fellow Cryptos, the movement of the Ripple needs confirmation, and in this case the most interesting thing would be to beat the price level of $0.364 (SMA200). Above this important moving average, the next important resistance level is the relative highs of last August 18th at the price level of $0.368. From this level, the XRP/USD has a gap that forces it to jump with the target at a distant $0.413 (price congestion).
Below the current price, first support at the price level of $0.327 (EMA50), followed by the price level of $0.319 (price congestion) and finally the price level of $0.316 (SMA100). So far it would indicate that this upward movement has failed. Below this last level, a new bearish scenario would appear.
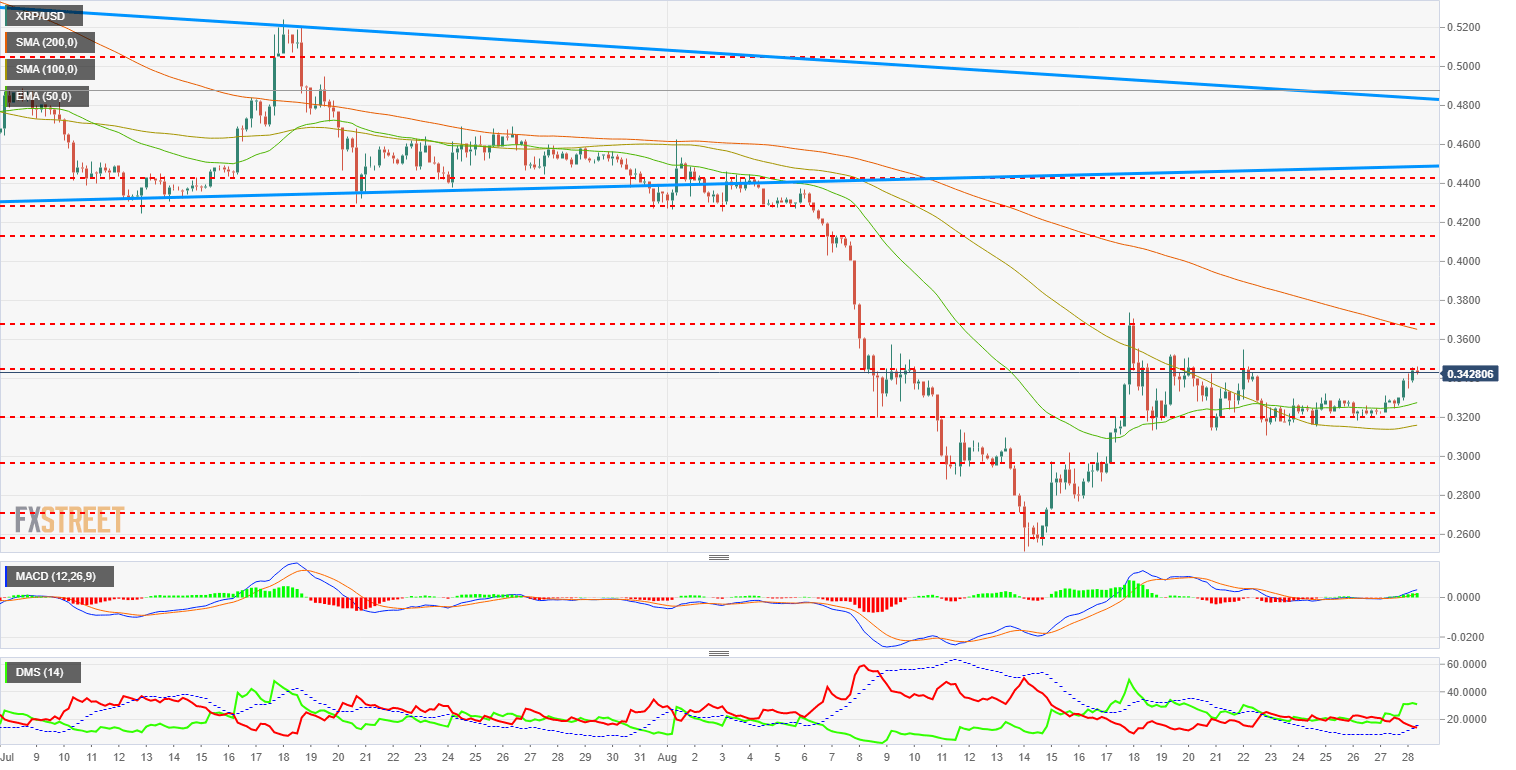
The MACD at 240-Min rotates upwards after resting on the 0 line. It does so with little separation between the lines but with good inclination. If the bullish movement continues, the range of movement could increase significantly.
The DMI at 240-Min shows buyers reacting upwards and taking control. The sellers, for their part, withdraw and cross the ADX line downwards. The ADX reacts strongly to the rise, but it still reacts at levels that increase the existence of a trend.
Author

Tomas Salles
FXStreet
Tomàs Sallés was born in Barcelona in 1972, he is a certified technical analyst after having completing specialized courses in Spain and Switzerland. He expanded his technical training following the guidance of great experts on the financial markets.


