Top 3 Price Prediction Bitcoin, Ethereum, Ripple: BTC struggles around the $62,000 level
- Bitcoin price faces pullback resistance at the lower band of the descending wedge around $62,000.
- Ethereum price finds support at $3,288, the 61.8% Fibonacci retracement level.
- Ripple price faces resistance at $0.500, its daily resistance level.

Bitcoin (BTC) encounters resistance near the $62,000 mark, while Ripple (XRP) mirrors BTC's challenge around the $0.500 level. Meanwhile, Ethereum (ETH) finds solid support around the critical price point of $3,288.
BTC faces resistance at the lower band of the descending wedge
Bitcoin's price broke below the descending wedge on Monday, declining approximately 7.5% to retest its crucial weekly support near $58,375 and rebounded by 5.8% on Tuesday.
Since Tuesday, BTC has faced resistance at the lower boundary of the broken descending wedge. At the time of writing, it trades around $61,704 on Friday.
If the lower boundary of the descending wedge around $62,000 holds as resistance, BTC could decline roughly 5% to reach its weekly support near $58,375.
On the daily chart, the Relative Strength Index (RSI) and the Awesome Oscillator (AO) are below their respective neutral levels of 50 and zero. This indicates that, according to these momentum indicators, the bearish sentiment prevails, suggesting the potential for further decline in BTC’s price.
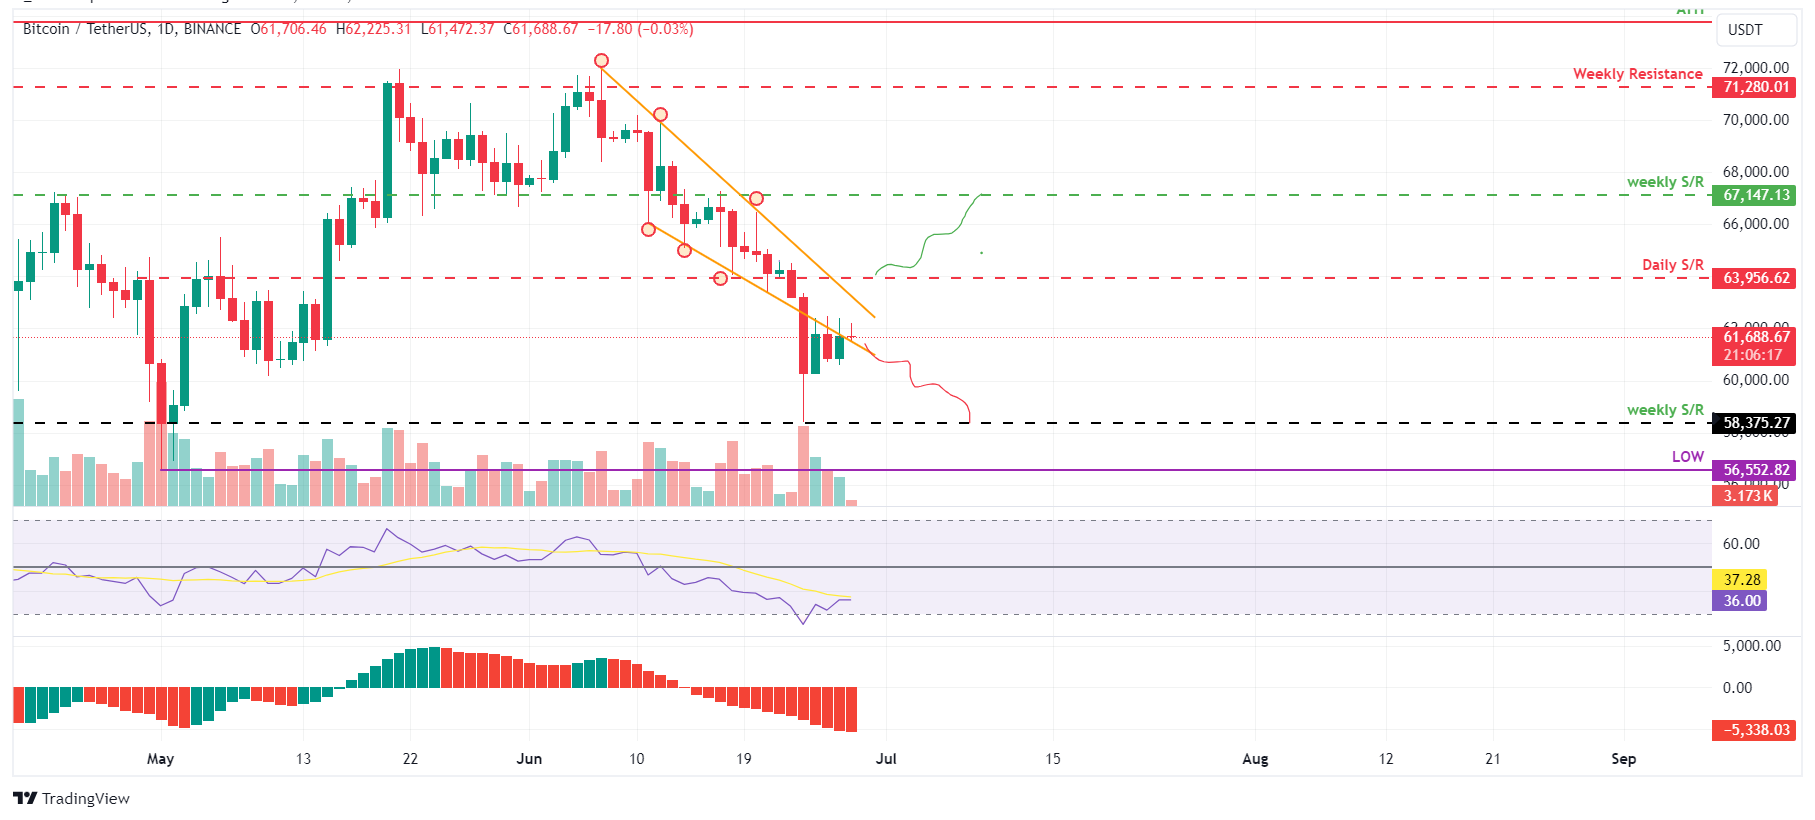
BTC/USDT daily chart
However, if BTC closes above the $63,956 level and forms a higher high in the daily time frame, it could indicate that bullish sentiment persists. Such a development may trigger a 5% rise in Bitcoin's price, revisiting its next weekly resistance at $67,147.
Ethereum price looks promising
Ethereum price retested its support level of $3,288, the 61.8% Fibonacci retracement level drawn from a swing low of $2,862 on May 14 to a swing high point of $3,977 on May 27. ETH rebounded by 5% from the 61.8% Fibonacci retracement level and trades at around $3,457, edging up approximately 0.3% on Friday.
If this support at $3,288 holds, ETH price could rally 8% from its current trading level of $3,457 to tag its previous high of $3,717 on June 9.
The Relative Strength Index (RSI) and the Awesome Oscillator in the daily chart are both below their neutral level of 50 and zero. If bulls are indeed making a comeback, then both momentum indicators must maintain their positions above their respective neutral levels.
If ETH closes above $3,717, the high of June 9, it could extend an additional rally of 7% to reach its previous resistance level of $3,977.
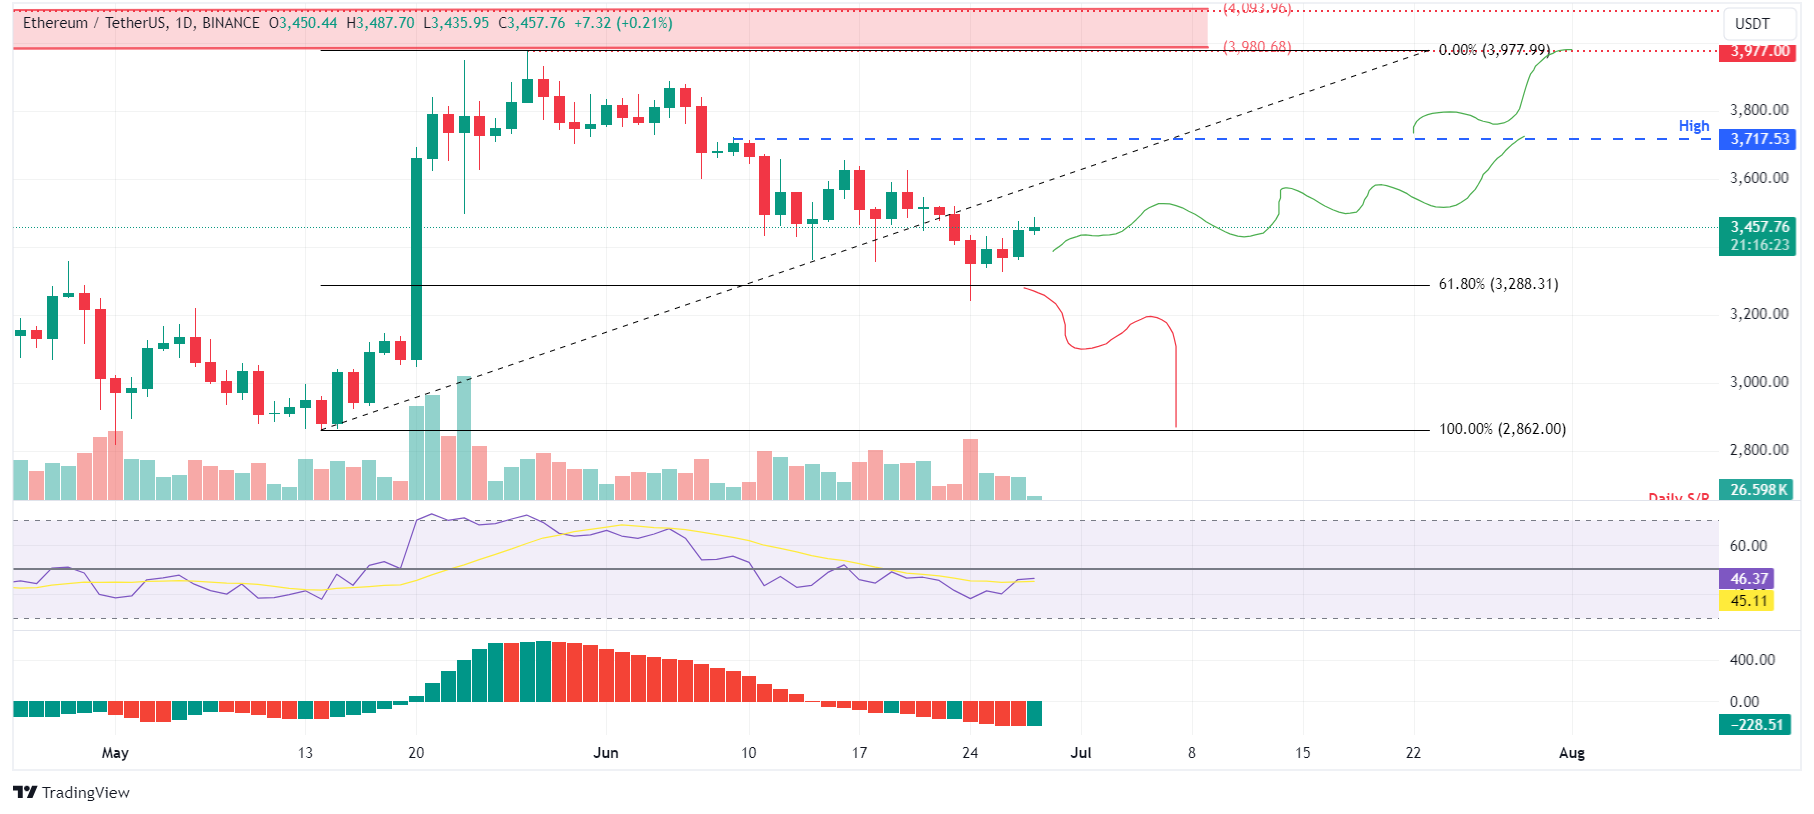
ETH/USDT daily chart
On the other hand, if Ethereum's daily candlestick price closes below the $3,288 level, it would produce a lower low and signal a break in the market structure. This move would invalidate the aforementioned bullish thesis, potentially triggering an extra 13% crash to the previous support level of $2,862.
Ripple price shows resilience
Ripple's price currently trades at $0.476, below the daily resistance level of $0.499. Despite Monday's fall in Bitcoin’s price, XRP has shown resilience in its price action.
If Ripple's price surpasses the barrier at $0.499, it could rise 7% from $0.499 to $0.532, its previous high from June 5.
In the daily chart, the Relative Strength Index (RSI) is currently below the 50 mark, indicating neutral to bearish sentiment, while the Awesome Oscillator (AO) remains below zero, suggesting bearish momentum. Both indicators must rise above their critical thresholds of 50 for RSI and zero for AO for a sustained bullish trend. Such a development would bolster the ongoing recovery rally in the market.
If the XRP daily candlestick closes above $0.532, it could extend an additional 9% rally to $0.581, a 50% price retracement level of $0.419 and $0.744 from March 11 to April 13.
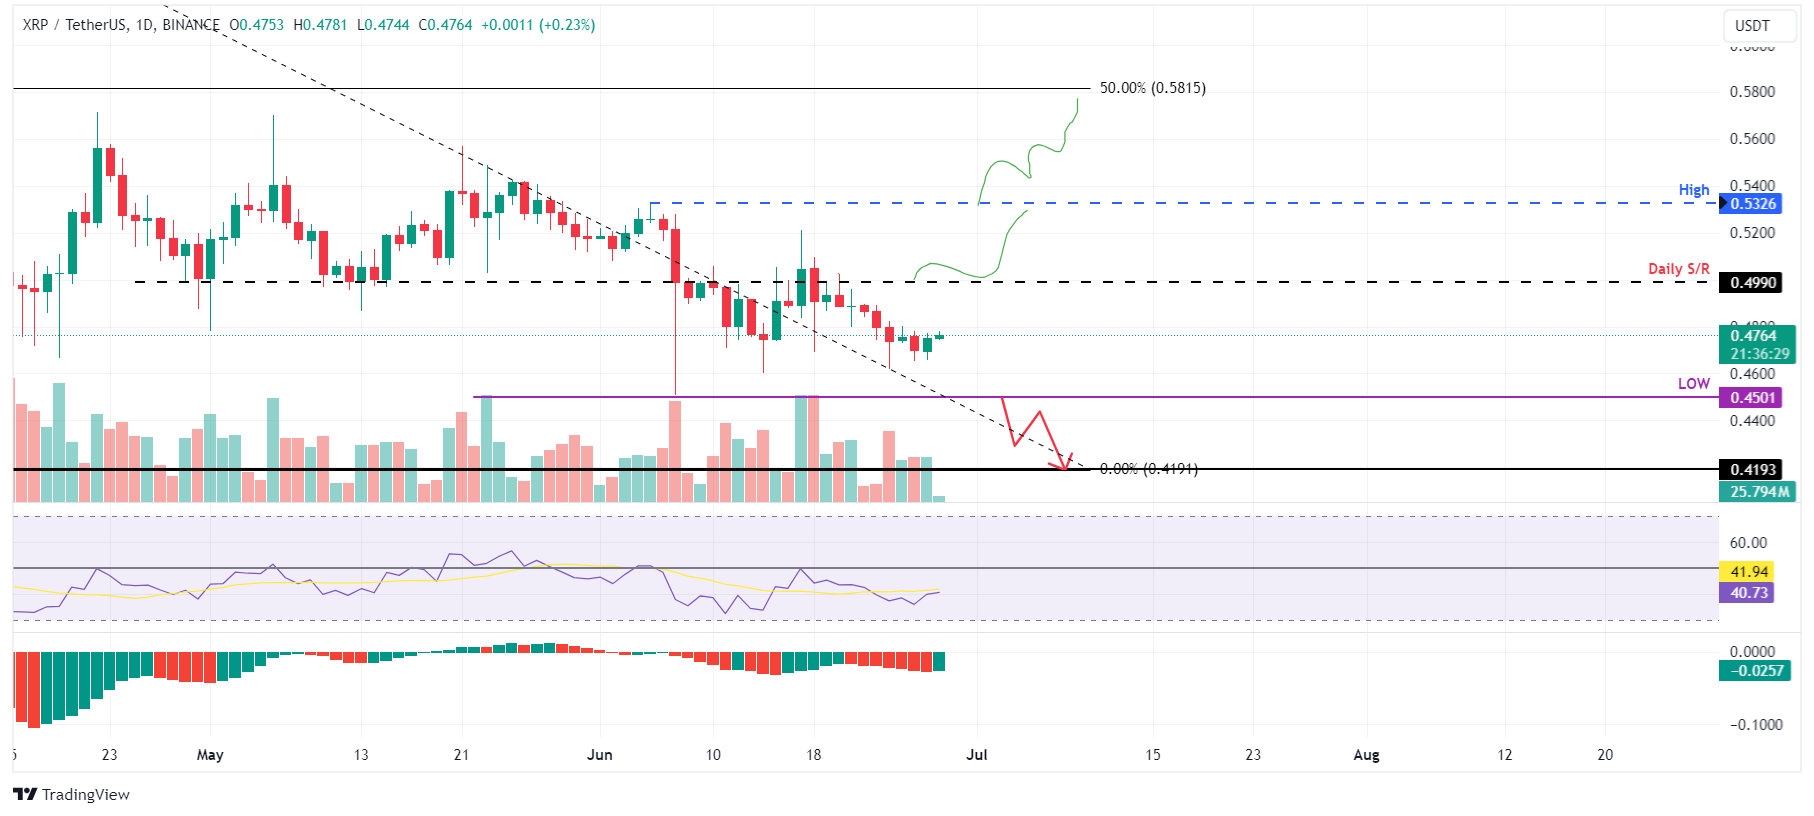
XRP/USDT daily chart
However, if the Ripple price daily candlestick closes below $0.450, marking the June 7 low, it would invalidate the bullish outlook by establishing a lower daily low. This scenario might lead to a 7% decline in XRP's price towards the April 13 low of $0.419.
Author

Manish Chhetri
FXStreet
Manish Chhetri is a crypto specialist with over four years of experience in the cryptocurrency industry.