Top 3 Price Prediction: Bitcoin, Ethereum, Ripple – BTC, ETH, and XRP consolidate as traders eye key macro data
- Bitcoin price extends its recovery on Friday, having gained nearly 3% so far this week.
- Ethereum price has consolidated between the $4,232 and $4,488 levels for over a week, signaling indecisiveness among traders.
- Ripple’s XRP finds support around its 100-day EMA at $2.77, eyeing a recovery ahead.

Bitcoin (BTC) price trades in green above $111,000 at the time of writing on Friday, having recovered nearly 3% so far this week. Ethereum (ETH) price consolidates between key levels, while Ripple (XRP) finds support around its critical level. The top three cryptocurrencies are consolidating as traders adopt a cautious stance ahead of key US macroeconomic data, due to be released on Friday, which could influence the Federal Reserve’s (Fed) monetary policy outlook, keeping crypto markets on edge.
Bitcoin flashes early strength as momentum indicators improve
Bitcoin price started the week on a positive note on Monday and recovered 3.20% until Wednesday, closing above its 100-day Exponential Moving Average (EMA) at $110,748. However, on Thursday, BTC faced a correction but found support around its 100-day EMA. At the time of writing on Friday, it extends its recovery trading above $111,000.
If BTC extends its recovery, it could further the rally toward its daily resistance level at $116,000.
The Relative Strength Index (RSI) on the daily chart reads 46 and points upward toward its neutral level of 50, indicating that bearish momentum is fading. Moreover, the Moving Average Convergence Divergence (MACD) is showing a bullish crossover on Friday, indicating improving momentum and supporting the bullish view.
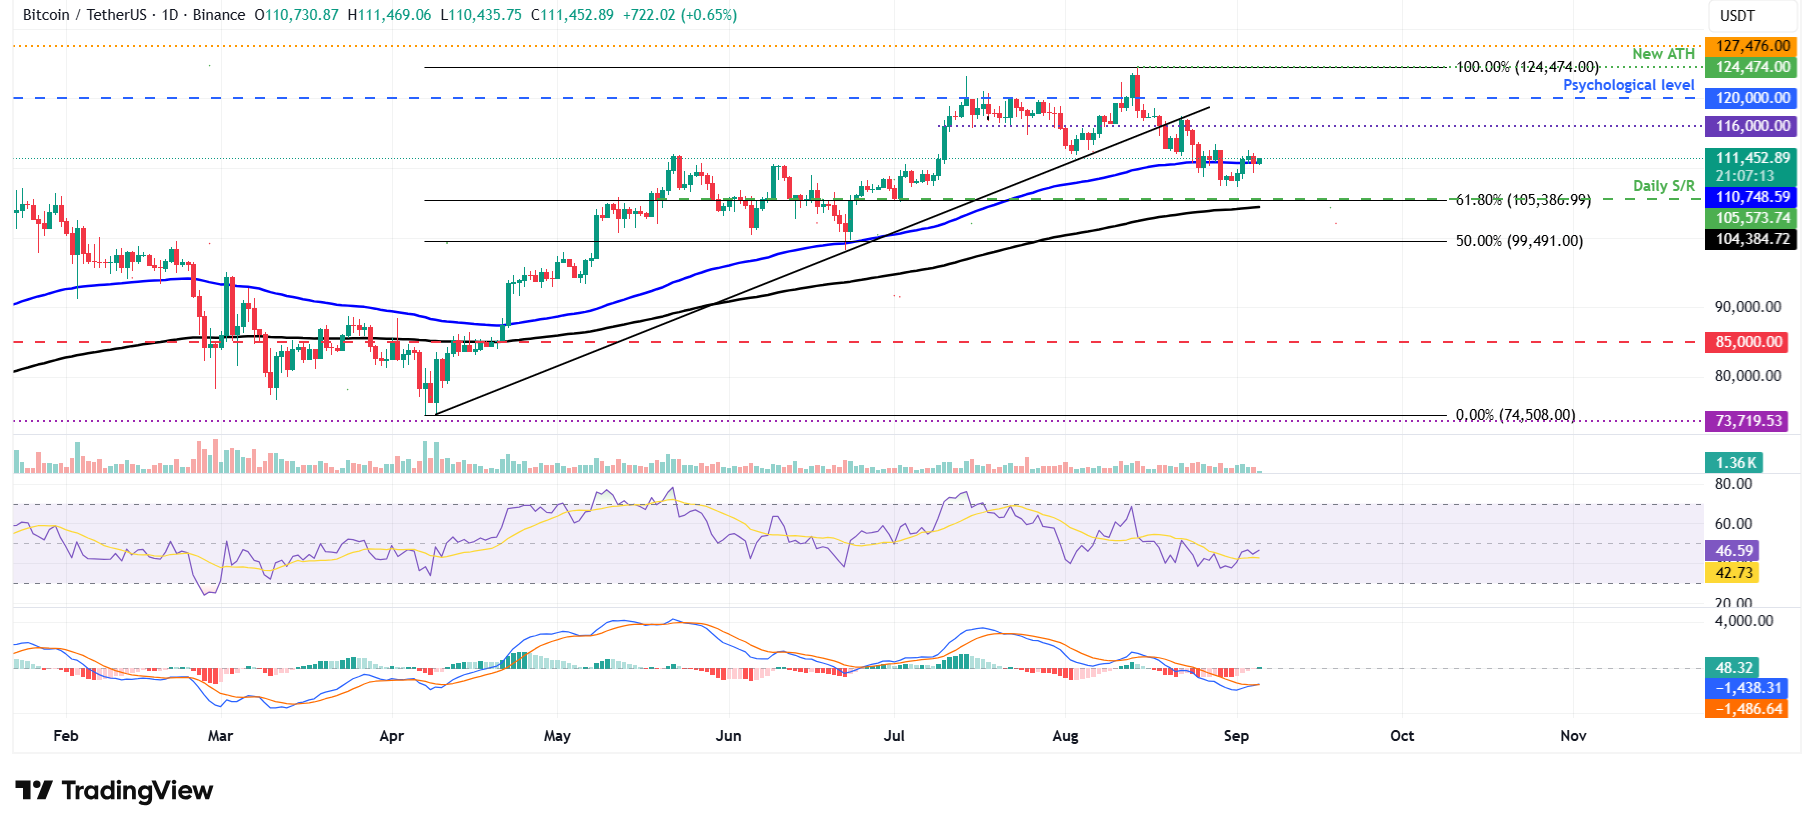
BTC/USDT daily chart
However, if BTC faces a correction, it could extend the decline toward its daily support level at $105,573.
Ethereum consolidates, signaling indecisiveness among traders
Ethereum price has been consolidating between $4,232 and $4,488 since last Friday. As of this week, it has hovered between these levels, indicating indecisiveness among traders. At the time of writing on Friday, it hovers near the lower consolidation level at $4,232.
If ETH finds support around the lower consolidation boundary at $4,232 and closes above $4,488 on a daily basis, it could extend the rally toward its record high at $4,956.
The RSI on the daily chart is hovering around its neutral level of 50, indicating indecisiveness among traders.
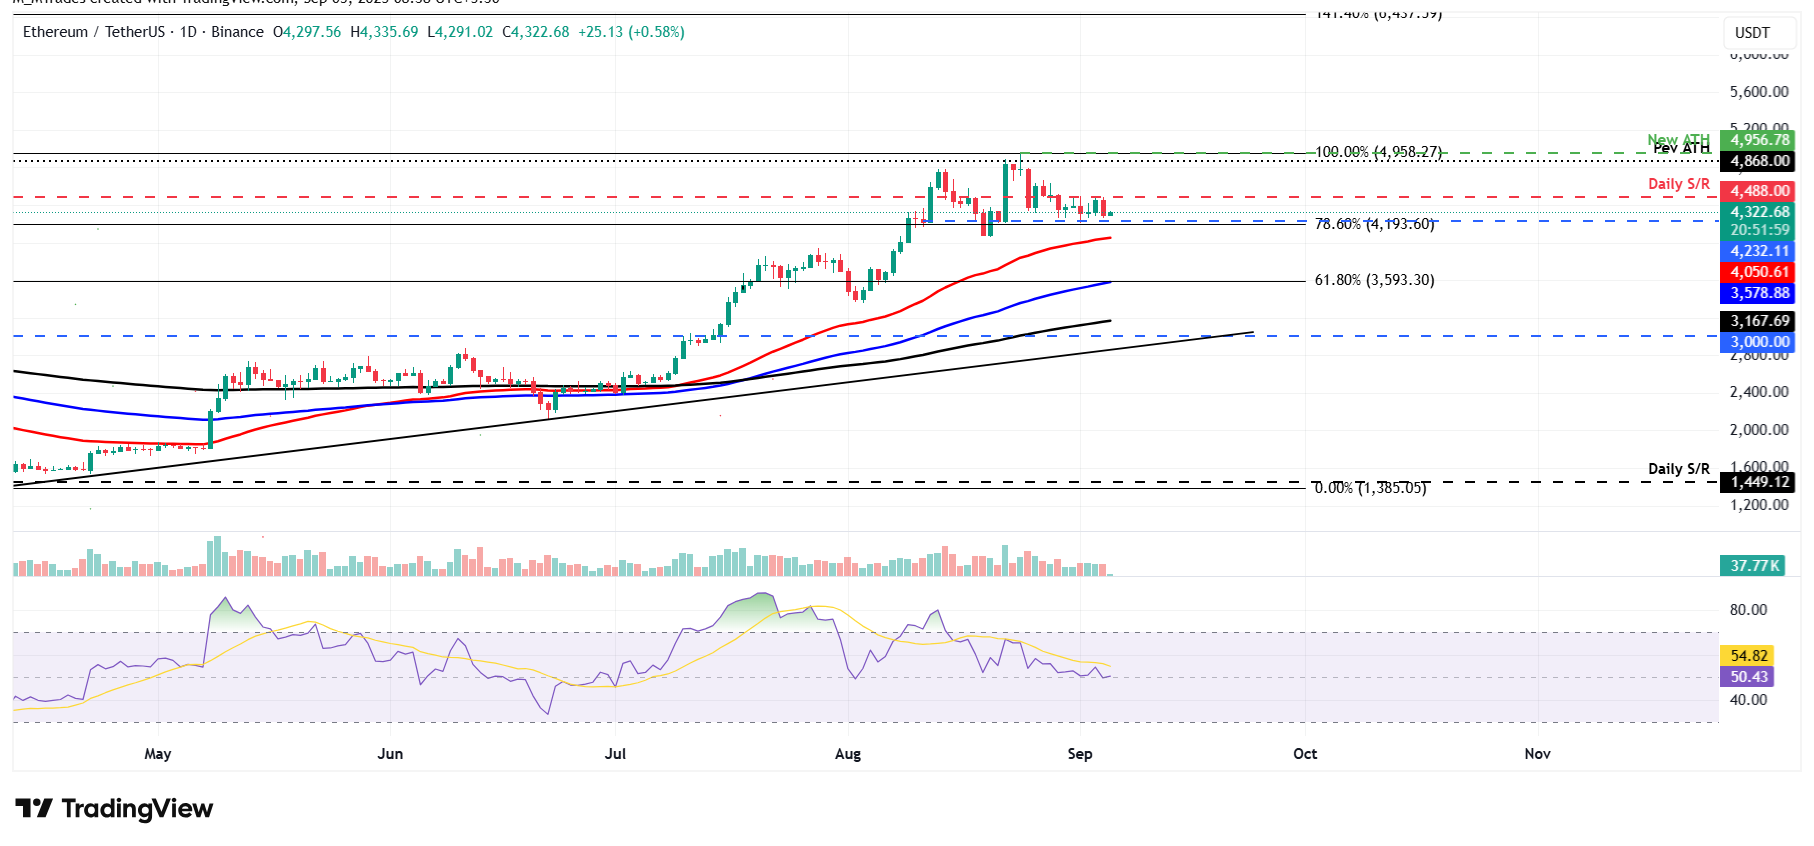
ETH/USDT daily chart
However, if ETH faces a correction and closes below the lower consolidation level at $4,232, it could extend the decline to retest its 50-day EMA at $4,050.
XRP technicals show fading bearish momentum
XRP price found support around its daily level at $2.72 on Monday and recovered 3.74% the next day. However, it faced rejection on Wednesday and declined slightly the next day, retesting its 100-day EMA at $2.77. At the time of writing on Friday, it recovers slightly, trading around $2.80.
If the 100-day EMA at $2.77 continues to hold, XRP could extend its recovery toward its 61.8% Fibonacci retracement level at $2.99.
Like Bitcoin, XRP’s RSI reads 43, pointing upward and nearing its neutral level of 50, indicating fading bearish momentum. For the recovery rally to be sustained, the RSI must move above the neutral level.
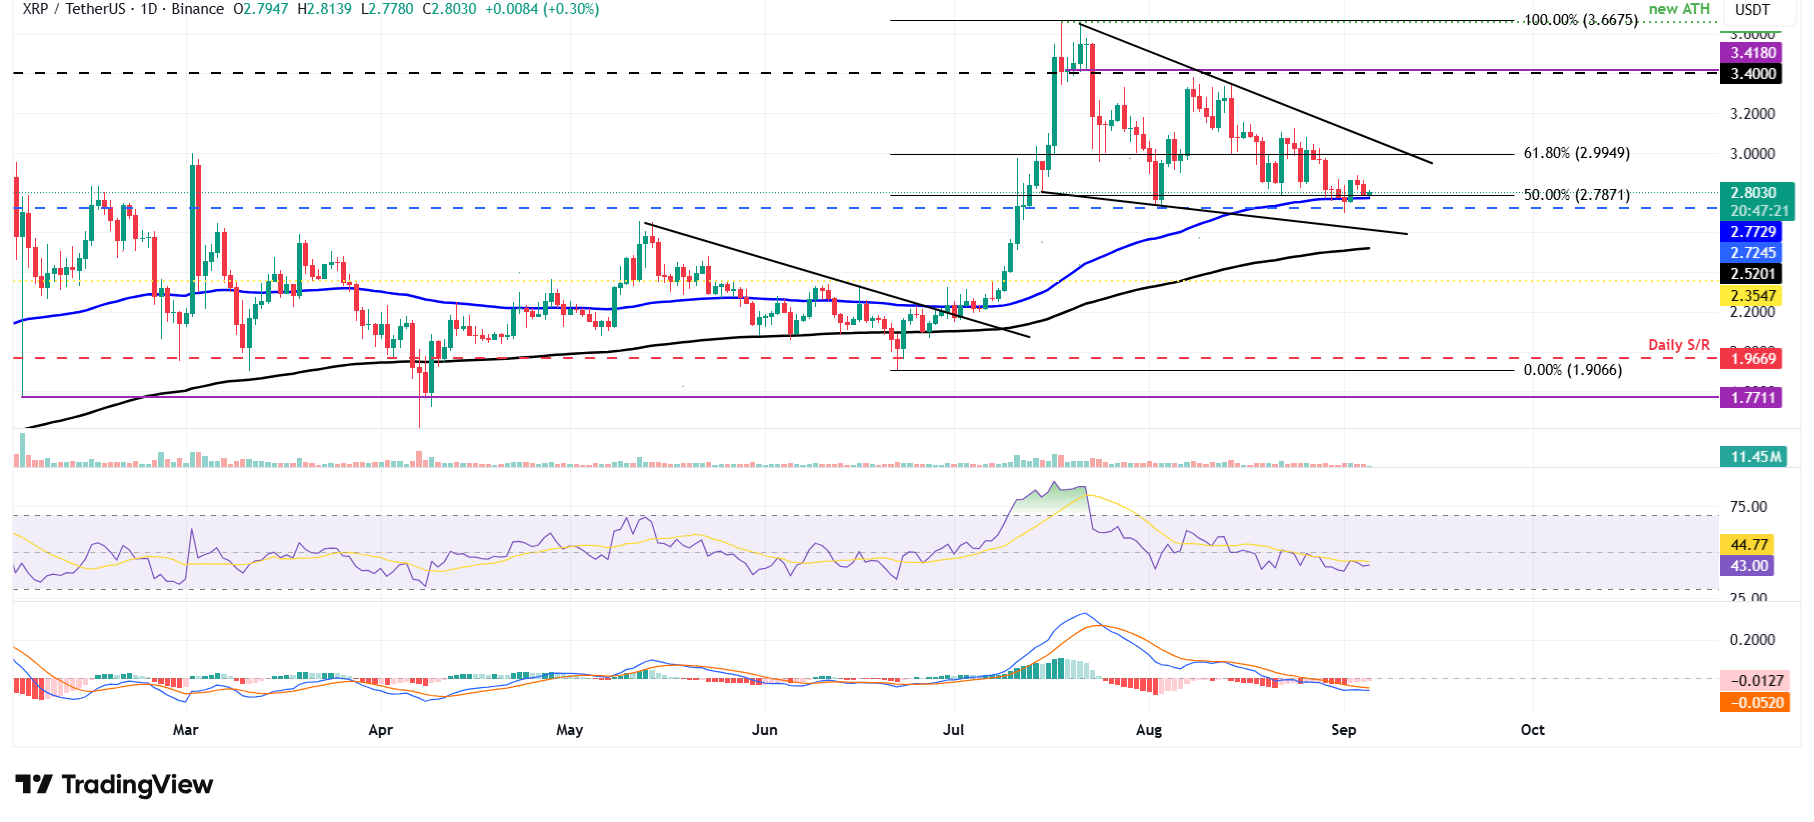
XRP/USDT daily chart
However, if XRP closes below $2.77, it could extend the decline toward its daily support at $2.72.
Cryptocurrency metrics FAQs
The developer or creator of each cryptocurrency decides on the total number of tokens that can be minted or issued. Only a certain number of these assets can be minted by mining, staking or other mechanisms. This is defined by the algorithm of the underlying blockchain technology. On the other hand, circulating supply can also be decreased via actions such as burning tokens, or mistakenly sending assets to addresses of other incompatible blockchains.
Market capitalization is the result of multiplying the circulating supply of a certain asset by the asset’s current market value.
Trading volume refers to the total number of tokens for a specific asset that has been transacted or exchanged between buyers and sellers within set trading hours, for example, 24 hours. It is used to gauge market sentiment, this metric combines all volumes on centralized exchanges and decentralized exchanges. Increasing trading volume often denotes the demand for a certain asset as more people are buying and selling the cryptocurrency.
Funding rates are a concept designed to encourage traders to take positions and ensure perpetual contract prices match spot markets. It defines a mechanism by exchanges to ensure that future prices and index prices periodic payments regularly converge. When the funding rate is positive, the price of the perpetual contract is higher than the mark price. This means traders who are bullish and have opened long positions pay traders who are in short positions. On the other hand, a negative funding rate means perpetual prices are below the mark price, and hence traders with short positions pay traders who have opened long positions.
Author

Manish Chhetri
FXStreet
Manish Chhetri is a crypto specialist with over four years of experience in the cryptocurrency industry.


