Top 3 Price Prediction Bitcoin, Ethereum, Ripple: Bitcoin's passivity weighs down the market
- BTC/USD fails again at $12000 and spreads doubts to the crypto board.
- Over-optimism and technical divergences show the weakness of the market.
- Ripple sticks at $0.30 and matches BTC on the weak side.

Time is running out for Bitcoin if it wants to join the upward race of the Ethereum. The King's crown feels the jolts of the Ether which, with overwhelming authority, is holding the positive tone of the market.
Yesterday, the BTC/USD pair made a second attempt at price congestion resistance at the $12000 price level. Again it failed, which hints for today slight price declines. With both falling, Bitcoin makes it worse than Ethereum.
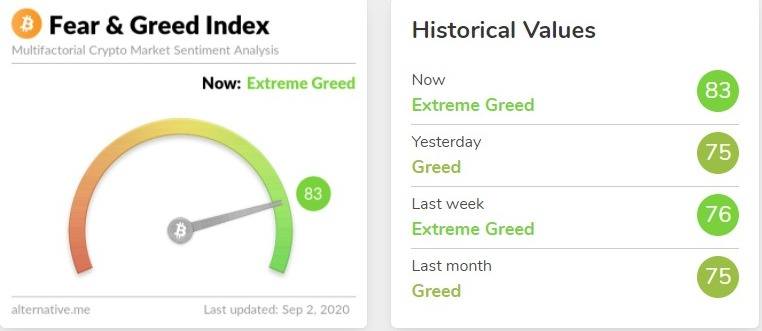
The market sentiment indicator that the site alternative.me is preparing today leaps forward and climbs to level 83 – extreme greed. The current excessive optimism is problematic, especially considering the lack of power of Bitcoin.
ETH/BTC Daily Chart
The ETH/BTC pair is currently trading at 0.0401, pausing after five consecutive days of substantial gains.
Above the current price, the first resistance level is at 0.0403, then the second at 0.0420 and the third one at 0.0473.
Below the current price, the first support level is at 0.0372, then the second at 0.0338 and the third one at 0.0328.
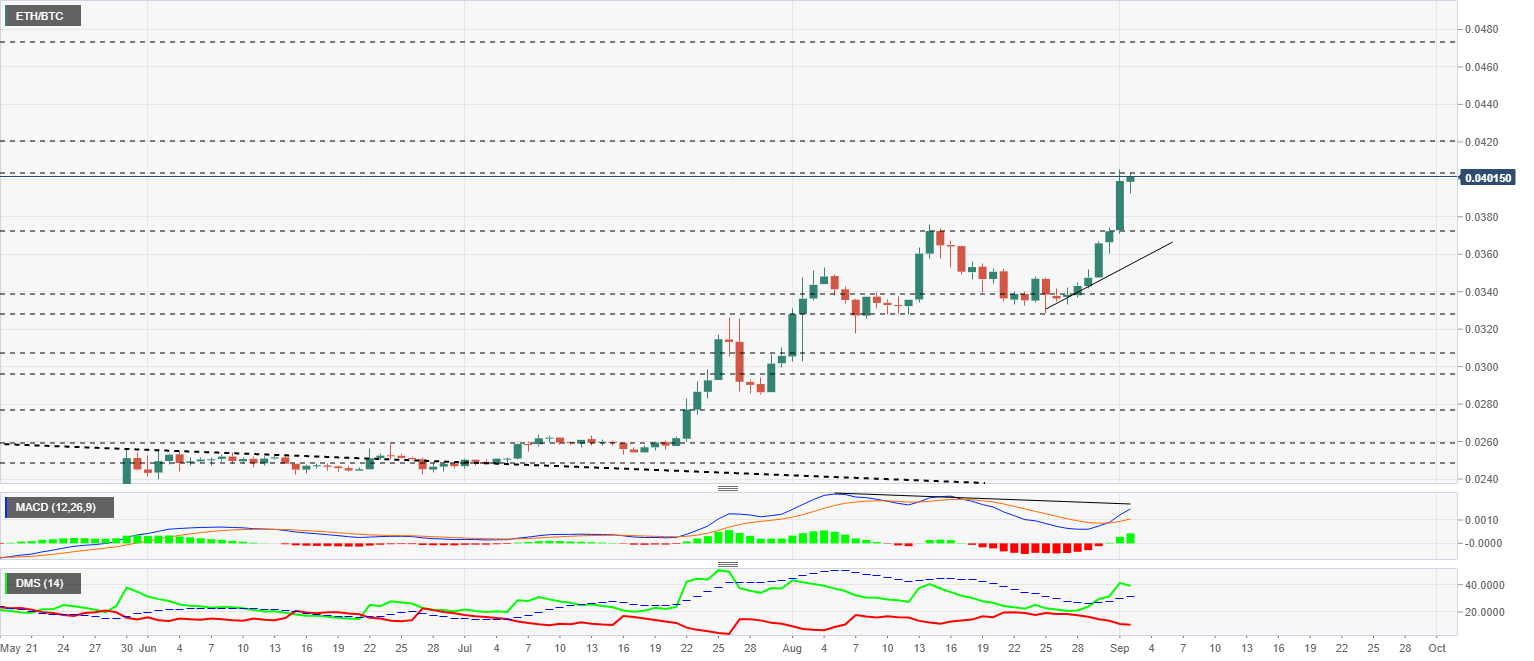
The MACD on the daily chart shows a bullish continuity profile, although it threatens a correction of the excesses of the last few days. The structure of the moving averages is divergent with the price and could be indicating a penalty in the short term.
The DMI on the daily chart shows the bulls losing strength but without the bears feeling more confident, as they are also falling. The current structure is open and allows for developments on both sides of the chart.
BTC/USD Daily Chart
The BTC/USD pair is currently trading at the $11793 price level following the failure of the attempt to break out of the $12000 price level. Bitcoin neither overcomes the obstacles nor convinces investors with a desire for weekly double-digit returns.
Bitcoin moves inside a complex expansive triangular structure for upwardly movements. Above the $13000 price level is the upper trend line of the figure, a fairly steep line that's always difficult to overcome and even more so to consolidate.
Above the current price, the first resistance level is at $12000, then the second at $12350 and the third one at $12850.
Below the current price, the first support level is at $11450, then the second at $10420 and the third one at $9500.
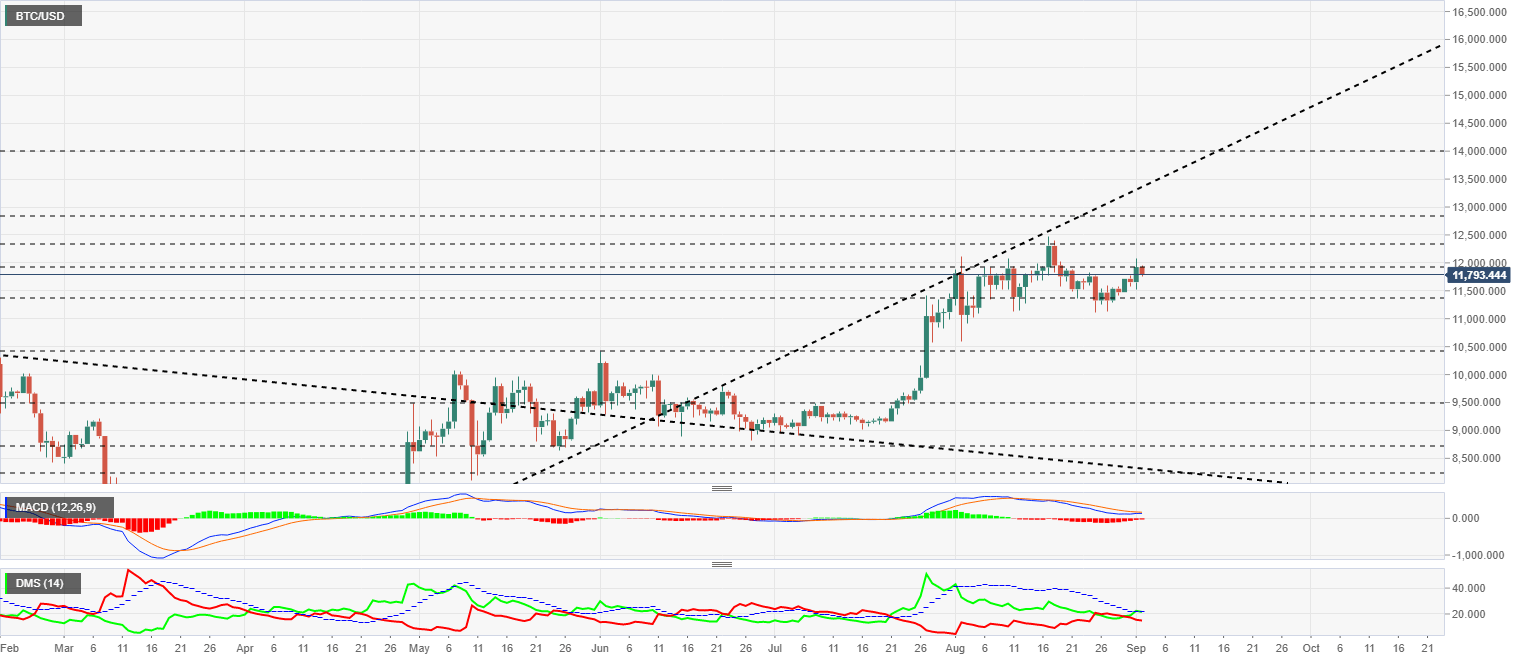
The MACD on the daily chart shows the difficulty in completing the bullish cross. Today, the moving averages are flattening out and jeopardizing the upward momentum of the last few days.
The DMI on the daily chart confirms the tough path that BTC/USD will need to take in order to break out of the bullish channel. Yesterday, the bulls broke through the ADX line but failed to consolidate, and today it is back below it, cancelling the bullish pattern. Luckily for the buying side, the bears are showing no signs of wanting to take advantage of the Bitcoin weakness.
ETH/USD Daily Chart
The ETH/USD pair is currently trading at the price level of $474.5. The drawing of the Japanese sail at this time of day shows hesitation among participants, who could make profits after the significant increases of the last five days. These sales can benefit Bitcoin, from which Ethereum has made significant gains.
Above the current price, the first resistance level is at $485, then the second at $520 and the third one at $570.
Below the current price, the first support level is at $440, then the second at $400 and the third one at $360.
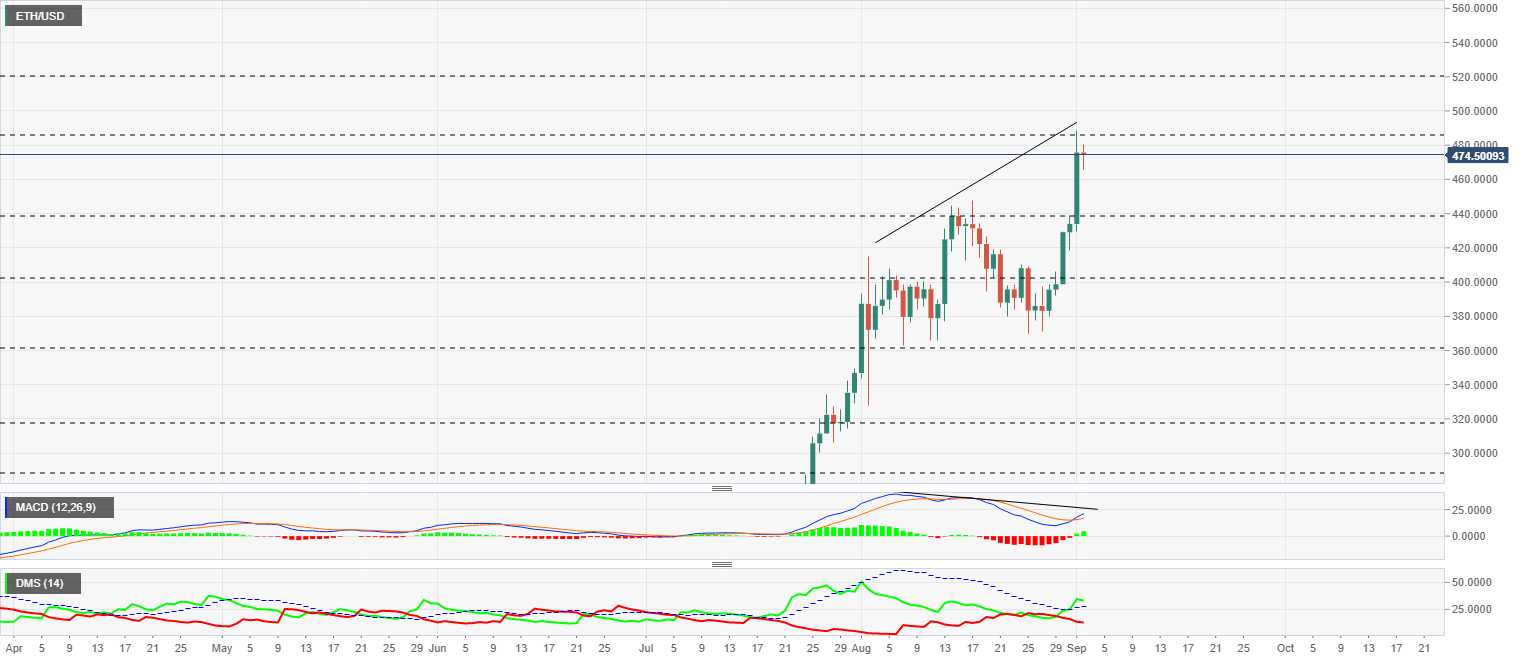
The MACD on the daily chart shows a divergent structure with the price and increases the chances of a price change in the short term.
The DMI on the daily chart shows how the bullish pattern continues to be fully upward, reinforcing, in this case, a possible extension of the current rise to the psychological level of $500 or $520.
XRP/USD Daily Chart
The XRP/USD pair is currently trading at a price level of $0.2907 and is adding to the bullish trend in the sector.
Above the current price, the first resistance level is at $0.30, then the second at $0.318 and the third one at $0.331.
Below the current price, the first support level is at $0.288, then the second at $0.283 and the third one at $0.267.
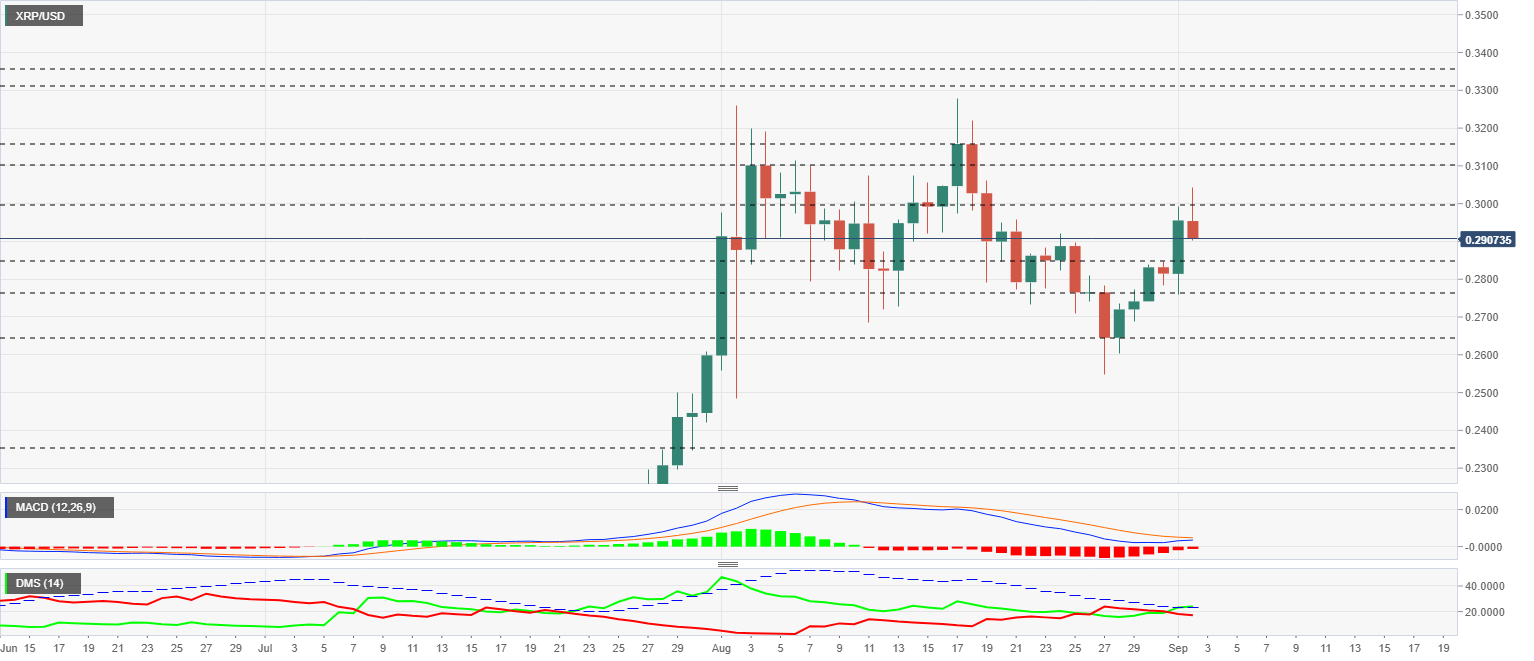
The MACD on the daily chart shows a bullish cross and may try to cross it again in the next few hours.
The DMI on the daily chart shows the bulls with a small advantage over the bears as they face a possible upward crossing of the ADX line. The difficulty that the buying side is facing is an excellent opportunity to show that Ripple has returned strongly to the board after months of hesitation.
Author

Tomas Salles
FXStreet
Tomàs Sallés was born in Barcelona in 1972, he is a certified technical analyst after having completing specialized courses in Spain and Switzerland. He expanded his technical training following the guidance of great experts on the financial markets.


