Top 3 Price Prediction Bitcoin, Ethereum, Ripple: Bitcoin set to retest key levels
- Bitcoin price is trading inside a descending wedge, and a breakout above $64,600 signals a bullish move.
- Ethereum price is approaching its key support at $3,288, the 61.8% Fibonacci retracement level.
- Ripple price faces resistance at $0.500, its daily resistance level.

Bitcoin (BTC) price is consolidating within a descending trendline, with a potential bullish breakout anticipated above $64,600. Meanwhile, Ethereum (ETH) and Ripple (XRP) prices retraced to critical support levels before gearing up for a bullish upswing.
Bitcoin price consolidating within a descending wedge
Bitcoin price is trading inside a descending channel, drawn from multiple swing highs and lows between early June and mid-June, as shown in the daily chart below.
If BTC continues to decline, it could find support at $62,451, the 61.8% Fibonacci retracement level from a swing low of $56,552 on May 1 to a swing high of $71,995 on May 21.
If the $62,451 support holds and BTC breaks above the descending channel, it could rally 7.5% to reach its previous resistance level of $67,147.
The Relative Strength Index (RSI) and the Awesome Oscillator (AO) on the daily chart are below their respective mean levels of 50 and zero. If bulls are indeed making a comeback, then both momentum indicators must maintain their positions above their respective mean levels.
This development would provide additional momentum to the recovery rally.
If bullish sentiment prevails and the overall cryptocurrency market shows optimism, BTC may extend its rally by 6% from $67,147 to retest its previous resistance level of $71,280.
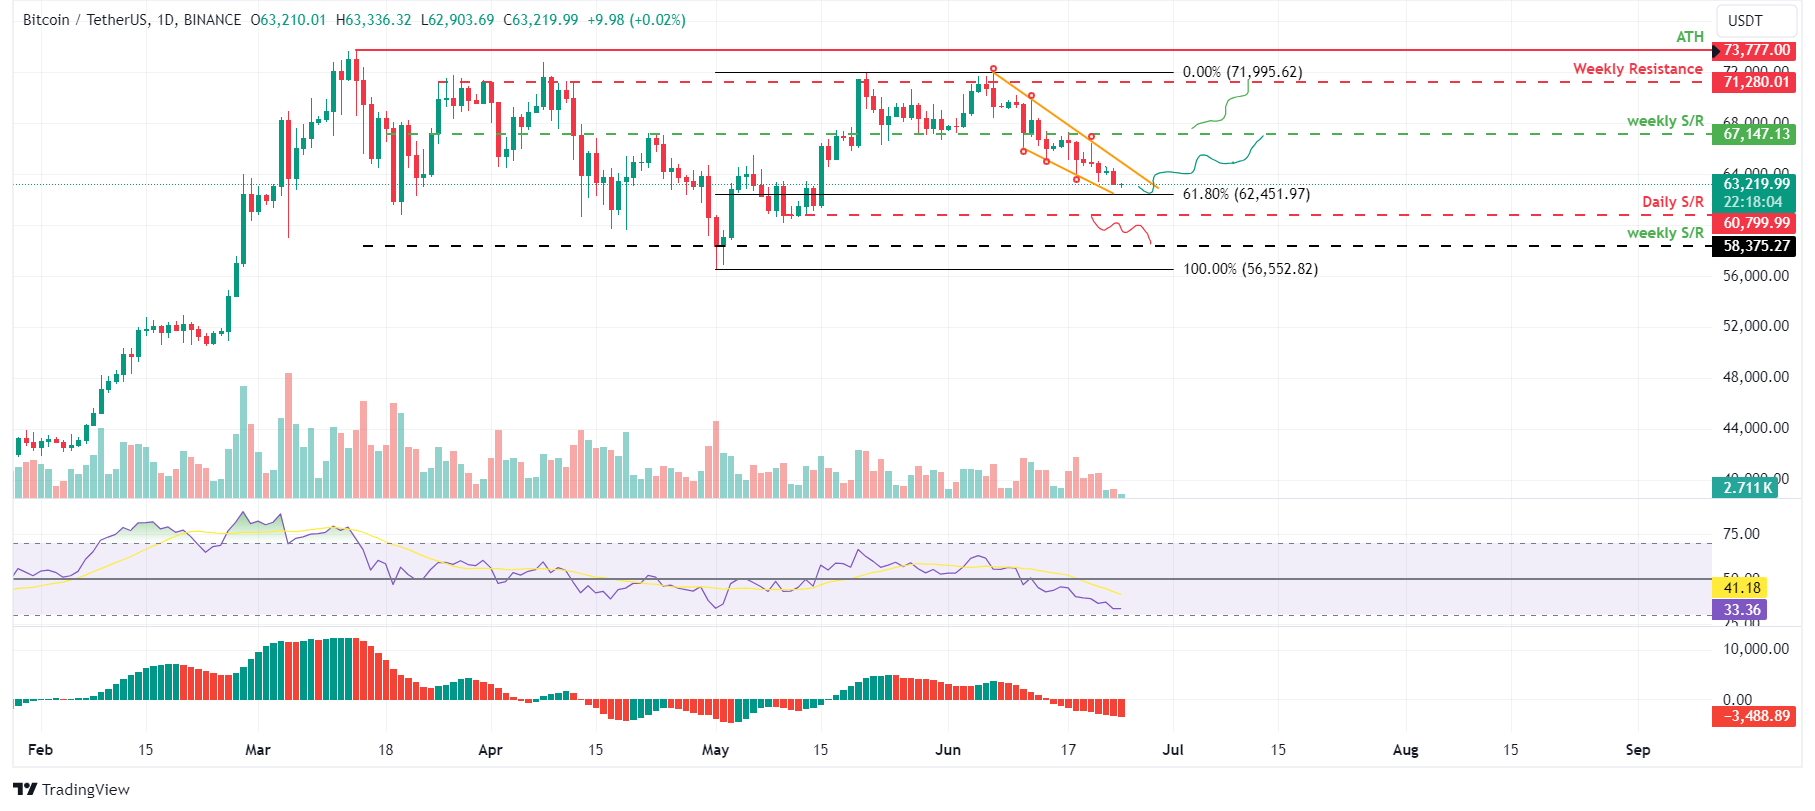
BTC/USDT 1-day chart
However, if Bitcoin price breaks and closes below its daily support level of $60,800, the bullish thesis could be invalidated, leading to a 4% crash to its weekly support level of $58,375.
Ethereum price could retest key support level
Ethereum's price is declining towards its support level of $3,288, the 61.8% Fibonacci retracement level drawn from a swing low of $2,862 on May 14 to a swing high point of $3,977 on May 27.
If this support holds, ETH price could rally 13% to tag its previous high of $3,717 on June 9.
The Relative Strength Index (RSI) and the Awesome Oscillator in the daily chart are both below their mean level of 50 and zero. If bulls are indeed making a comeback, then both momentum indicators must maintain their positions above their respective mean levels.
If ETH closes above $3,717, the high of June 9, it could extend an additional rally of 7% to reach its previous resistance level of $3,977.
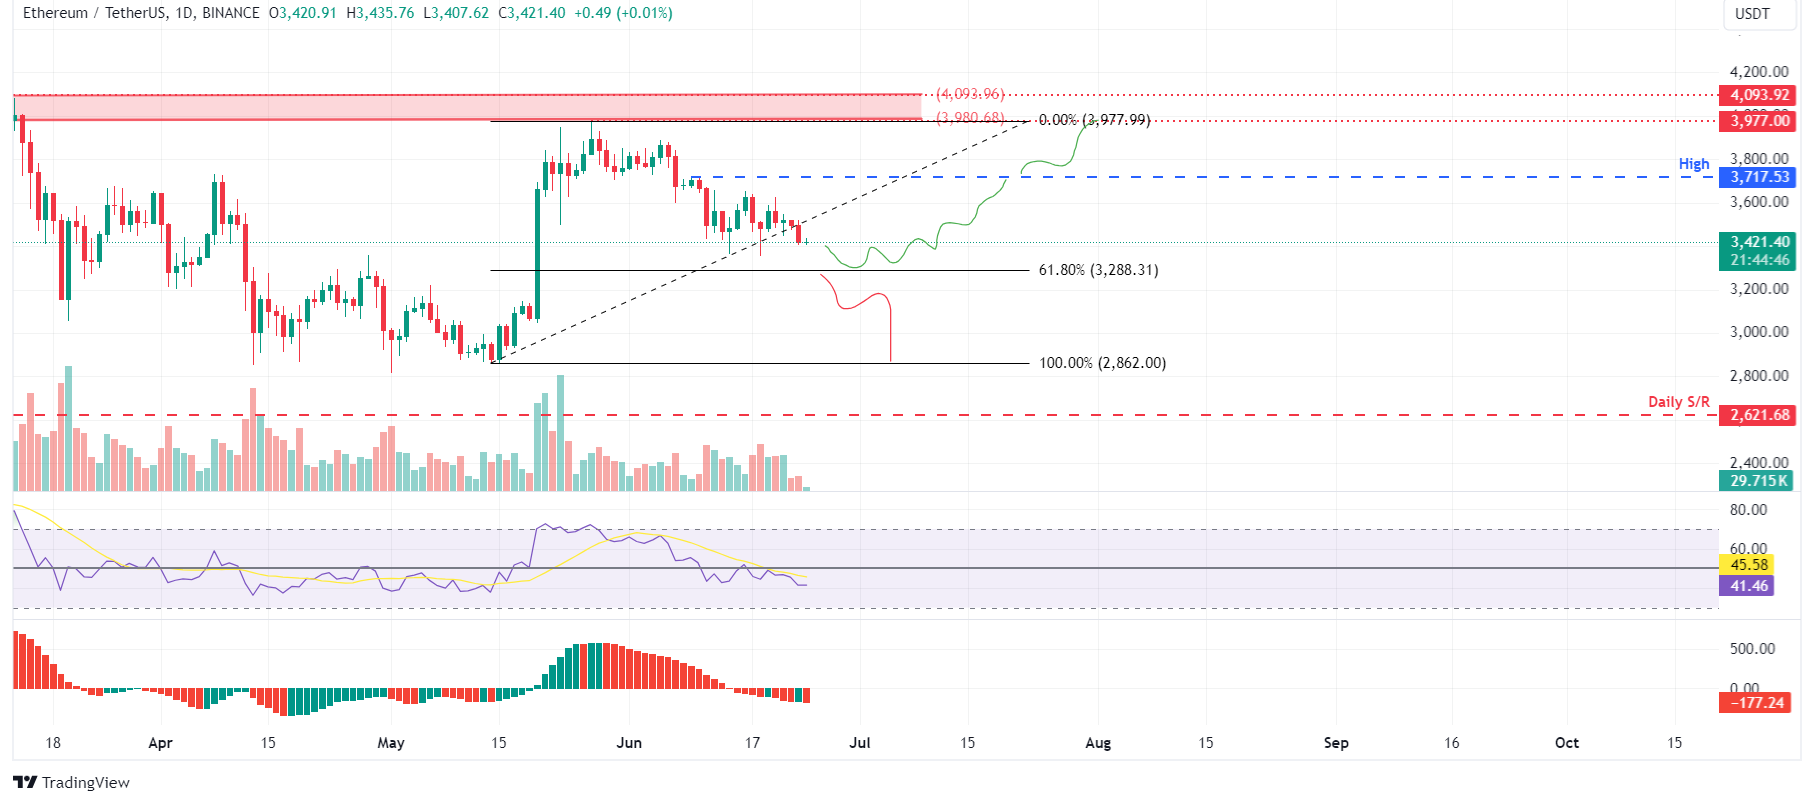
ETH/USDT 1-day chart
On the other hand, if Ethereum's daily candlestick price closes below the $3,288 level, it would produce a lower low and signal a break in the market structure. This move would invalidate the aforementioned bullish thesis, potentially triggering an extra 13% crash to the previous support level of $2,862.
Ripple price set for a downward correction
Ripple price faces resistance at $0.499, its daily resistance level, and is currently trading at $0.477.
If Ripple's price breaks above $0.499, it could rise 7% from $0.499 to $0.532, its previous high from June 5.
The Relative Strength Index (RSI) in the daily chart is below the 50 mean level, while the Awesome Oscillator (AO) is below its zero line. If bullish momentum persists, both momentum indicators must remain above their respective thresholds of 50 and zero. This would provide further support to the recovery rally.
If the XRP daily candlestick closes above $0.532, it could extend an additional 9% rally to $0.581, a 50% price retracement level of $0.419 and $0.744 from March 11 to April 13.
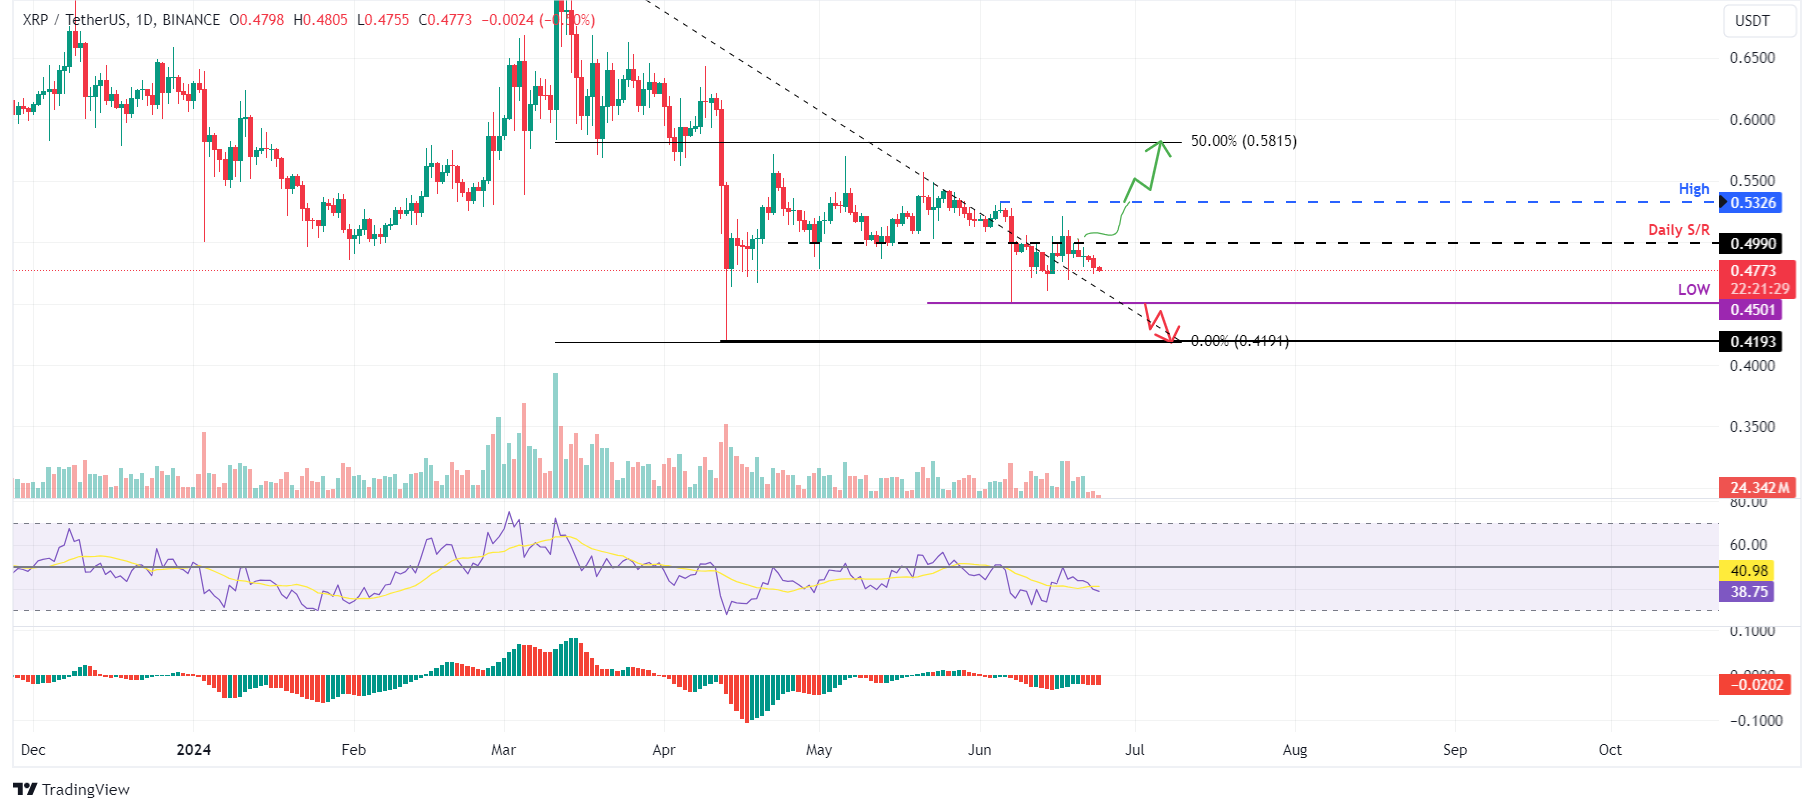
XRP/USDT 1-day chart
Conversely, if Ripple's daily candlestick closes below $0.450, marking the June 7 low, establishing a lower low on the daily chart would invalidate the bullish outlook. This scenario might lead to a 7% decline in XRP's price towards the April 13 low of $0.419.
Author

Manish Chhetri
FXStreet
Manish Chhetri is a crypto specialist with over four years of experience in the cryptocurrency industry.


