TOP 3 price prediction Bitcoin, Ethereum, Ripple: Bitcoin on the rise as the entire Altcoin board falls?
- BTC/USD shows its strength over the weekend and exceeds $7,300, losing strength at today's opening.
- ETH/USD falls in the last few hours amidst strong criticism about its future.
- XRP/USD is also in the group of Cryptos that have not been able to follow Bitcoin.

It was very interesting to see what happened during the weekend on the Crypto board. The BTC/USD surprised to the positive side with unexpected increases, after an already good week. On the negative side, we have seen poor performance of Ethereum and the rest of the Altcoins in the same period without managing to maintain Saturday's profits and seriously damaging their technical aspect.
I have long considered a Bitcoin decoupling scenario with respect to the Altcoins as a real possibility. That scenario seems more likely today than ever, surely thanks to the probable launches of ETF’s on Bitcoin, which are not foreseen in the short term for other Cryptocurrencies.
BTC/USD 240-Min
The BTC/USD recorded mild early morning falls in the European market. It leaves the relative high at the $7,330 price level, while BTC/USD is currently trading at the $7,260 price level. In previous analyses, I commented on the jump in the BTC/USD price from the $7,100 support level to the next level at the $7,400 level. At the moment, it seems that it has been too much for the BTC/USD and it has not been able to reach this target on the first attempt. The technical situation in the short term is one of slight falls, but they are not likely to last long.
Above the current price, the BTC/USD has as its first challenge the price level of $7,400 (price congestion resistance), followed a bit higher at the price level of $7,600 (price congestion resistance) and $7,730 (another price congestion resistance).
Below the current price, the first support awaits at the price level of $7,200 (price congestion support). The second support for the BTC/USD is at the $7,000 level (EMA50) and as a critical support level, the $6,950 price (trend line).
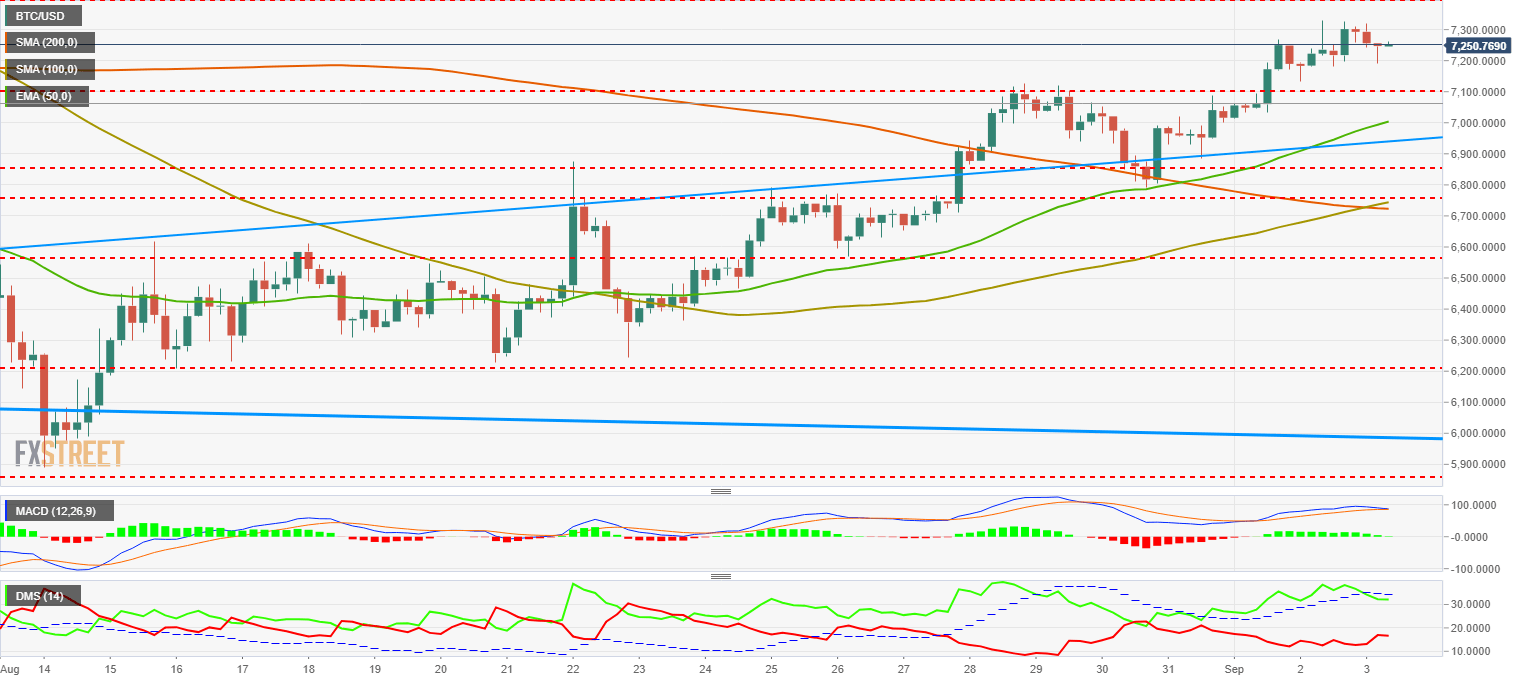
The MACD at 240-Min shows a down-cut profile, with a divergent structure from the recent highs. The most likely scenario is bearish, but we should not lose sight of the significant upward force in the longer term that can limit downward movement.
The Directional Movement Index at 240-Min shows buyers cutting down the ADX line. This graphical pattern often leads to price declines. On the other hand, sellers do not seem to be very trusting and do not increase their activity. The trend force, indicated by the ADX, remains at high levels.
ETH/USD 240-Min
The ETH/USD is currently trading at the price level of $289.60 after leaving the relative high at the price level of $302.42. After reaching this new upward benchmark level, Ethereum's performance worsened considerably and it lost Bitcoin's wake. Right now it is resting on the $289 support level and the technical aspect is one of bearish continuity.
Above the current price level, the first target is to exceed the recent highs at the $302 price level. Above this price, the next bullish target at the price level of $306.30 (Congestion resistance). Once this level is moved to support, the next target at the price level of $315.97 (price congestion resistance) and where the ETH/USD at 240-Min would likely meet the SMA200 which is currently passing through the $320 price level.
Below the current price, the primary support is at the current price level of $289 (price congestion support) and reinforced by the presence of two significant moving averages at the price level of $286 (SMA100 and EMA50). Below these important technical supports, the ETH/USD should rely on the following support at the price level of $270 (congestion price support).
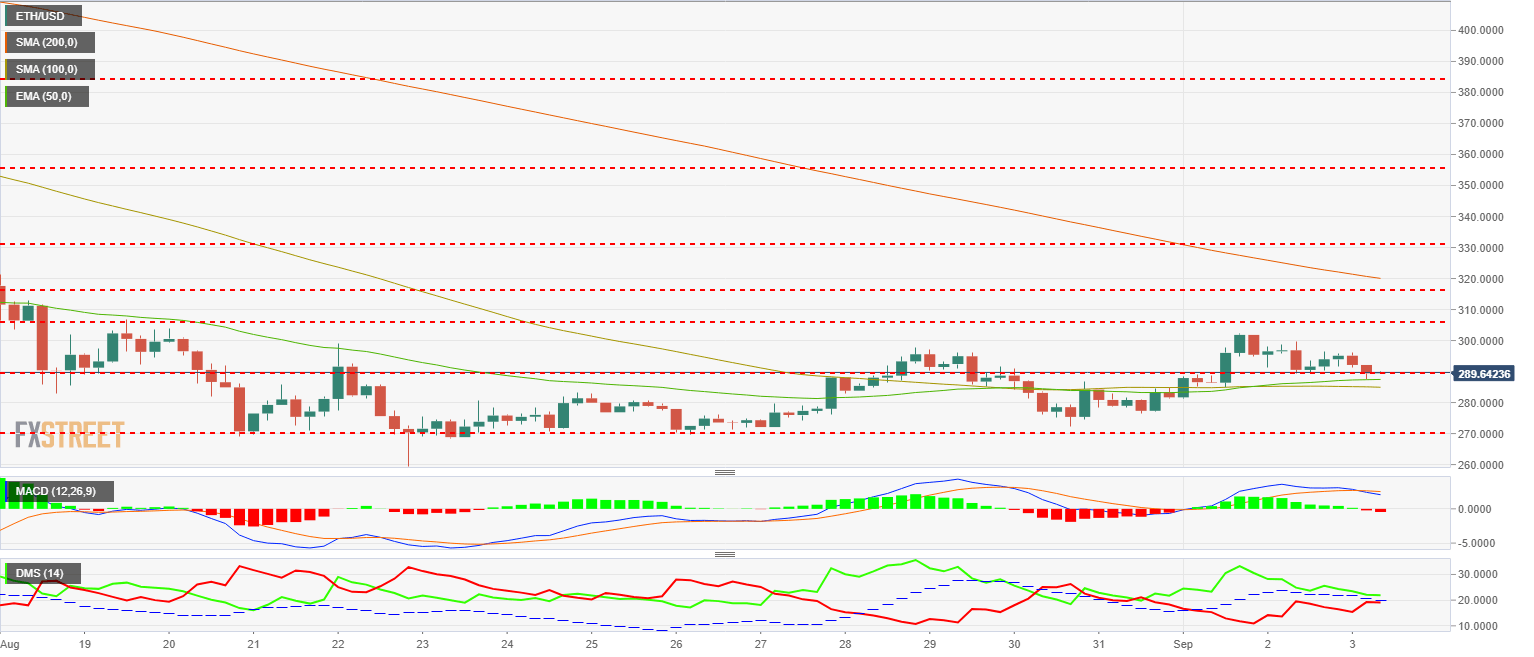
The MACD at 240-Min is cut down and has a slight divergent structure. It is interesting to see how this scenario is going to develop taking into account the presence of two important moving averages as close supports.
The DMI at 240-Min shows us buyers in decline but still ahead of some sellers who do seem to trust their positions and have been increasing in recent hours. Keep in mind that buyers stay above the ADX line, an ADX that is below 20 and shows the low strength of the ETH/USD.
XRP/USD 240-Min
The XRP/USD is in a similar situation to Ethereum, perhaps worse. It didn't leave any new highs over the weekend but did sign up quickly for the price drops.
The XRP/USD is quoted at the $0.335 price level. Above the current price, the first resistance at the $0.368 price level (relative highs, price congestion resistance, and SMA200). If buyers appear and this level can be conquered, the next target at the $0.412 price level (congestion resistance). We see how in this last objective, Ripple has an important challenge given the wide range of price to cover.
Below the current price, the first support is just below the current price level of $0.335 (SMA100 and EMA50). In the event of losing this critical support level, the next support is at the price level of $0.320 (price congestion support) and finally we see support at the price level of $0.298 (price congestion support).
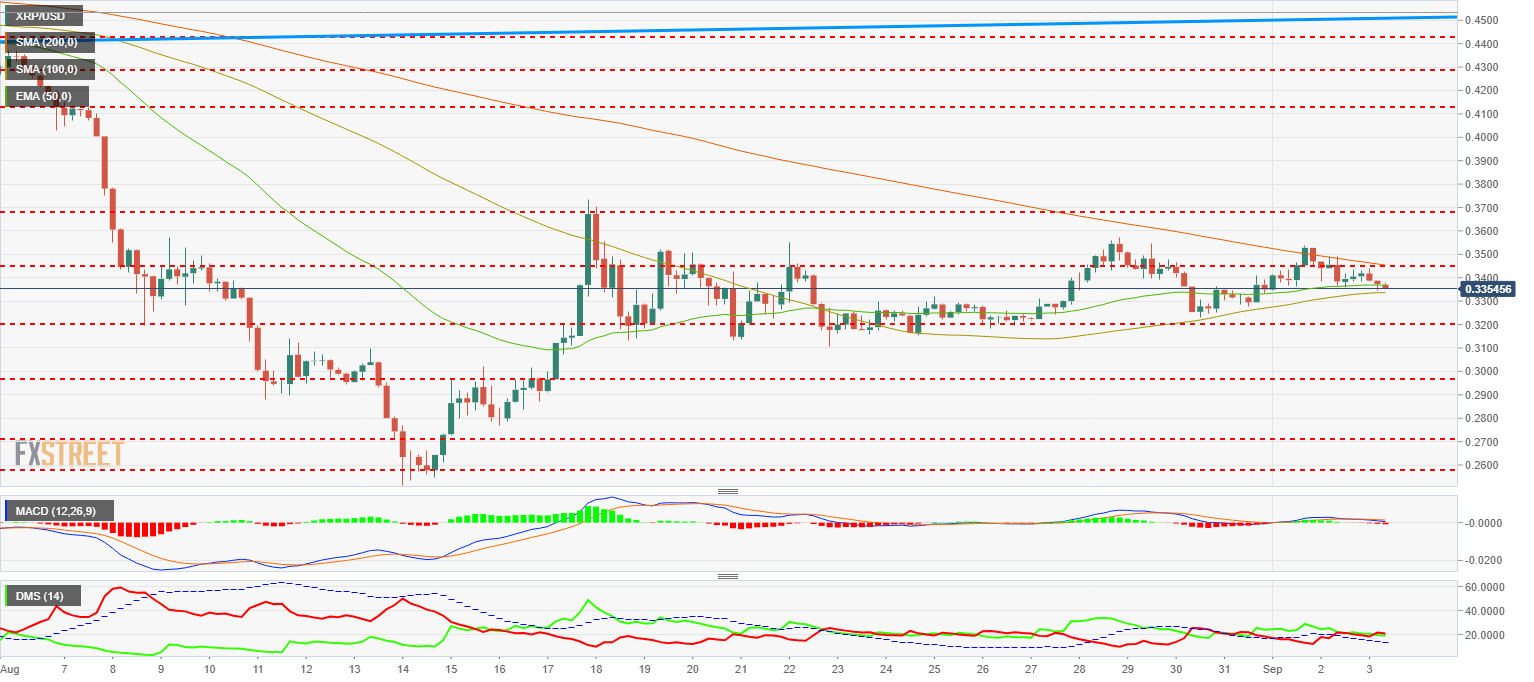
The MACD at 240-Min shows a very flattened profile that rests on the indicator's 0 level. This is a confirmation of the XRP/USD's lack of clear direction.
The Directional Movement Index at 240-Min shows us a structure that is slightly advantageous to sellers, both at level 20 of the indicator but with an ADX at minimum levels and with possibilities for further downward movement. The reading is one of absolute lack of trend force.
Author

Tomas Salles
FXStreet
Tomàs Sallés was born in Barcelona in 1972, he is a certified technical analyst after having completing specialized courses in Spain and Switzerland. He expanded his technical training following the guidance of great experts on the financial markets.



