Top 3 Price Prediction Bitcoin, Ethereum, Ripple: Bitcoin must endorse the time of Ethereum has come
- ETH/BTC shows a new bullish scenario for the Ethereum and Altcoin segment.
- Bitcoin must give up market share to allow for a broader flow of cash to the Altcoin segment.
- Lithuania introduces the first national digital currency model.

The Central Bank of Lithuania has announced the launch of the first digital currency issued by a national banking institution. For the time being, the usefulness of this coin in digital form will be minimal, but the information and experience it will bring to the issuing bank will be of very-high value.
The rush to launch this digital currency is motivated by the need to occupy a space in the market that could be filled by other projects, which is a concern for regulators. In the words of Marius Jurgilas, Deputy Governor of the Central Bank of Lithuania, "No one in the central bank community was thinking seriously about the digital currency before we realized that there is a legitimate threat of someone else taking our space".
Also from Japan, it was announced yesterday that an experimental exercise would begin to understand better the implications of launching a digital yen.
The COVID-19 pandemic has accelerated development plans in this field, due to the need to limit the use of physical currencies as a tool for spreading the disease. Also, the associated economic crisis has pushed state budgets to the limit and the need to control the underground economy and fraud as a priority.
The crypto market remains in a choke point, and after signs of a possible upward shift yesterday, the market was once again disappointed to see Bitcoin in the low range of the $8900 to $9000 choke point.
The battle for dominance of the crypto market continues, and today Ethereum is on the upside, while Bitcoin is reluctant to lose the 65.75 level because losing it would quickly take it to the 64 levels.
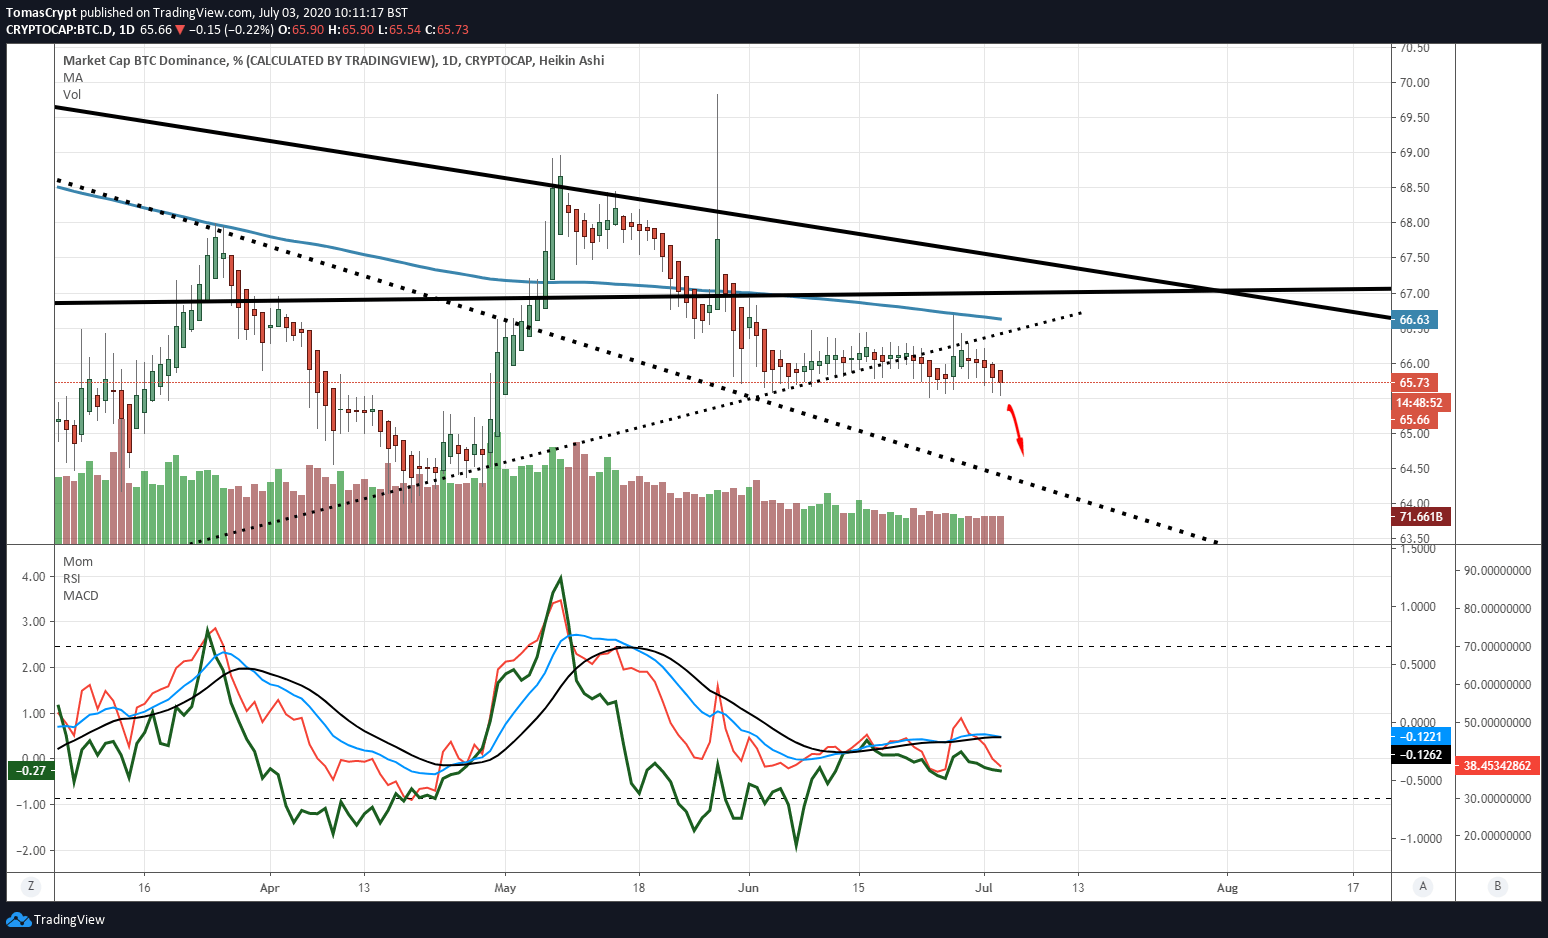
The concurrence of both situations points to a possible downward movement in the Bitcoin Dominance chart, which would boost Ethereum value against Bitcoin.
ETH/BTC Daily Chart
The ETH/BTC pair is currently trading at the price level of 0.02497 and is moving upward, trying to gain distance from yesterday's bearish trend line. The positive movement of Ethereum needs to go above the 0.0258 level to confirm the new bullish scenario for the medium term.
Above the current price, the first resistance level is at 0.0258, then the second at 0.0277 and the third one at 0.0296.
Below the current price, the first support level is at 0.0248, then the second at 0.0235 and the third one at 0.0225.
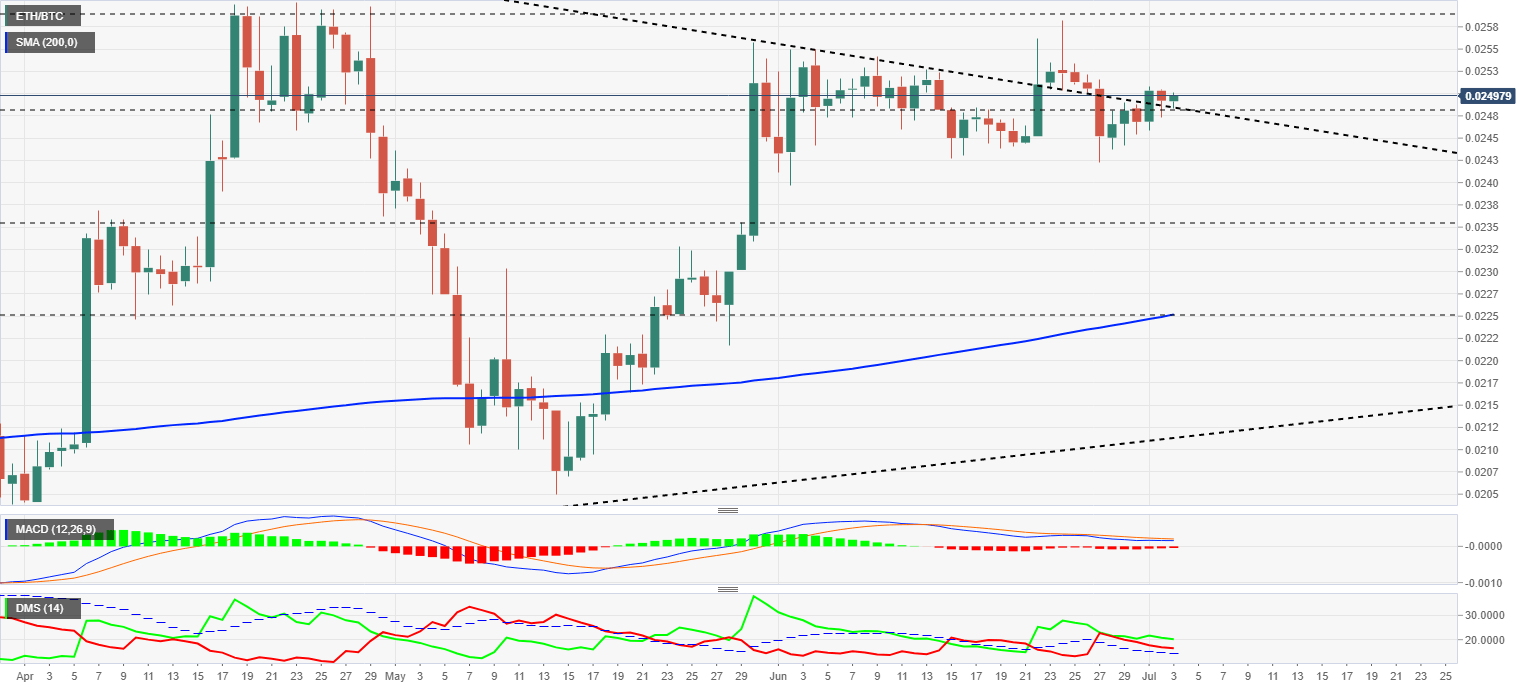
The MACD on the daily chart continues to show a completely flat profile with no clear direction. This type of structure usually has a violent resolution of uncertain course.
The DMI on the daily chart shows bulls dominating the pair despite the loss of strength over the past few days. The bears are moving above the ADX line, which prevents declaring a full-bullish situation for the ETH/BTC pair.
BTC/USD Daily Chart
The BTC/USD pair is currently trading at $9111 and is reacting slightly upwards after testing the basis of the current expansive sideways scenario again yesterday. At the high end of the scenario, the limit is at $10350. From there it could rebound to the trend line that guided the recovery from the March lows.
Above the current price, the first resistance level is at $9500, then the second at $10350 and the third one at $10400.
Below the current price, the first support level is at $8960, then the second at $8730 and the third one at $8375.
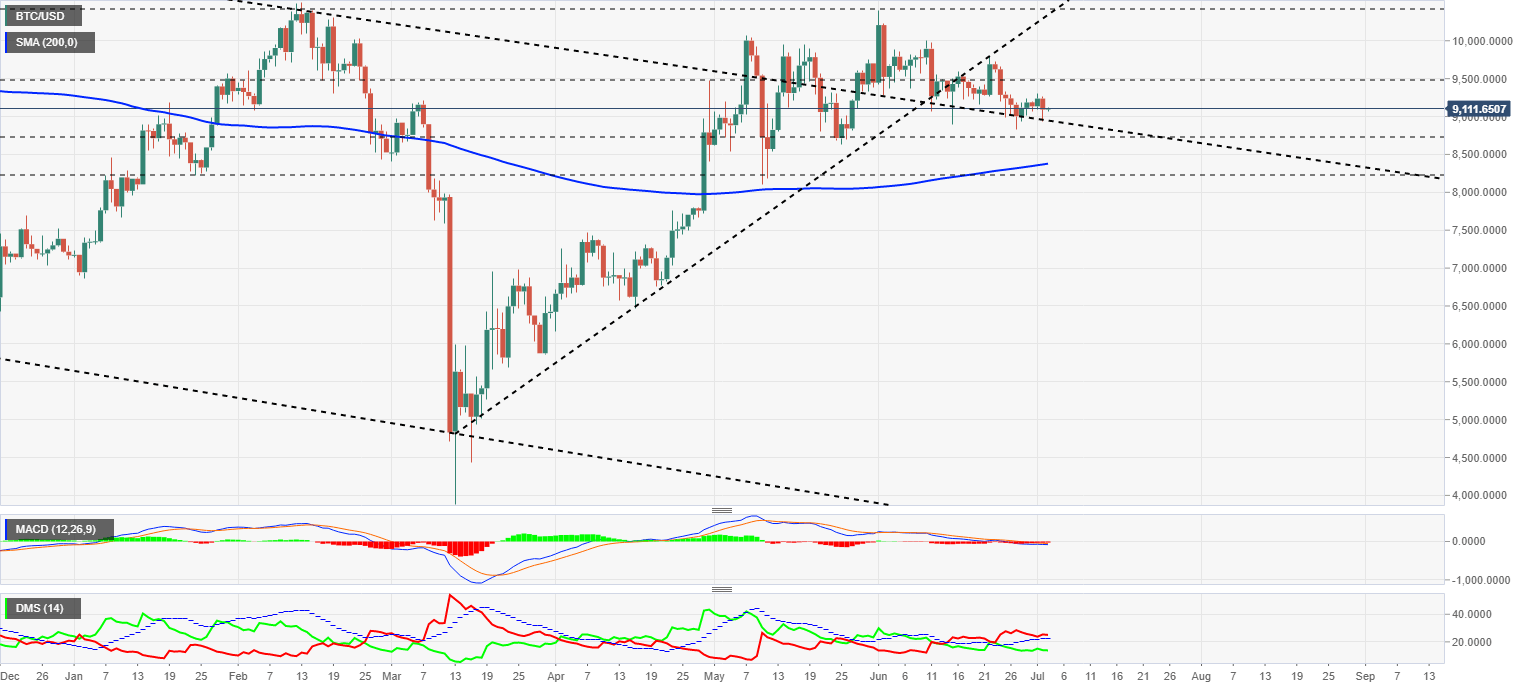
The MACD on the daily chart continues to reflect the lack of volatility and shows an extremely flat profile that slightly penetrates the indicator's downward slope.
The DMI on the daily chart shows the bulls controlling the pair. The sell-side is looking for support on the ADX line, support which if it fails would cancel out the downward momentum of the BTC/USD pair.
ETH/USD Daily Chart
The ETH/USD pair is currently trading at $227.4 while remaining in the current trading congestion.
Above the current price, the first resistance level is at $233, then the second at $246 and the third one at $261.5.
Below the current price, the first support level is at $222, then the second at $200 and the third one at $190.
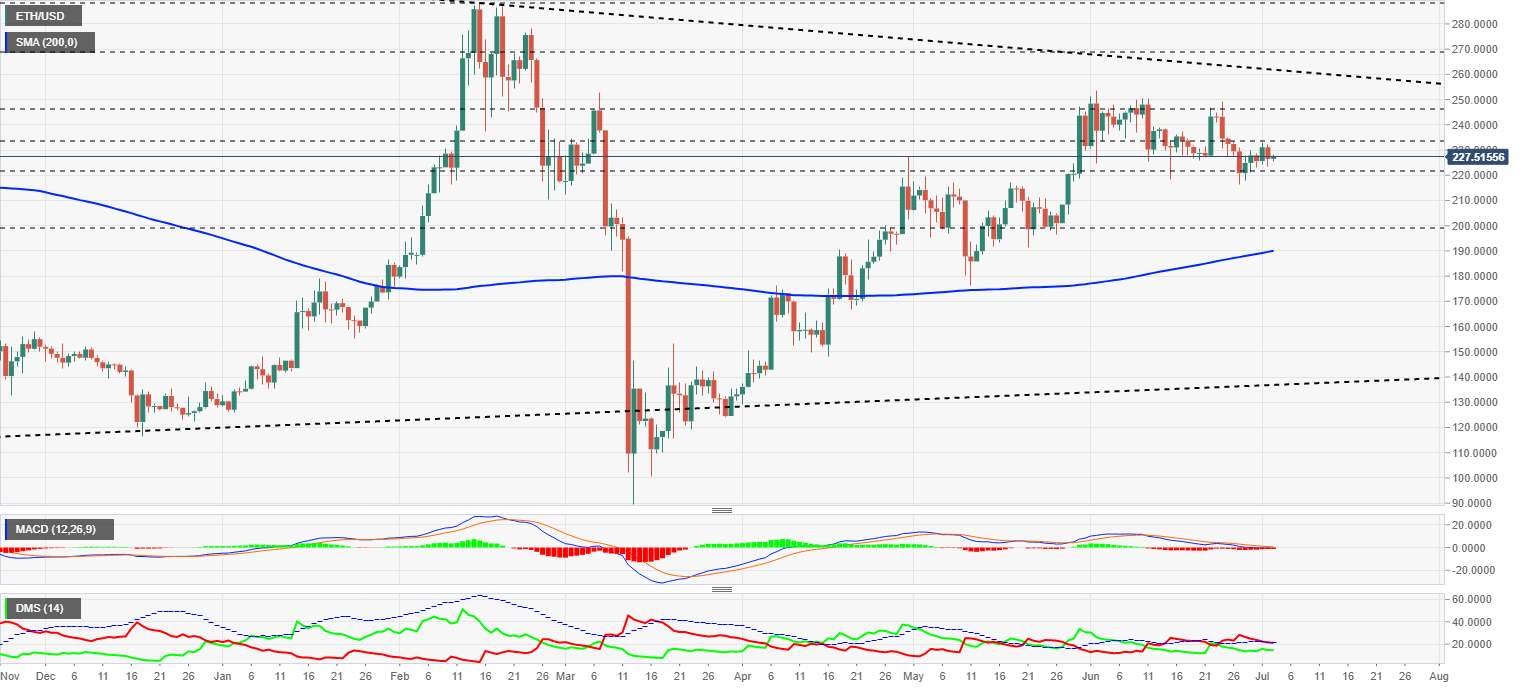
The MACD on the daily chart faithfully reflects the lack of price volatility. The indicator profile is entirely flat and moves just above the 0 levels of the indicator. This type of structure usually develops with a violent exit from the current price passivity.
The DMI on the daily chart shows bears drilling down the ADX line, which would deactivate the current bearish pattern. The bulls are not reacting upwards at the moment, perhaps waiting for a confirmation of the sellers' loss of momentum before moving upwards.
XRP/USD Daily Chart
The XRP/USD pair is currently trading at the price level of $0.1773 and is up 1.40%. The Ripple's situation is critical as it is moving through a zone that lacks clear support and could lead to massive sales to reach $0.14 first and $0.10 later. Only above the $0.195 level would the danger disappear.
Above the current price, the first resistance level is at $0.184, then the second at $0.195 and the third one at $0.205.
Below the current price, the first support level is at $0.165, then the second at $0.14 and the third one at $0.10.
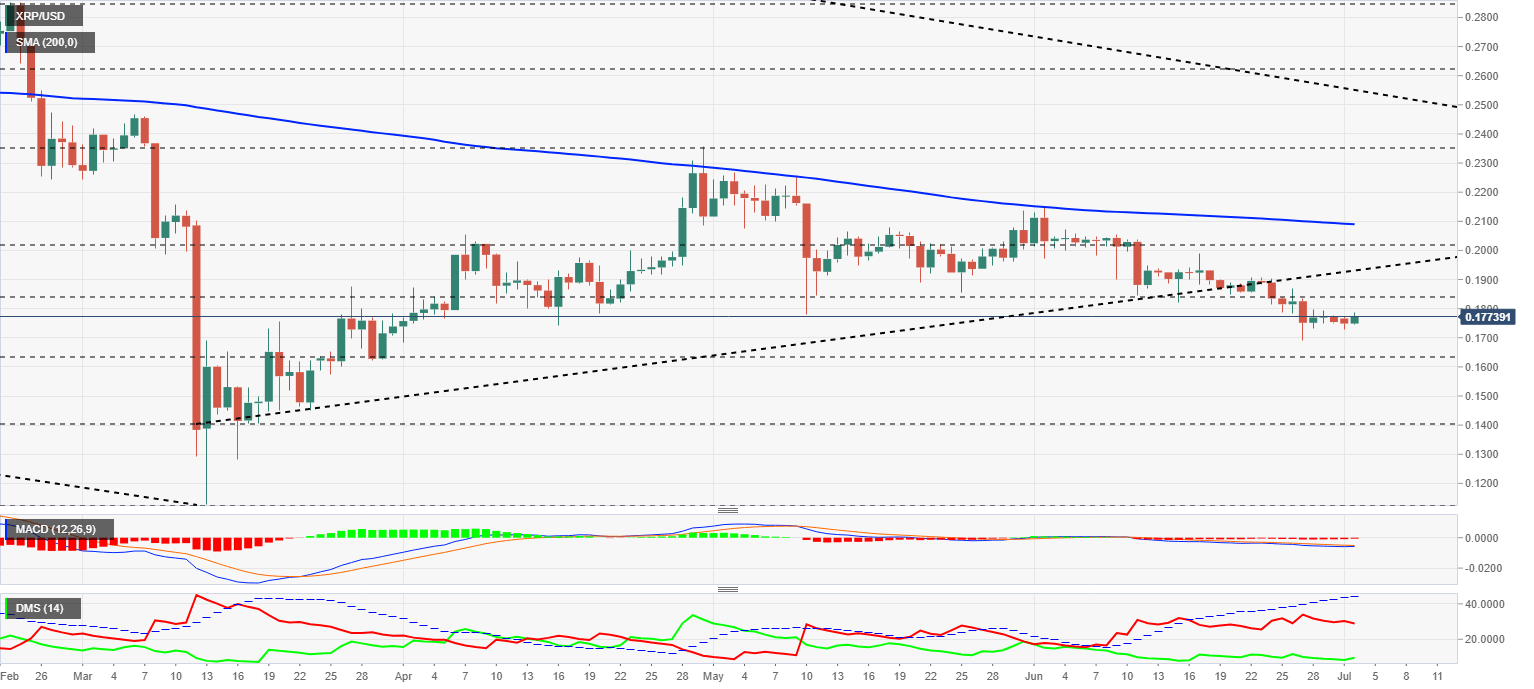
The MACD on the daily chart shows a very flat profile, suggesting a possible upward movement of little intensity. The proximity of the neutral line of the indicator limits any upward movement.
The DMI on the daily chart shows bears losing strength but still a very strong level. The bulls are rebounding upwards, but have not reached a level that would allow them to predict an upward movement in the short term.
Author

Tomas Salles
FXStreet
Tomàs Sallés was born in Barcelona in 1972, he is a certified technical analyst after having completing specialized courses in Spain and Switzerland. He expanded his technical training following the guidance of great experts on the financial markets.