Top 3 Price Prediction Bitcoin, Ethereum, Ripple: Altcoin season confirmed
- Second-line Altcoins take turns offering explosive price hikes.
- Bitcoin is giving up ground in the struggle for dominance, but it is not Ethereum that collects the profits.
- Ripple manages to enter the safe zone and bets on the upward continuity.

The Altcoin segment is in full swing, and today, projects such as Stellar Lumens (ADA/USD), Tron (TRX/USD) or Algorand (ALGO/USD) are launching their moon rockets.
It was also remarkable the behavior of Ripple, that in an unexpected recovery exceeded the $0.20 level, escaping from the bearish scenario in which it was moving.
The war for dominance continues to set the tone of the market, and for the moment, Ethereum continues to win the battles, not the war.
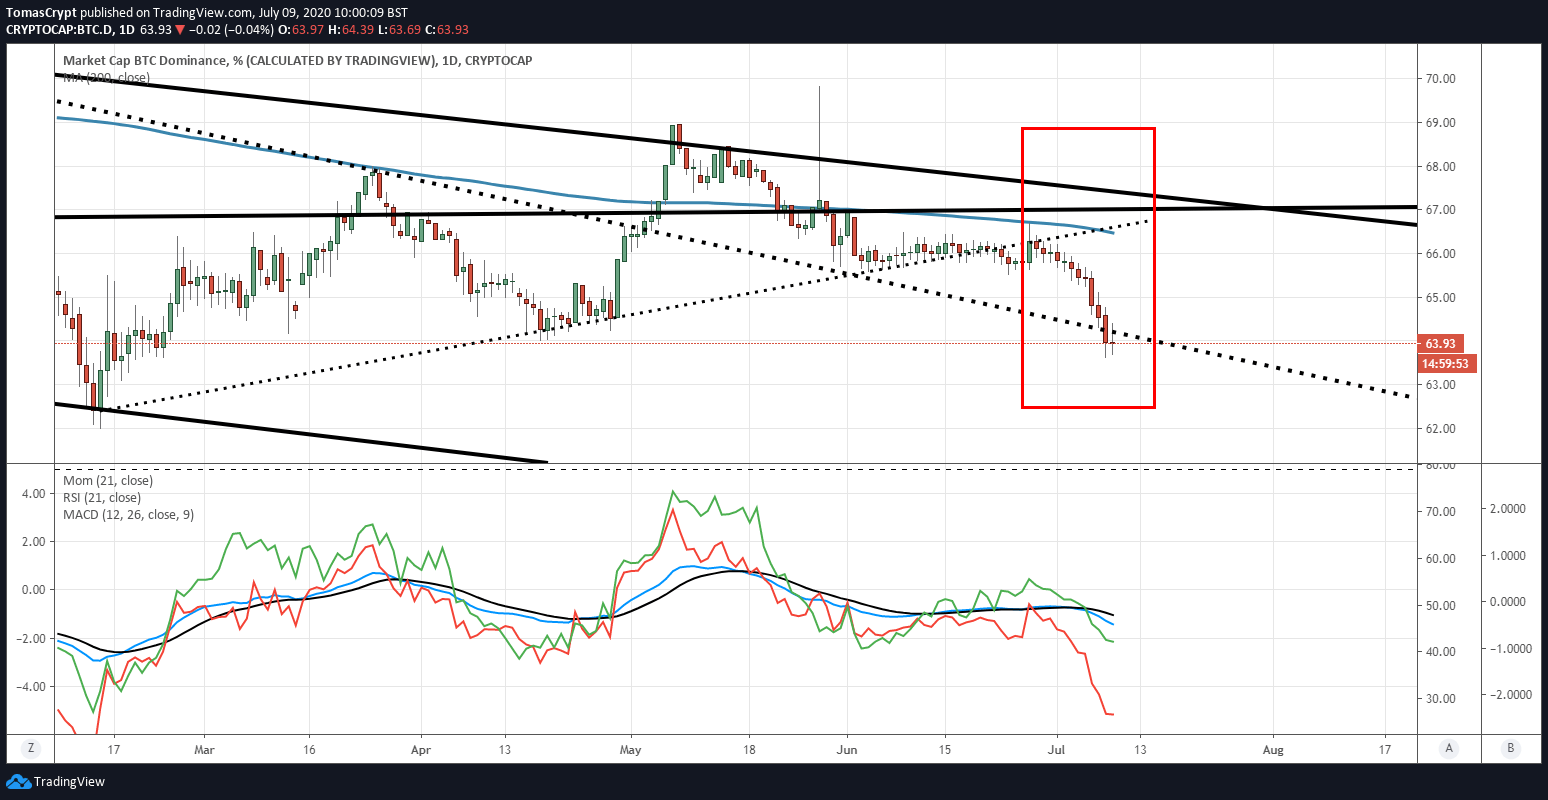
Yesterday Bitcoin lost 64% market share, a first support level within the bearish channel that governs Bitcoin's current market share balance. The bearish target is below the 60% level. The weakness of Bitcoin favors the Altcoin season that we see these days.
The proper behavior of Ethereum is partly due to the weakness of Bitcoin, something that is evident when we look at the Ether dominance graph.
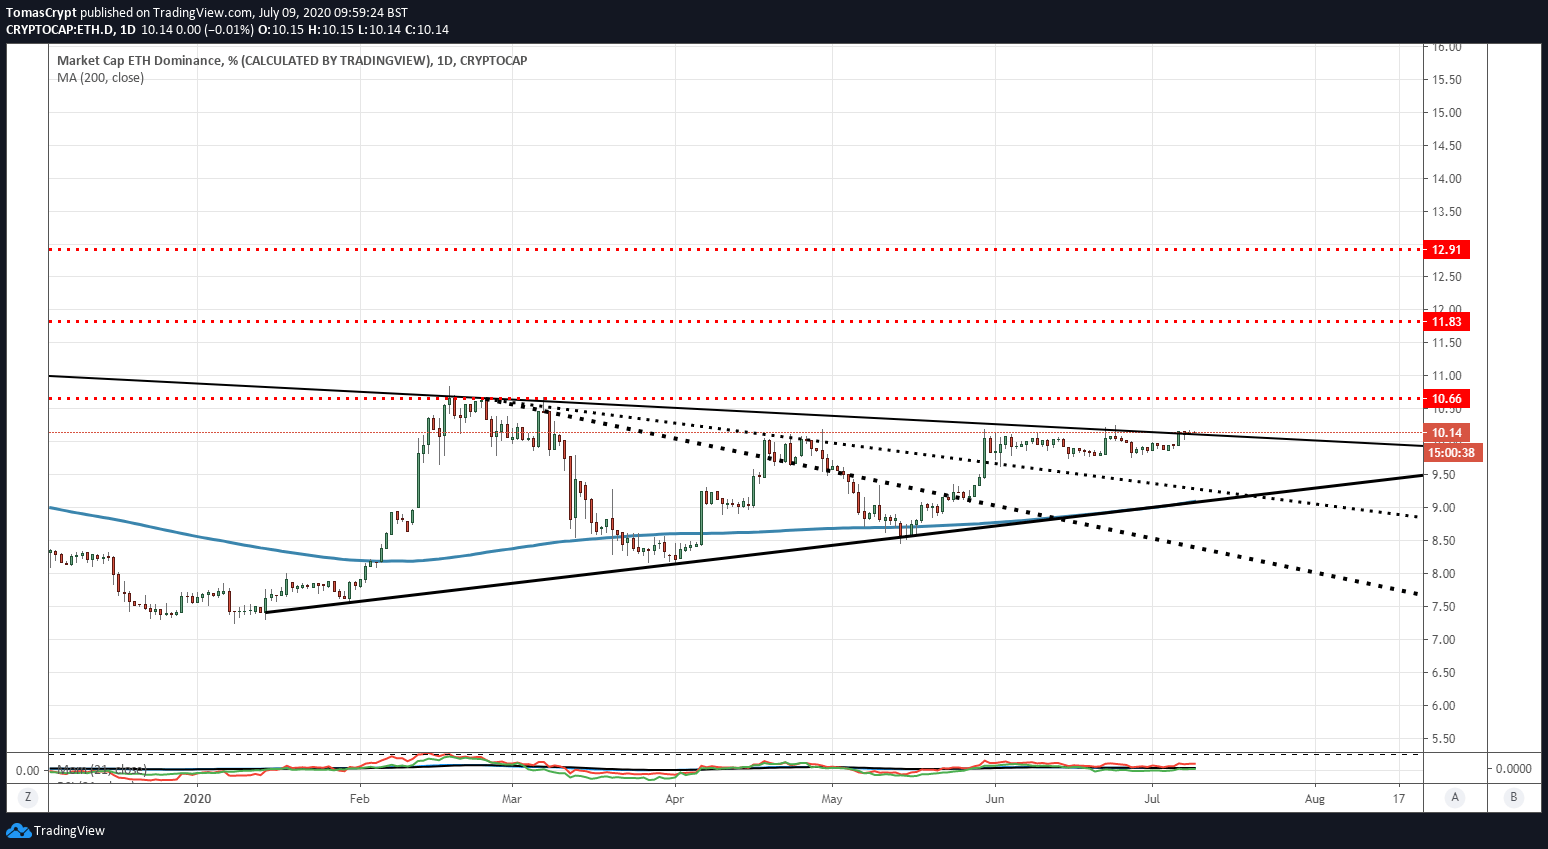
Ethereum managed to break the bearish trend on its dominance chart three days ago. Still, it is having a hard time breaking away from the resistance line – now support – and developing an uptrend in the new favorable scenario. The technical targets for market dominance for the Ethereum are 10.66%, 11.83% and 12.91%.
ETH/BTC Daily Chart
The ETH/BTC pair is currently trading at the price level of 0.02618, on its way to the next resistance level at 0.0278. The 200-day simple moving average increases the bullish profile and confirms the momentum change in the ETH/BTC pair.
Above the current price, the first resistance level is at 0.0278, then the second at 0.0296 and the third one at 0.0307.
Below the current price, the first support level is at 0.0259, then the second at 0.0248 and the third one at 0.0235.
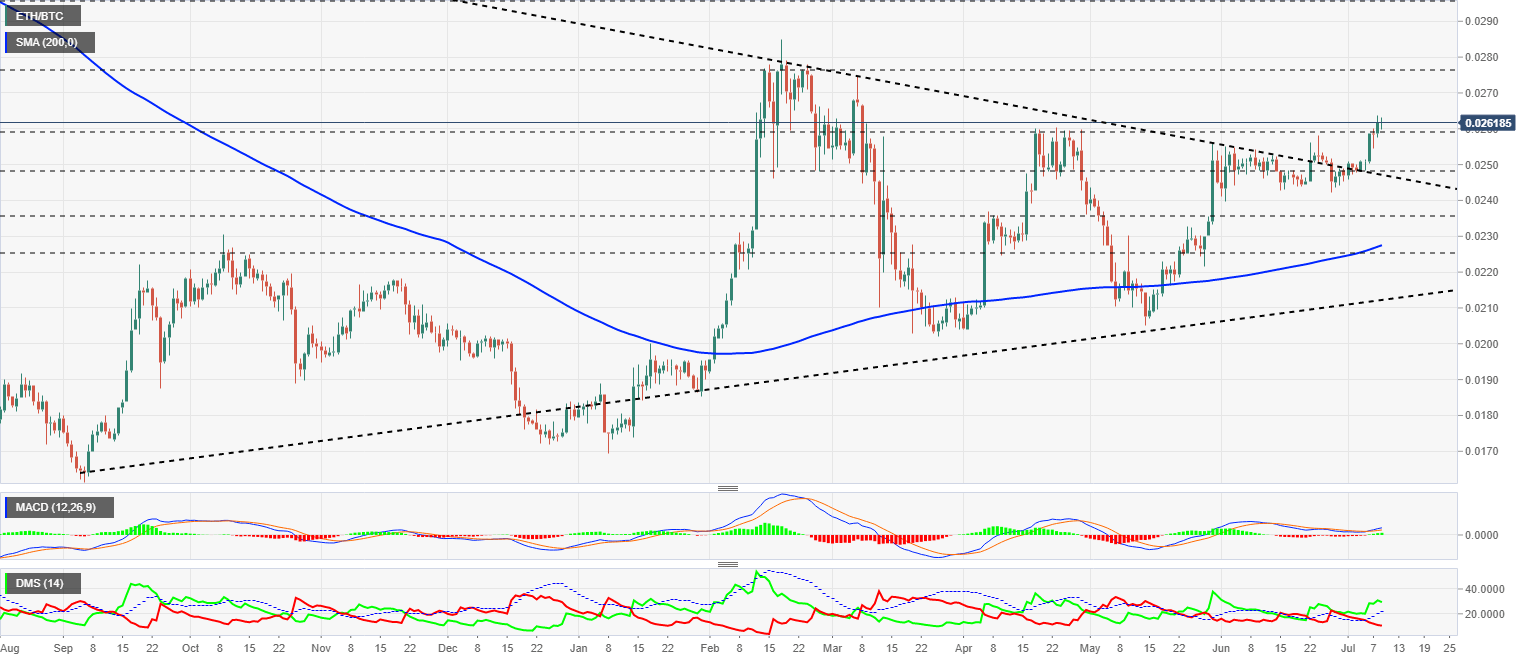
The MACD on the daily chart has a very positive bullish profile despite the small gap between the moving averages.
The DMI on the daily chart shows bulls dominating the pair with a good advantage over the bears. The selling side continues to lose strength and is not interested in approaching the bulls.
BTC/USD Daily Chart
The BTC/USD pair is currently trading at the price level of $9389 and remains within a few points of the price congestion resistance at $9500.
Above the current price, the first resistance level is at $9500, then the second at $10450 and the third one at $11475.
Below the current price, the first support level is at $8900, then the second at $8750 and the third one at $8475.
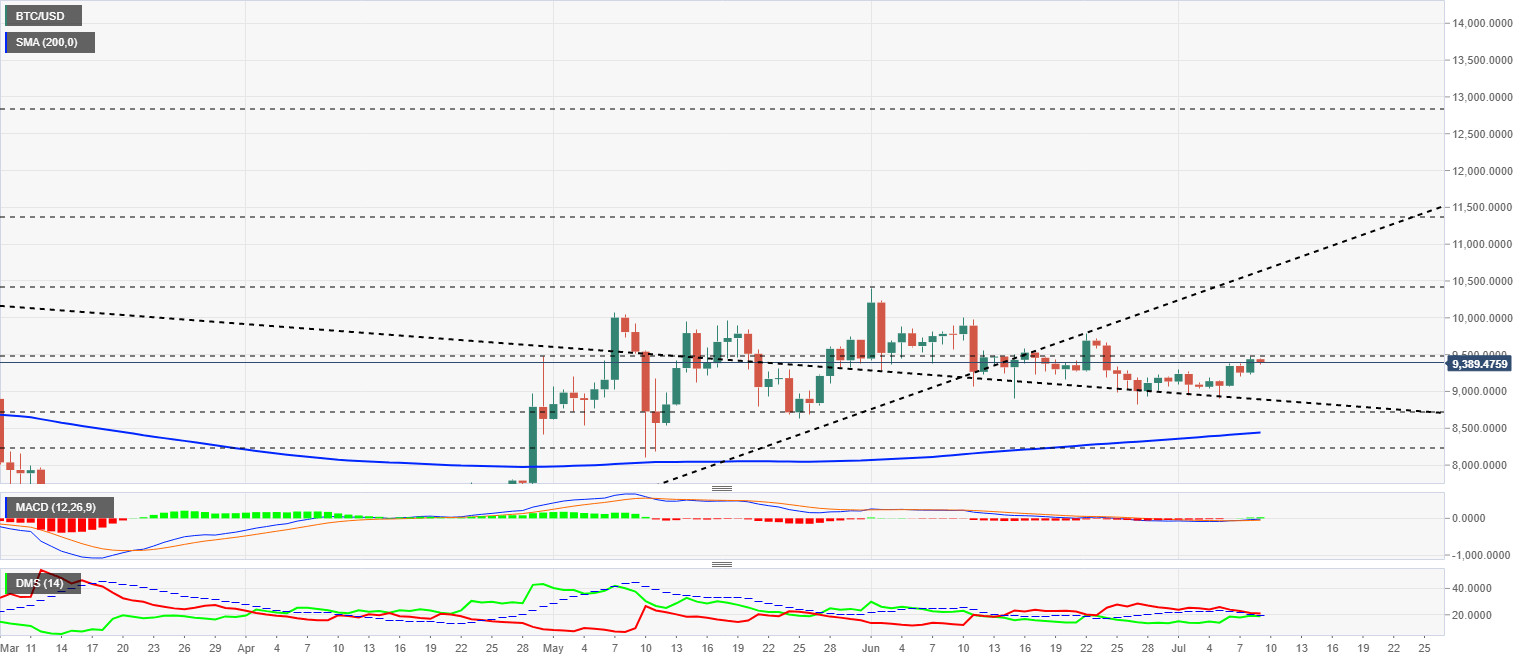
The MACD on the daily chart crosses the lower border of the chart, but the presence of the zero levels of the indicator will make the bullish movement of the BTC/USD pair very difficult.
The DMI on the daily chart shows a technical tie between the two sides of the market, reflecting the current indecision in BTC/USD.
ETH/USD Daily Chart
The ETH/USD pair is currently trading at the $246 price level and is having a hard time breaking out of the $247 resistance level. The 200-day simple moving average is accelerating upward, providing support for the uptrend in the medium term.
Above the current price, the first resistance level is at $247, then the second at $260 and the third one at $270.
Below the current price, the first support level is at $235, then the second at $220 and the third one at $200.
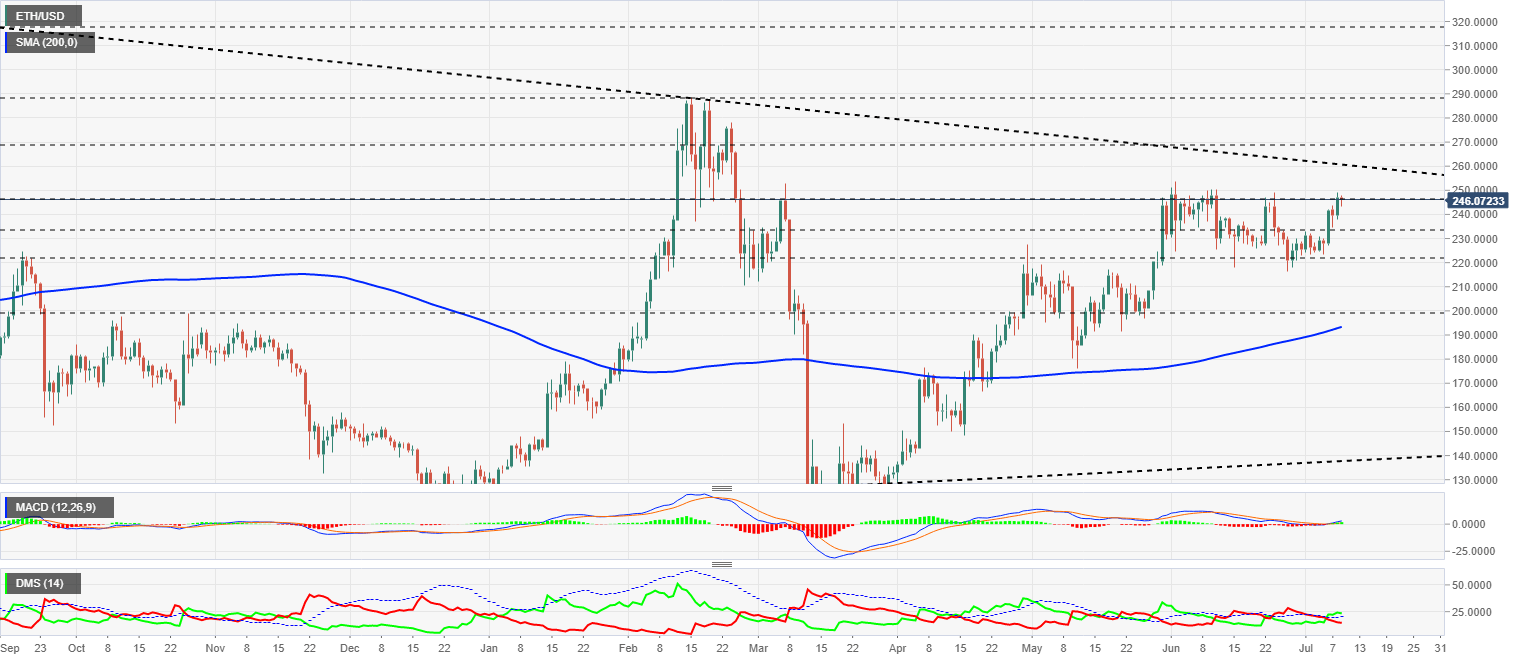
The MACD on the daily chart is crossing upward after being supported by the zero levels of the indicator. The opening between the moving averages is insufficient at the moment, so the behavior of the next sessions is of great importance.
The DMI on the daily chart shows the bulls controlling the pair but with a small advantage that keeps the bears in the game.
XRP/USD Daily Chart
The XRP/USD pair is currently trading at $0.2041 after yesterday's significant rise. XRP/USD has managed to escape from the dangerous downtrend it has been in for the past few weeks. The 200-day simple moving average passes through the $0.21 level, making that level key to price development in the short term.
Above the current price, the first resistance level is at $0.21, then the second at $0.235 and the third one at $0.25.
Below the current price, the first level of support is at $0.20, then the second at $0.196 and the third one at $0.185.
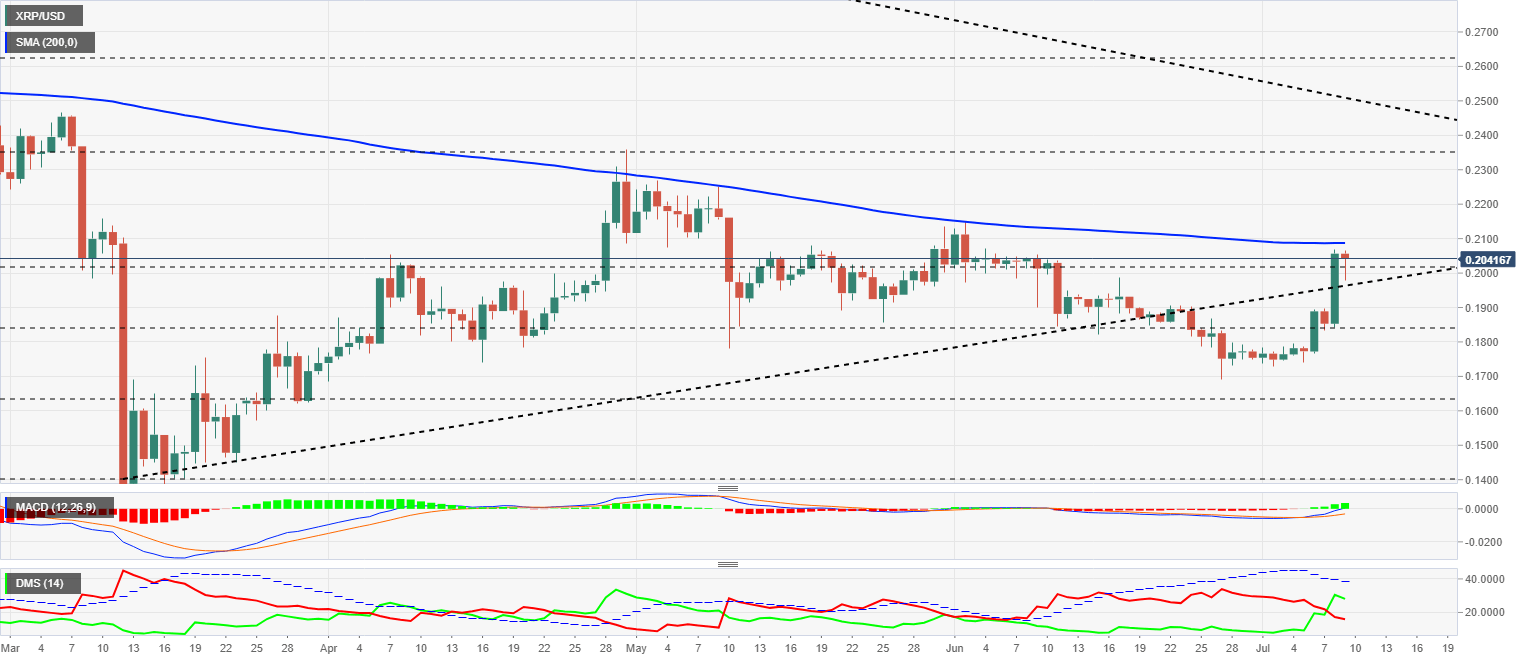
The MACD on the daily chart shows an expansive bullish profile due to the tilt and openness between the main moving averages. The position, just below the indicator's zero levels, makes the upbeat process initiated by Ripple difficult.
The DMI on the daily chart shows the bulls controlling the pair temporarily. Both sides of the market are moving below the ADX line, which could facilitate sudden changes in the leadership of the XRP/USD pair.
Author

Tomas Salles
FXStreet
Tomàs Sallés was born in Barcelona in 1972, he is a certified technical analyst after having completing specialized courses in Spain and Switzerland. He expanded his technical training following the guidance of great experts on the financial markets.


